1198
Assessment of Gd concentration estimated in DCE-MRI with multiple flip angles1Radiology, Weill Cornell Medicine, New York, NY, United States, 2Radiology, New York University School of Medicine, New York, NY, United States
Synopsis
The purpose of this study is to assess the accuracy of Gadolinium-based contrast agent (GBCA) concentration measured using the novel DCE-MRI method with two flip angles, without using the pre-contrast T1 measurement. The accuracy of the proposed method was assessed using the conventional approach with pre-contrast T1 measurement as well as the Gd concentration measurement using Inductively coupled plasma-mass spectrometry using the blood samples collected at the end of each scan. The results exhibited a strong correlation and agreement between the Gd concentration from the proposed two flip angle method and those from the conventional MRI method and ICP-MS analysis.
Introduction
The purpose of this study is to assess the accuracy of Gadolinium-based contrast agent (GBCA) concentration measured using the novel DCE-MRI method with two flip angles (1), without the need to acquire pre-contrast T1 maps. We have previously show that pre-contrast T1 values can be estimated from dynamic scan data using two or more flip angles as proposed by the active contrast encoding MRI method (2). The DCE-MRI study was conducted using the recently developed 3D ultra-short echo time (UTE) golden-angle radial sparse parallel (GRASP). This imaging method provides dynamic 3D images with high temporal and spatial isotropic resolutions with negligible T2* effect. In order to assess the accuracy of the two-flip-angle method, the tail-end levels of the vascular signals from the 3D-UTE-GRASP data were compared with the Gd concentration ([Gd]) in blood samples measured by Inductively Coupled Plasma Mass Spectrometry (ICP-MS).Methods
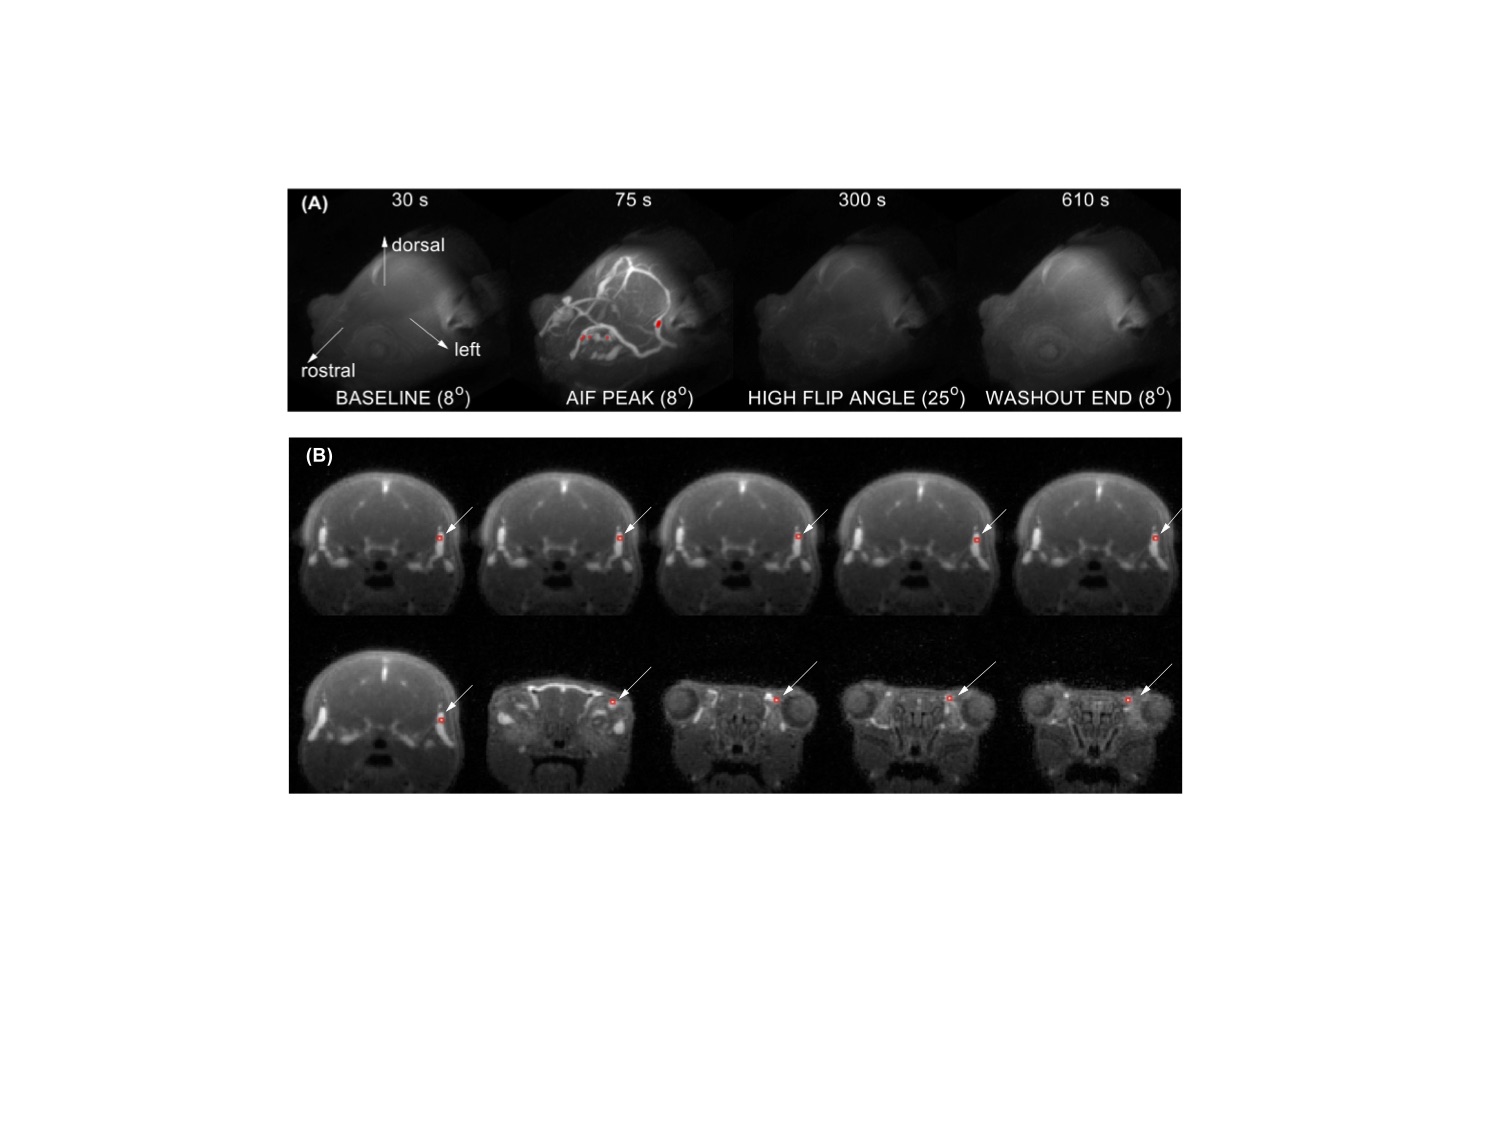
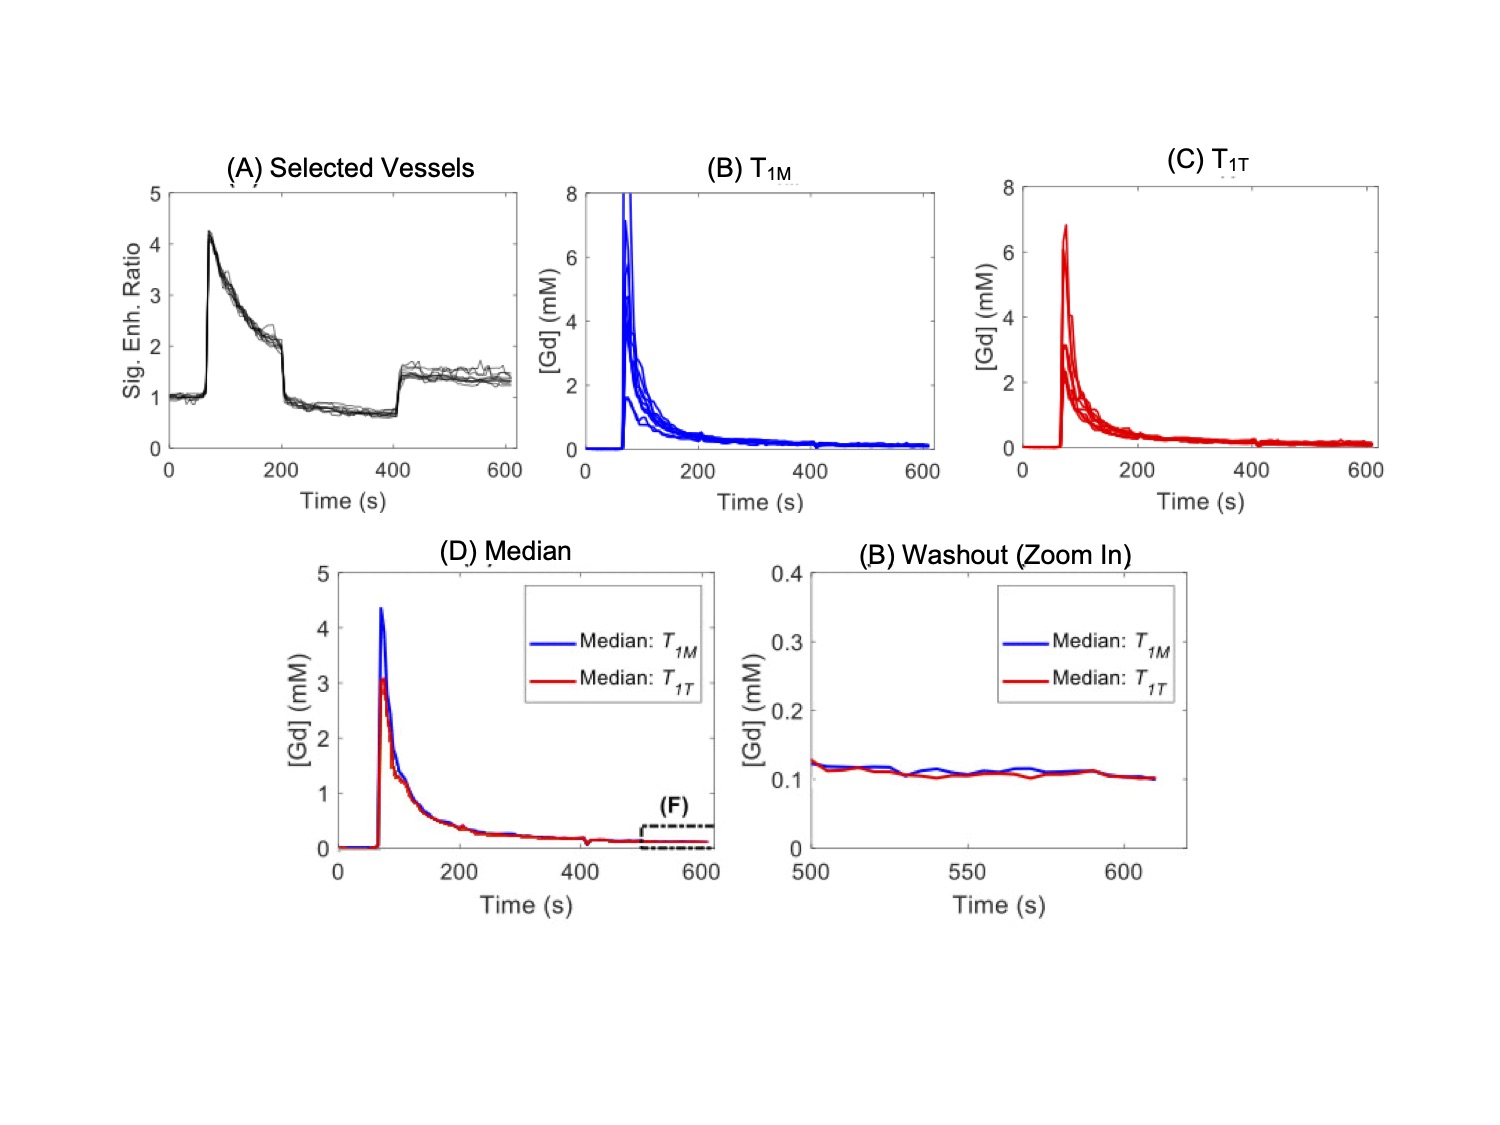
DCE-MRI experiments were carried out with C57BL6 mice (n = 11) using a 7T Bruker MRI system. A 3D ultrashort echo time (UTE) sequence (TR / TE = 4 / 0.028 ms) with the Golden-angle Radial Spare Parallel (GRASP) method (3), namely 3D-UTE-GRASP (4), was used for pre-contrast T1 mapping and dynamic data acquisition. For both scans, the spatial resolution was 0.156 x 0.156 x 0.156 mm3 by using image matrix = 128 x 128 x 128 and field of view = 20 x 20 x 20 mm3. Pre-contrast T1-mapping was conducted by running the 3D-UTE-GRASP sequence to acquire 38,328 spokes in total with three flip angles (FA=8o/2o/12o; 12,776 spokes/flip angle) for the total scan time of 153 s. The DCE-MRI experiment consists of three flip angle segments (8o - 25o - 8o; 51,360 radial center-out spokes for each flip angle segment, about 205 s/segment) for the total scan time of about 10 minutes. A bolus of gadoxetate disodium (Eovist, Bayer HealthCare, Whippany, NJ) in saline at 0.10 mmol/kg body weight was injected through a tail vein catheter, starting 1 minute after the start of the 3D-UTE-GRASP sequence. The 3D-UTE-GRARSP images were reconstructed with temporal resolution of 5 s/frame.The initial area under the curve (IAUC) for the first 1 min post-injection was calculated for all the voxels in the head. The top 10 voxels were selected from the IAUC as vascular voxels with minimal partial volume effect with the surrounding tissue. Conversion of the image intensity of vascular voxels to Gd concentration ([Gd]) was conducted using two methods depending on how to determine the pre-contrast T1 values of vascular voxels:(i) T1 measured separately before DCE-MRI (T1M) using the variable flip angle method.(ii) T1 estimated from DCE-MRI data with two flip angles (T1T), by minimizing the gaps between the flip angle segments in the Gd concentration curve (Figure 1). The representative signal enhancement patterns of the selected vascular voxels are shown in Figure 2.
A retro-orbital blood sample was taken from each mouse around 90 s after completion of DCE-MRI scan. [Gd] measured by ICP-MS were used as reference standards to assess the accuracy of the [Gd] measured by DCE-MRI.
Results and Discussion
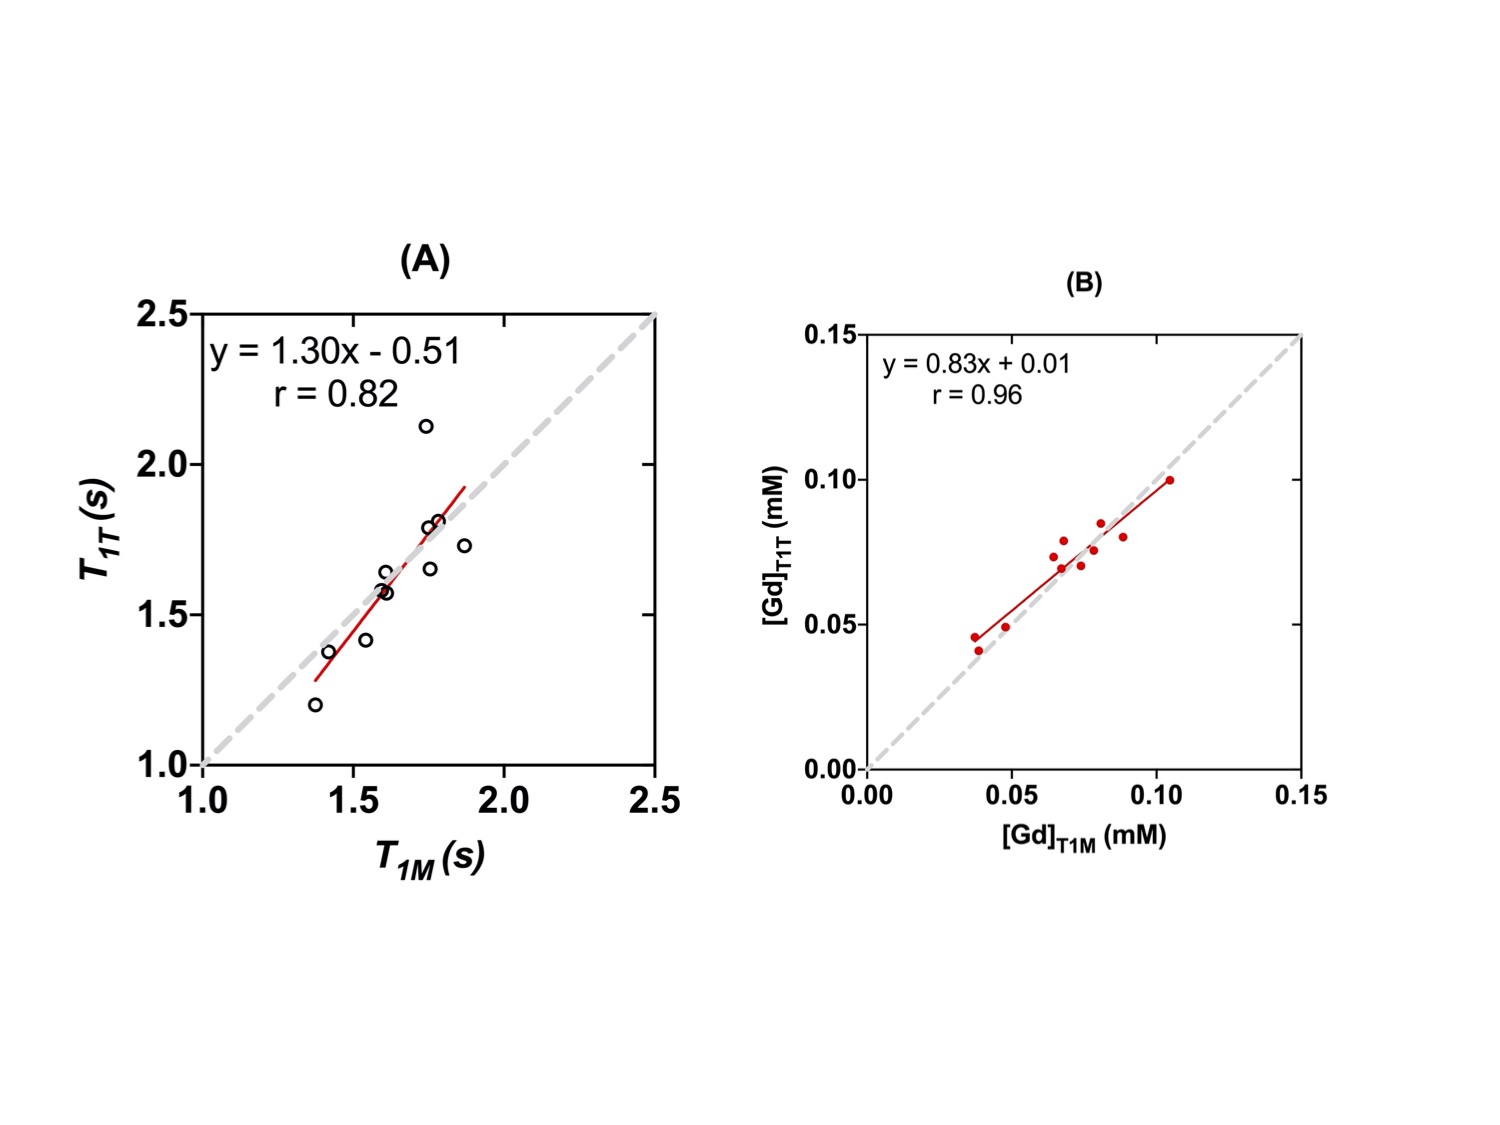
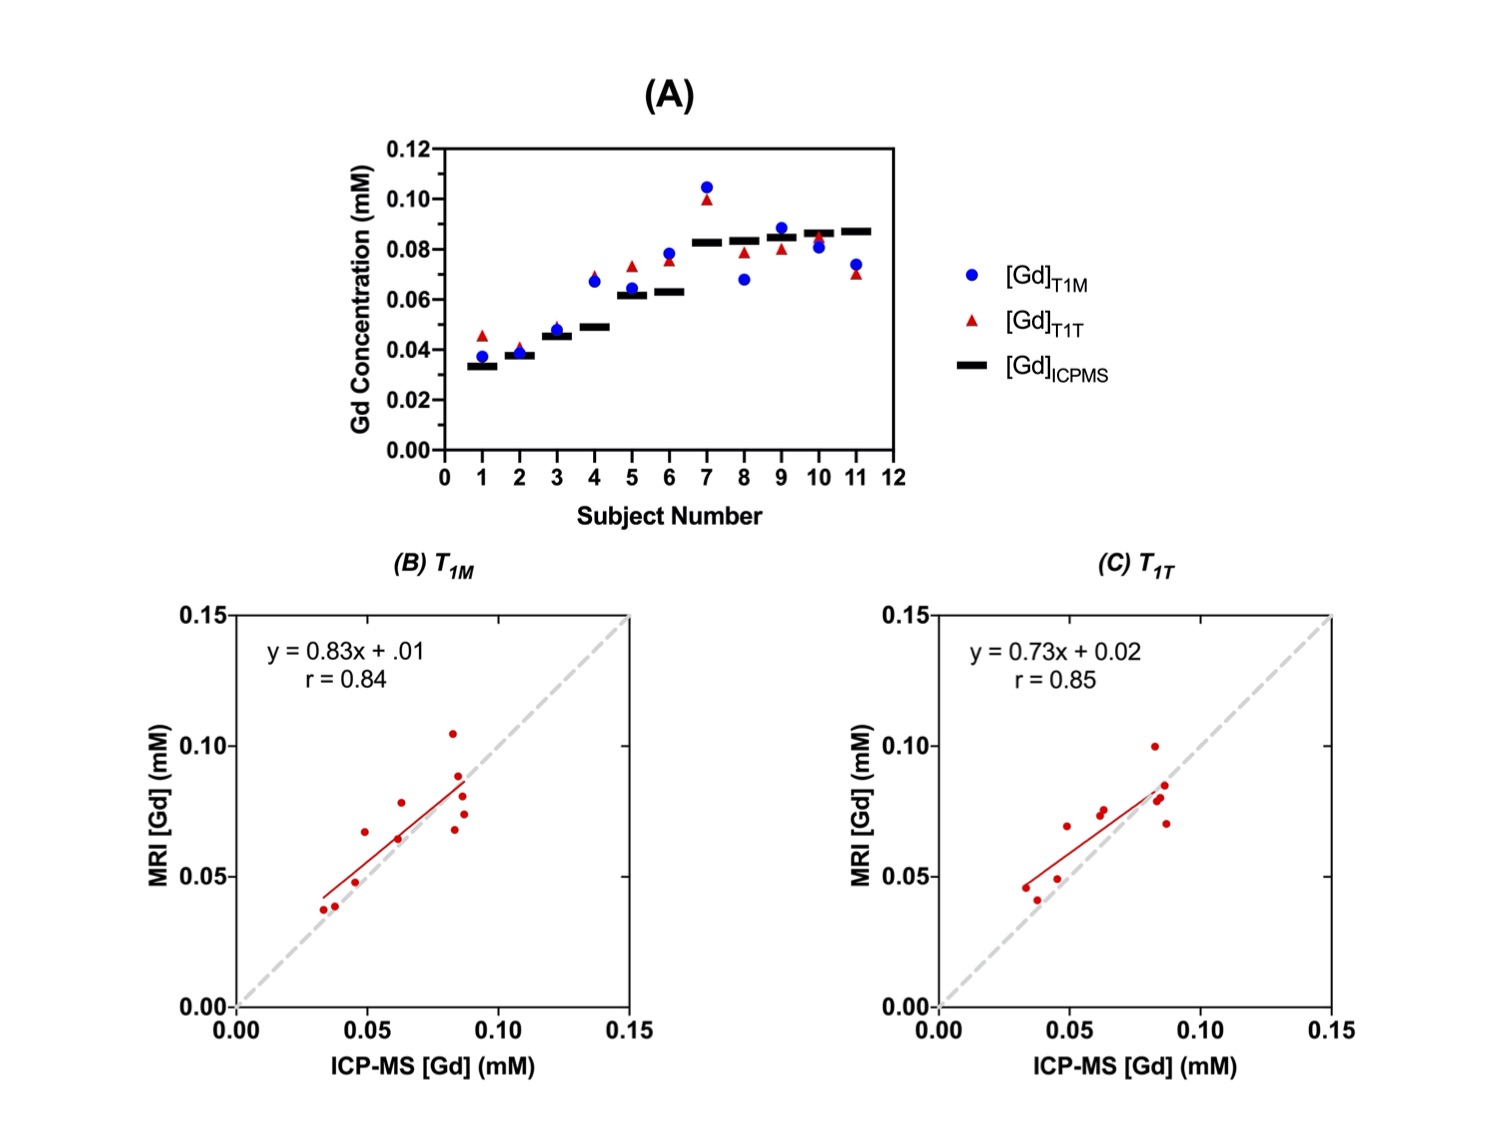
The estimated T1T values (1.63 ± 0.25 s) of the vascular voxels of all animals were not significantly different (p=0.28, Wilcoxon signed rank test) from the T1M values (1.64 ± 0.16s), with a strong correlation (r=0.82) between them (Figure 3). The [Gd] estimated using T1T (1.30 ± 51 mM) were not significantly different (p=0.423) from the [Gd] estimated using T1M (0.83 ± 0.101 mM), with a strong correlation (r=0.96). Furthermore, the [Gd] estimated using T1T were not significantly different (p=0.22) from those measured by ICP-MS (0.73 ± 0.85mM), with a strong correlation (r=0.85) (Figure 4).Most routine clinical DCE-MRI exams do not include T1 measurements due to the penalty of additional scan time required for T1 mapping, particularly when the field of view is large as in breast MRI and body imaging applications. The results in our study show that the [Gd] estimated using the proposed two-flip angle approach without using the pre-contrast T1 measurement is not significantly different from the [Gd] values estimated using the pre-contrast T1 measurement and the [Gd] measured using ICP-MS. This suggests that the pre-contrast T1 values do not have to be measured separately for accurate estimation of [Gd], when the dynamic scan is conducted using multiple flip angles, also referred to as the active contrast encoding (ACE) MRI method reported in previous work (1). The use of multiple flip angles can be optimally selected based on specific applications or the range of T1 values expected, which needs to be investigated in future studies.
Conclusion
This study substantiates the feasibility to incorporate the two-flip angle approach during DCE-MRI scan in order to estimate pre-contrast T1 maps while preventing the use of an extra scan to quantify T1 .Acknowledgements
This study was supported in part by grants from the National Institute of Health (Grant number: R01 CA160620, R01CA219964, UG3CA228699) and was performed at the Preclinical Imaging Core; a shared resource partially supported by the NYU Laura and Isaac Perlmutter Cancer Center Support Grant, (NIH/NCI 5P30CA016087 and NIH/SIG 1S10OD018337-01), and the NIBIB Biomedical Technology Resource Center grant (NIH P41 EB017183). Partial support was also funded by NSF-DMREF under Award Number DMR 1728858.References
(1) Zhang J, Winters K, Reynaud O, Kim SG. Simultaneous measurement of T1 /B1 and pharmacokinetic model parameters using active contrast encoding (ACE)-MRI. NMR Biomed 2017;30(9).
(2) Zhang J, Kim SG. Estimation of cellular-interstitial water exchange in dynamic contrast enhanced MRI using two flip angles. NMR Biomed. 2019 Nov;32(11):e4135. doi: 10.1002/nbm.4135. Epub 2019 Jul 26.
(3) Feng L, Grimm R, Block KT, Chandarana H, Kim S, Xu J, Axel L, Sodickson DK, Otazo R. Golden-angle radial sparse parallel MRI: combination of compressed sensing, parallel imaging, and golden-angle radial sampling for fast and flexible dynamic volumetric MRI. Magn Reson Med 2014;72(3):707-717.
(4) Zhang J, Feng L, Otazo R, Kim SG. Rapid dynamic contrast-enhanced MRI for small animals at 7T using 3D ultra-short echo time and golden-angle radial sparse parallel MRI. Magn Reson Med 2019;81(1):140-152.
Figures