1195
The sensitivity of amide, amine, creatine and guanidinium CEST in detecting pH at high MRI field1Department of Radiology and Radiological Science, Johns Hopkins University, Baltimore, MD, United States, 2F.M. Kirby Research Center for Functional Brain Imaging, Kennedy Krieger Research Institute, Baltimore, MD, United States
Synopsis
We compared the sensitivity of several chemical exchange saturation transfer (CEST) contrasts in detecting altered pH at 11.7 T MRI. Studies with egg white phantom revealed that amide and guanidium CEST contrasts in protein are suitable for pH mapping at the physiological relevant range (6.5-7.5), while amineCEST works well for pH lower than 6.5. Hypercapnia (20%) study in mouse brain indicated that creatineCEST showed both higher pH sensitivity and signal intensity compared with amide and guanidium CEST at the physiological pH range and is more suitable for in vivo pH studies at high field.
Purpose
One of the most important applications of CEST MRI is pH mapping, which has already shown great success in many disease diagnoses such as stroke (1), tumor(2), and renal pH homeostasis (3). Up to now, there are many CEST contrasts were discovered for pH mapping at high MRI fields such as amide (3.5 ppm) (1), amine (2.7 ppm) (4), guanidinium (2 ppm) (5), and creatine (2 ppm) (6) CEST. However, there are few comparisons in terms of pH sensitivity among those contrasts. In the current study, we used hypercapnia to alternating the pH in the brain cells (7-10) together with egg white phantom to determine which CEST contrast is suitable for detecting the pH response at the physiological pH range.Methods
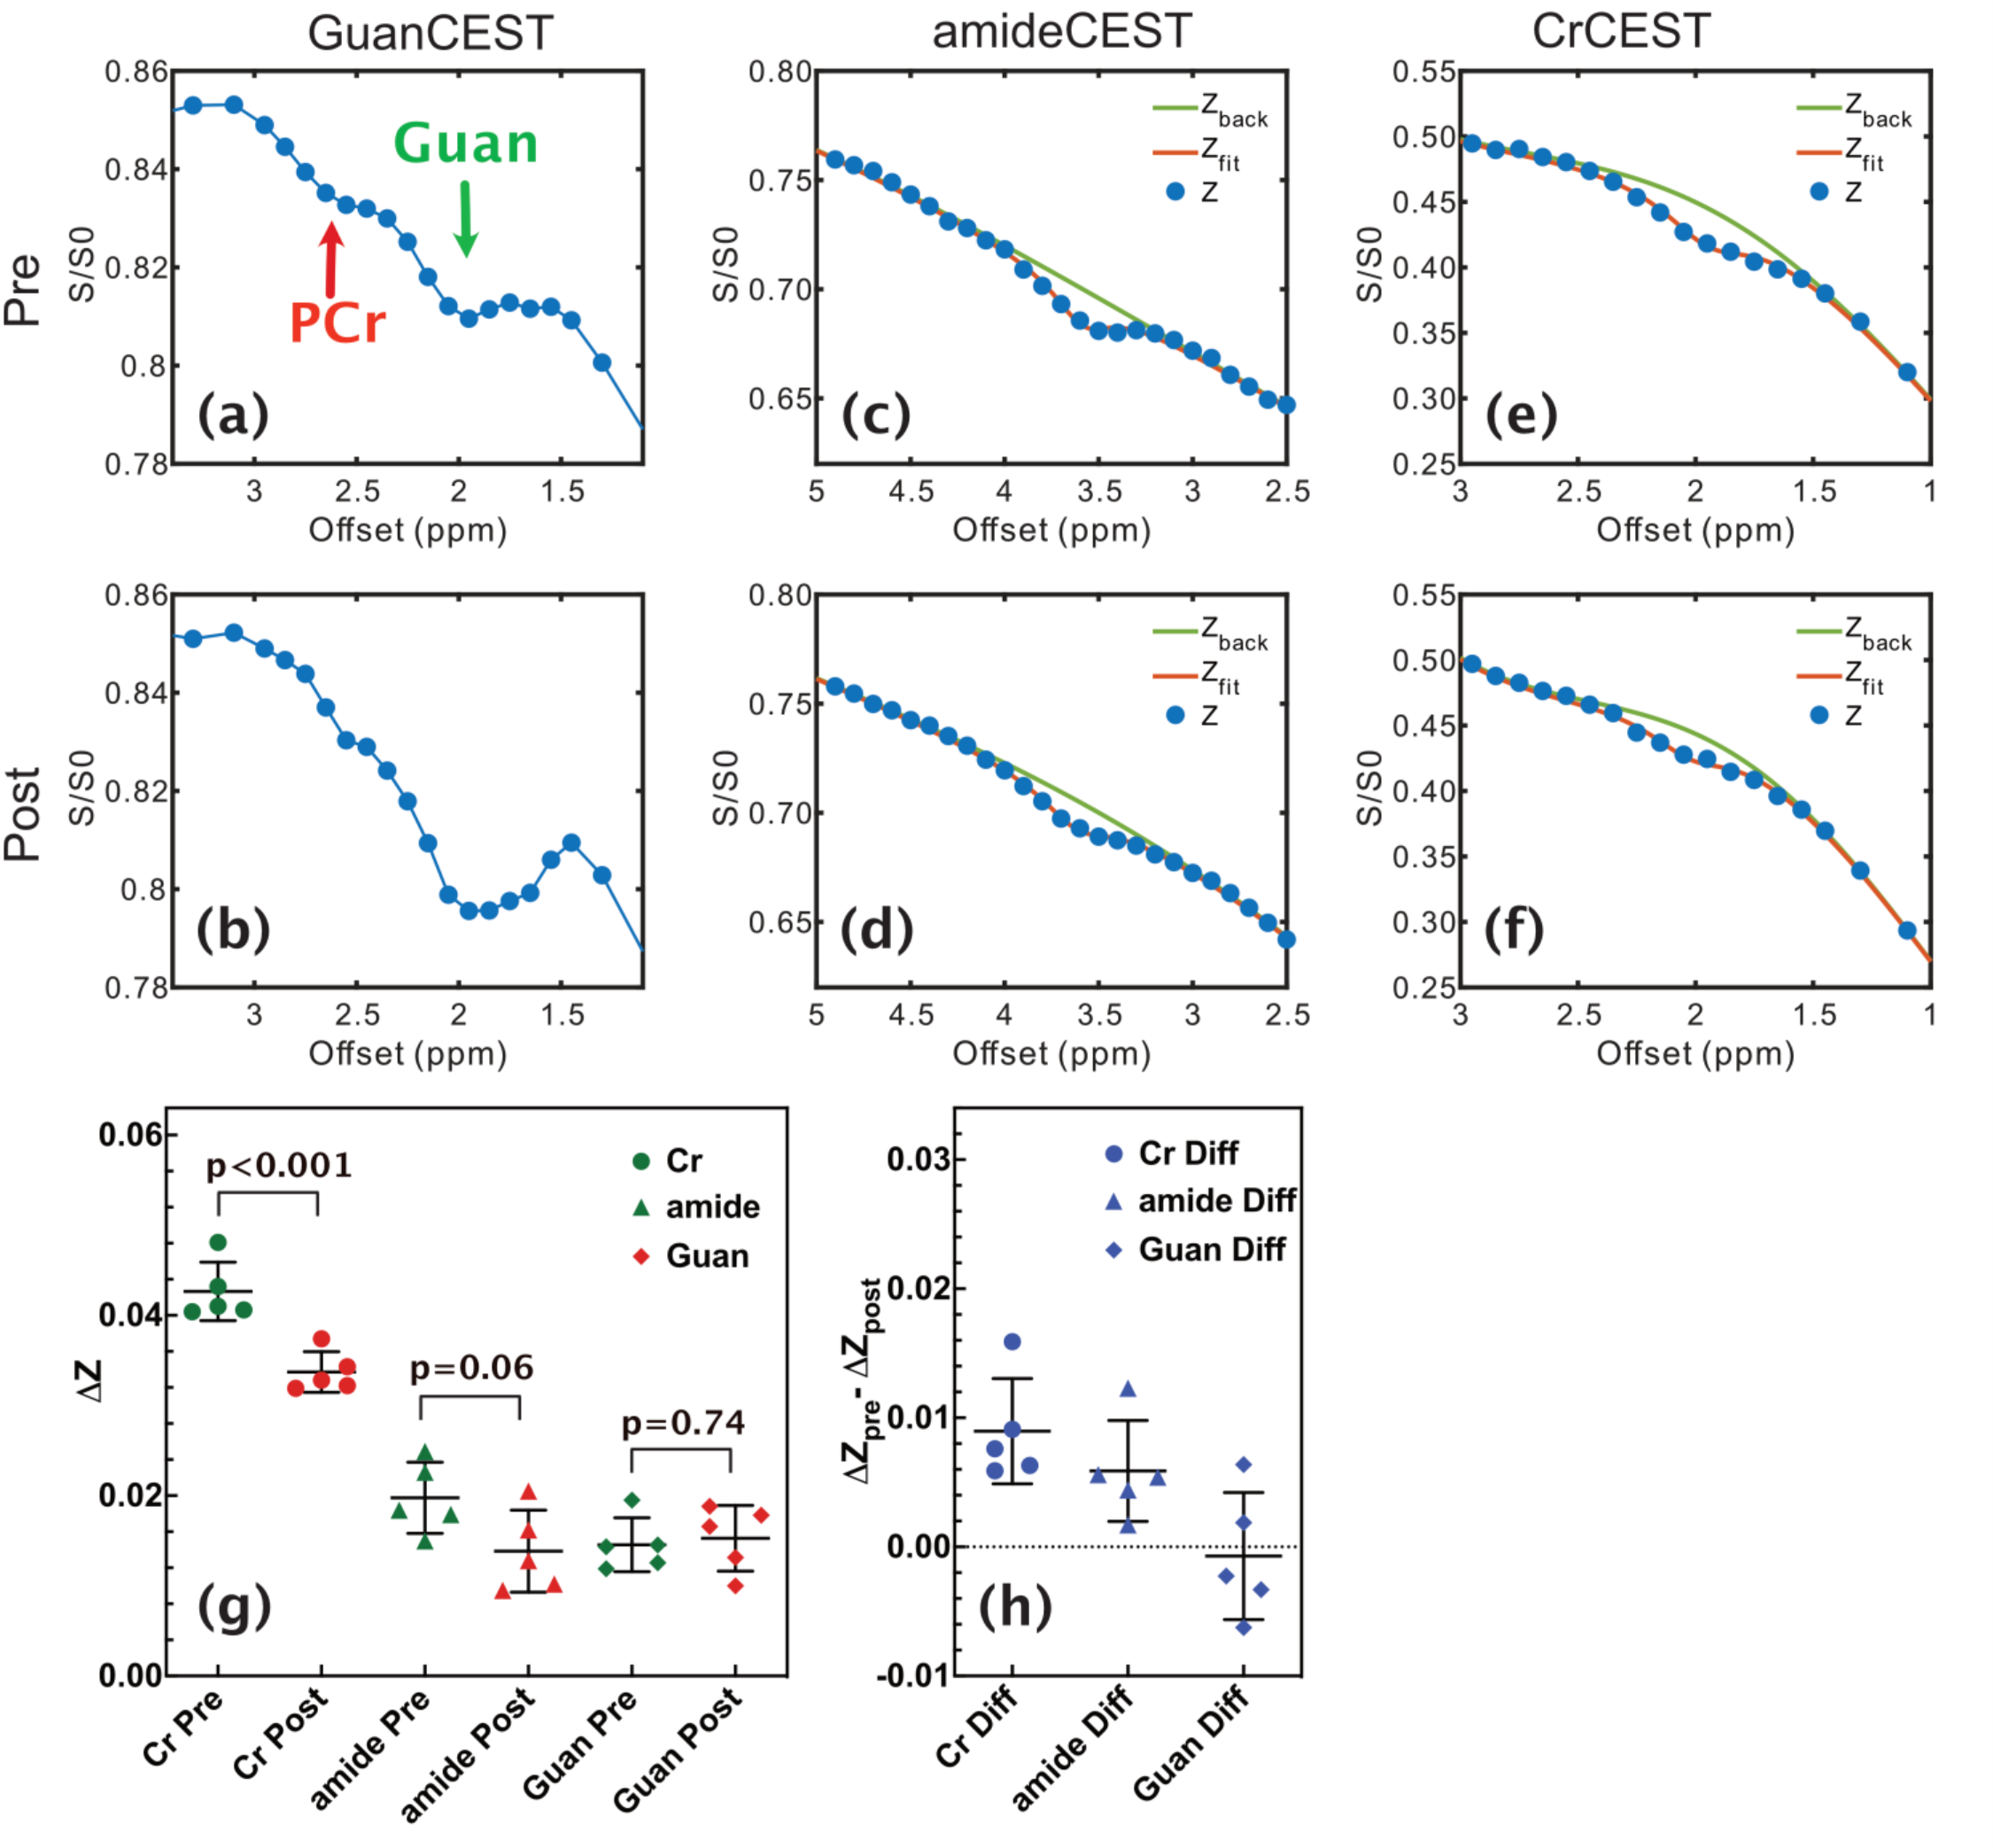
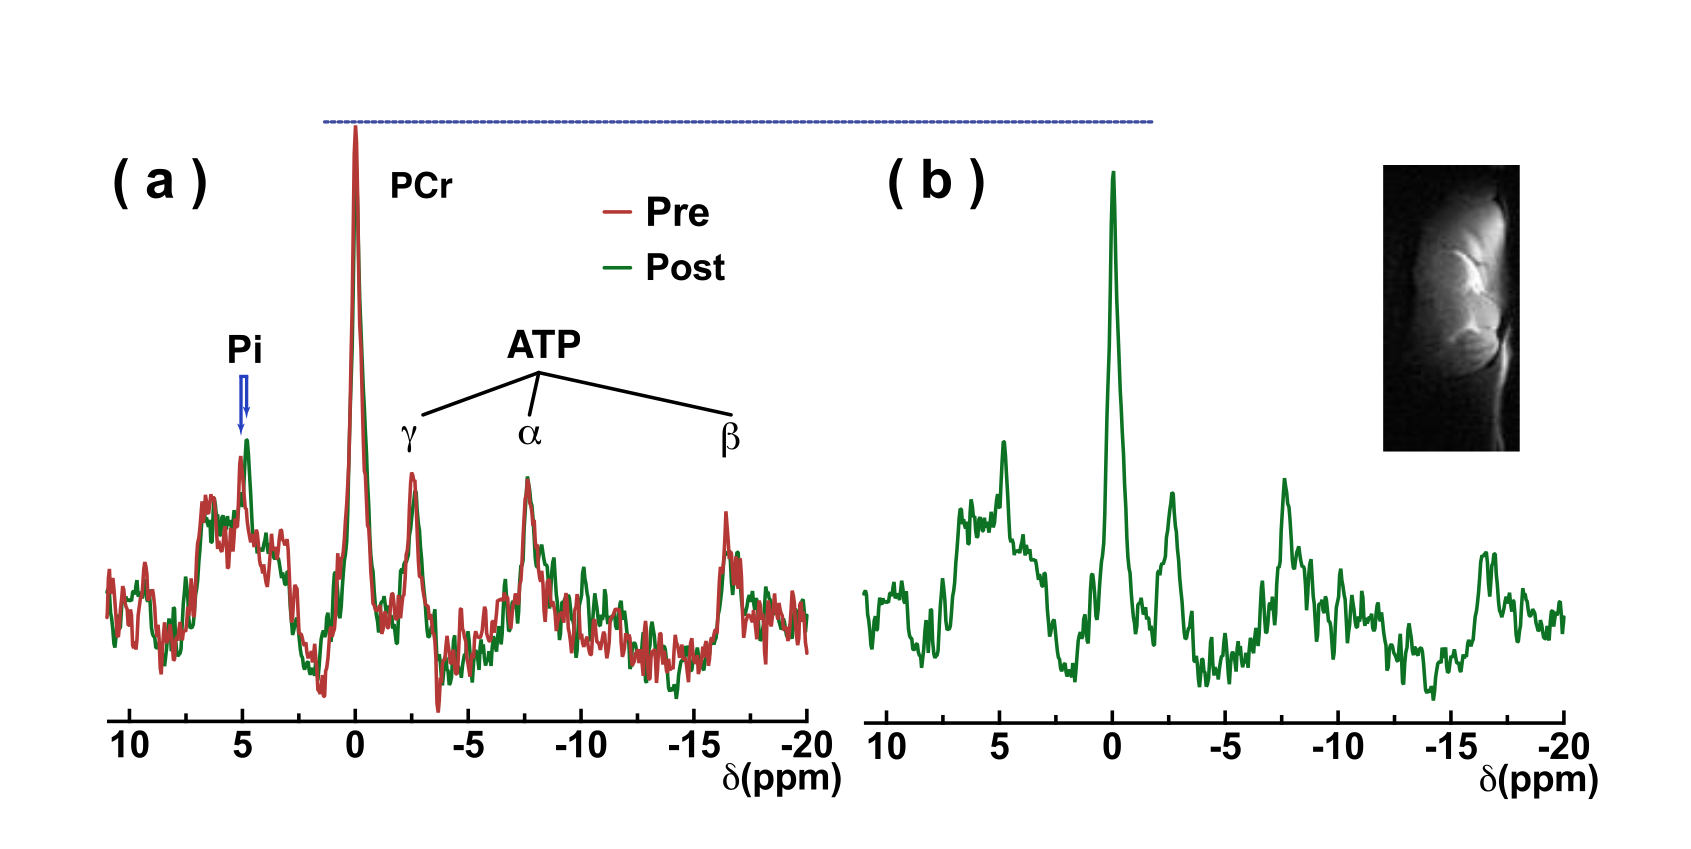
Egg white is an ideal model to demonstrate the sensitivity of the amide, guanidinium, and amine CEST from mobile proteins for detecting pH variation by titrating to pH 6, 6.5, 7, and 7.5. Hypercapnia was used to evaluate the sensitivity of CEST contrast in detecting pH change in brain. Z-spectra on five wild type mouse brains pre- and post-20% CO2 inhalation were recorded. The 20% CO2 delivery was accomplished by mixing the air and CO2 with flow rates of 2 and 0.5 L/min, respectively. CEST experiments were performed using continuous-wave CEST (cwCEST). MR images were acquired using a Turbo Spin Echo (TSE) sequence with TE = 18 ms, TR=5 s, TSE factor = 20, slice thickness =1.5 mm and a matrix size of 64×64. All MRI experiments were performed on a horizontal bore 11.7 T Bruker Biospec system. The saturation field strength (B1) and length were 2 μT and 1 s for creatine CEST (CrCEST), 0.5 μT and 3 s for guanidinium CEST (guanCEST), and 1 μT and 2 s for amideCEST according to previous optimization results (11-13). The extraction of the CEST signal was achieved using polynomial and Lorentzian line-shape fitting (PLOF) as detailed previously (11,12,14-16).31P MRS was performed to measure the cerebral pH and phosphocreatine changes after CO2 inhalation. The intracellular pH was calculated from the chemical shift of the Pi peak relative to the PCr peak. The in vivo 31P MRS experiments were performed using a single pulse sequence (TR = 2 s, NA = 512, bandwidth = 50 ppm, acquisition time = 100 ms). The total experimental time was 16 minutes.
Results and Discussion
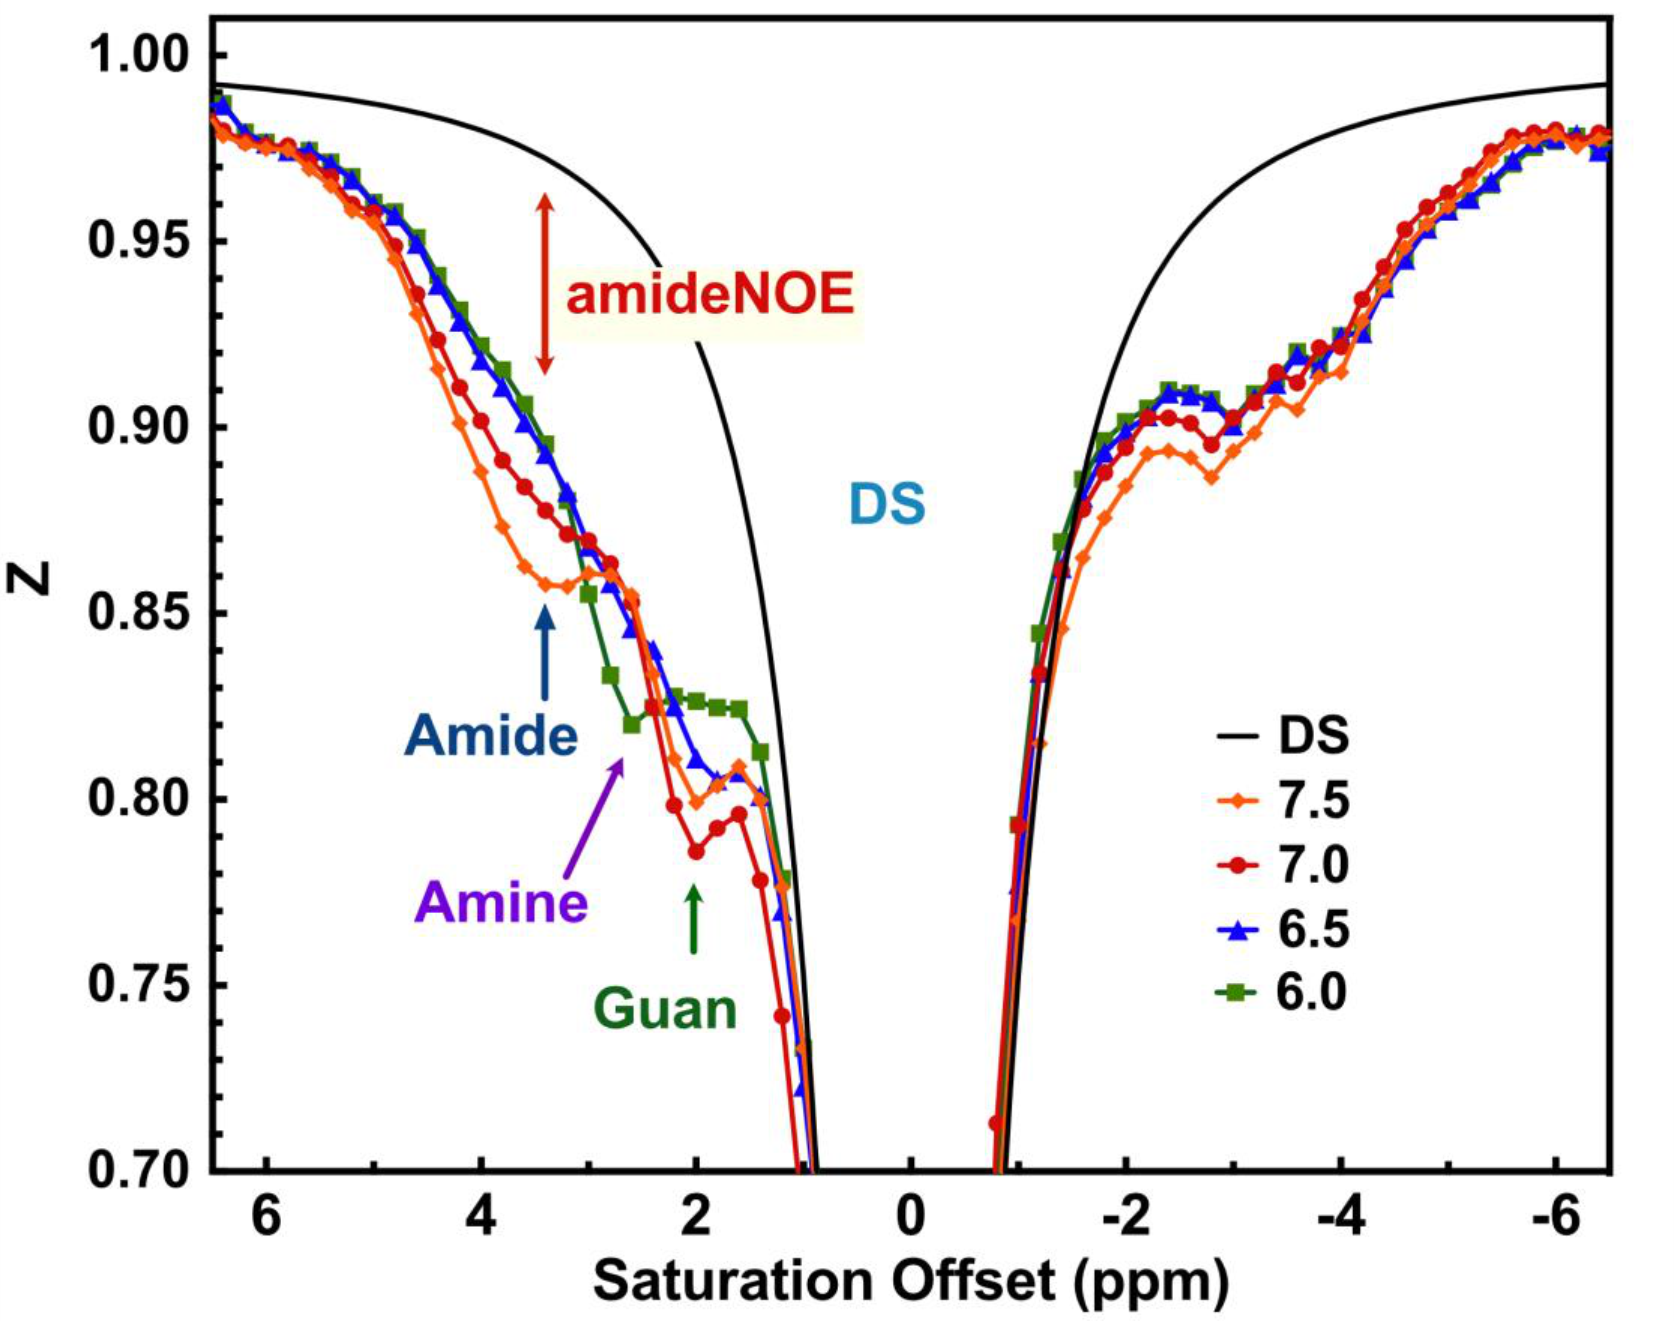
The Z-spectra of egg white phantoms with different pH values are plotted in Fig. 2. The amide peak at 3.5 ppm disappears at pH 6.5 (17). The guanidinium peak increases when pH drops from 7.5 to 6.5. However, the peak will begin to decrease when pH further drops to 6. The amine peak is not visible when pH is higher than 6.5 and will form a single peak centered at 2.7 ppm when the pH is less than 6.5. Interestingly, there still a strong broad signal between 0 to 5 ppm that is not sensitive to pH and is still visible even at pH 6, which is assigned as amideNOE. The amideNOE may be attributable to non-exchanging amide protons or amide proton with extremely slow exchange rates, but they will still be able to transfer magnetization to water following a two-step relayed NOE process with faster exchanging neighboring protons (18). To validate the feasibility of different CEST contrasts (amideCEST, CrCEST and GuanCEST) in detecting subtle cerebral pH changes, Z-spectra were recorded of mouse brain before and after 20% CO2 inhalation (Fig. 2). The results reveal that CrCEST (4.26±0.32%) yields a much stronger signal compared to both amideCEST (1.97±0.39%,) and guanCEST (1.46±0.30%). Both CrCEST and amideCEST exhibited reduced CEST contrast after CO2 inhalation, while guanCEST increases slightly. A significant difference was observed in the change in CrCEST signal intensity (0.90±0.4%, p < 0.001), while a much smaller difference was observed in the amideCEST results (0.59±0.39%, p = 0.061) as well as the guanCEST (-0.07±0.05%, p = 0.74). This observation also confirmed the previous assignment that the CEST peak at 2 ppm is dominated by guanCEST with low saturation powers (<0.6 mT) and is mainly from CrCEST with high powers (11,12).A cerebral pH change from 7.26±0.07 to 6.99 ±0.07 was measured with 31P MRS. The PCr peak broadened and also the concentration decreased by approximately 9.6±5%, as determined from the integral (2.18 ±1.1 104 to 1.97 ±1.0 104), which is caused by the conversion of PCr to Cr as pH decreases (19,20).
The pH detection sensitivity of CEST MRI is proportional to the change in the exchange rate induced by pH variations. Compared to amide protons, Cr protons possess a much higher exchange rate more than 1000 Hz (21), and hence, a larger exchange rate change related to pH variations.
Conclusion
We demonstrated that CrCEST is a highly pH-sensitive method at high fieldAcknowledgements
This work was supported by NIH: R01HL149742, R03NS109664, R21NS118079, R21AG065794 and DOD W81XWH-18-1-0797References
1. Zhou J, Payen JF, Wilson DA, Traystman RJ, van Zijl PC. Using the amide proton signals of intracellular proteins and peptides to detect pH effects in MRI. Nat Med 2003;9(8):1085-1090.
2. Chen LQ, Pagel MD. Evaluating pH in the Extracellular Tumor Microenvironment Using CEST MRI and Other Imaging Methods. Adv Radiol 2015;2015(2015):pii: 206405.
3. Longo DL, Busato A, Lanzardo S, Antico F, Aime S. Imaging the pH evolution of an acute kidney injury model by means of iopamidol, a MRI-CEST pH-responsive contrast agent. Magn Reson Med 2013;70(3):859-864.
4. Jin T, Wang P, Zong X, Kim S-G. Magnetic resonance imaging of the Amine–Proton EXchange (APEX) dependent contrast. NeuroImage 2012;59(2):1218-1227.
5. Jin T, Wang P, Hitchens TK, Kim SG. Enhancing sensitivity of pH-weighted MRI with combination of amide and guanidyl CEST. NeuroImage 2017;157:341-350.
6. Haris M, Nanga RP, Singh A, Cai K, Kogan F, Hariharan H, Reddy R. Exchange rates of creatine kinase metabolites: feasibility of imaging creatine by chemical exchange saturation transfer MRI. NMR Biomed 2012;25(11):1305-1309.
7. Boron WF. Regulation of intracellular pH. Advances in Physiology Education 2004;28(4):160-179.
8. Chesler M. Regulation and modulation of pH in the brain. Physiol Rev 2003;83(4):1183-1221.
9. Boron WF, De Weer P. Intracellular pH transients in squid giant axons caused by CO2, NH3, and metabolic inhibitors. J Gen Physiol 1976;67(1):91-112.
10. Thomas RC. Intracellular pH of snail neurones measured with a new pH-sensitive glass mirco-electrode. J Physiol 1974;238(1):159-180.
11. Chen L, Wei Z, Cai S, Li Y, Liu G, Lu H, Weiss RG, van Zijl PCM, Xu J. High-resolution creatine mapping of mouse brain at 11.7 T using non-steady-state chemical exchange saturation transfer. NMR Biomed 2019;32(11):e4168.
12. Chen L, Zeng H, Xu X, Yadav NN, Cai S, Puts NA, Barker PB, Li T, Weiss RG, van Zijl PCM, Xu J. Investigation of the contribution of total creatine to the CEST Z-spectrum of brain using a knockout mouse model. NMR Biomed 2017;30(12):e3834.
13. Jin T, Wang P, Zong X, Kim S-G. MR imaging of the amide-proton transfer effect and the pH-insensitive nuclear overhauser effect at 9.4 T. Magn Reson Med 2013;69(3):760-770.
14. Chen L, Barker PB, Weiss RG, van Zijl PCM, Xu J. Creatine and phosphocreatine mapping of mouse skeletal muscle by a polynomial and Lorentzian line-shape fitting CEST method. Magn Reson Med 2019;81(1):69-78.
15. Chen L, Schar M, Chan KWY, Huang J, Wei Z, Lu H, Qin Q, Weiss RG, van Zijl PCM, Xu J. In vivo imaging of phosphocreatine with artificial neural networks. Nat Commun 2020;11(1):1072.
16. Chen L, Cao S, Koehler RC, van Zijl PCM, Xu J. High-sensitivity CEST mapping using a spatiotemporal correlation-enhanced method. Magn Reson Med 2020:10.1002/mrm.28380.
17. Zhou IY, Lu D, Ji Y, Wu L, Wang E, Cheung JS, Zhang XA, Sun PZ. Determination of multipool contributions to endogenous amide proton transfer effects in global ischemia with high spectral resolution in vivo chemical exchange saturation transfer MRI. Magn Reson Med 2018.
18. Xu J, Yadav NN, Bar-Shir A, Jones CK, Chan KW, Zhang J, Walczak P, McMahon MT, van Zijl PC. Variable delay multi-pulse train for fast chemical exchange saturation transfer and relayed-nuclear overhauser enhancement MRI. Magn Reson Med 2014;71(5):1798-1812.
19. Nishimura M, Johnson DC, Hitzig BM, Okunieff P, Kazemi H. Effects of hypercapnia on brain pHi and phosphate metabolite regulation by 31P-NMR. J Appl Physiol (1985) 1989;66(5):2181-2188.
20. Litt L, Gonzalez-Mendez R, Severinghaus JW, Hamilton WK, Shuleshko J, Murphy-Boesch J, James TL. Cerebral intracellular changes during supercarbia: an in vivo 31P nuclear magnetic resonance study in rats. J Cereb Blood Flow Metab 1985;5(4):537-544.
21. Goerke S, Zaiss M, Bachert P. Characterization of creatine guanidinium proton exchange by water-exchange (WEX) spectroscopy for absolute-pH CEST imaging in vitro. NMR Biomed 2014;27(5):507-518.
Figures