1194
Multiparametric MRI of Renal Tissue Shows Dietary Differences Between Survivors and Non-survivors in Sepsis-associated Acute Kidney Injury1Medical Physics Group,Institute of Diagnostic and Interventional Radiology, University Hospital Jena, Jena, Germany, 2Center for Sepsis Control and Care, University Hospital Jena, Jena, Germany, 3Institute of Medical Microbiology, University Hospital Jena, Jena, Germany, 4Clinic for Radiology, University Hospital Muenster, Muenster, Germany
Synopsis
Acute kidney injury (AKI) is a highly lethal complication of sepsis that is frequently asymptomatic with versatile physiological alterations. As diet has gain recognition in the regulation of immune response, we aim to investigate the dietary impact on the course and outcome of sepsis by multiparametric MRI using perfusion, as well as T1 and T2 relaxation time. Cortical T1 and T2 relaxation time was found to differ significantly in animals having received protein-rich diet compared to healthy controls. By combining the cortical T2 relaxation time with perfusion, additional information could be gained, which allowed to distinguish between non-survivors and survivors.
Introduction
Acute kidney injury (AKI) is a common complication of sepsis with a high mortality rate [1]. Primary symptoms, which occur with variable severity and order, include impaired perfusion, a shift towards anaerobic metabolism and the secretion of pro-inflammatory mediators. However, the underlying pathophysiology and aetiology of AKI is rather multifaceted and may vary substantially based on individual circumstances. Within this frame it could be revealed that western diet regulates the immune status in response to sepsis [2]. Furthermore, in patients receiving continuous renal replacement therapy after surviving AKI, a reduction of zinc, iron, selenium, vitamin-D3 was found in the plasma [3]; suggesting malnutrition as a long term feature in sepsis. Whether and how nutrition affects the course and outcome of sepsis associated AKI (S-AKI) is currently unclear. As S-AKI may develop in the absence of tissue hypoperfusion and/or hemodynamic instability [1], measuring perfusion alone is not sufficient in characterizing the disease severity. In addition, endothelial injury resulting in peritubular interstitial edema can exert significant impact on perfusion. Thus, in this preclinical study, we combined T1-, T2- and perfusion-mapping to evaluate the impaired vascular and interstitial micro- and microcirculation in sepsis under the influence of different diets.Methods
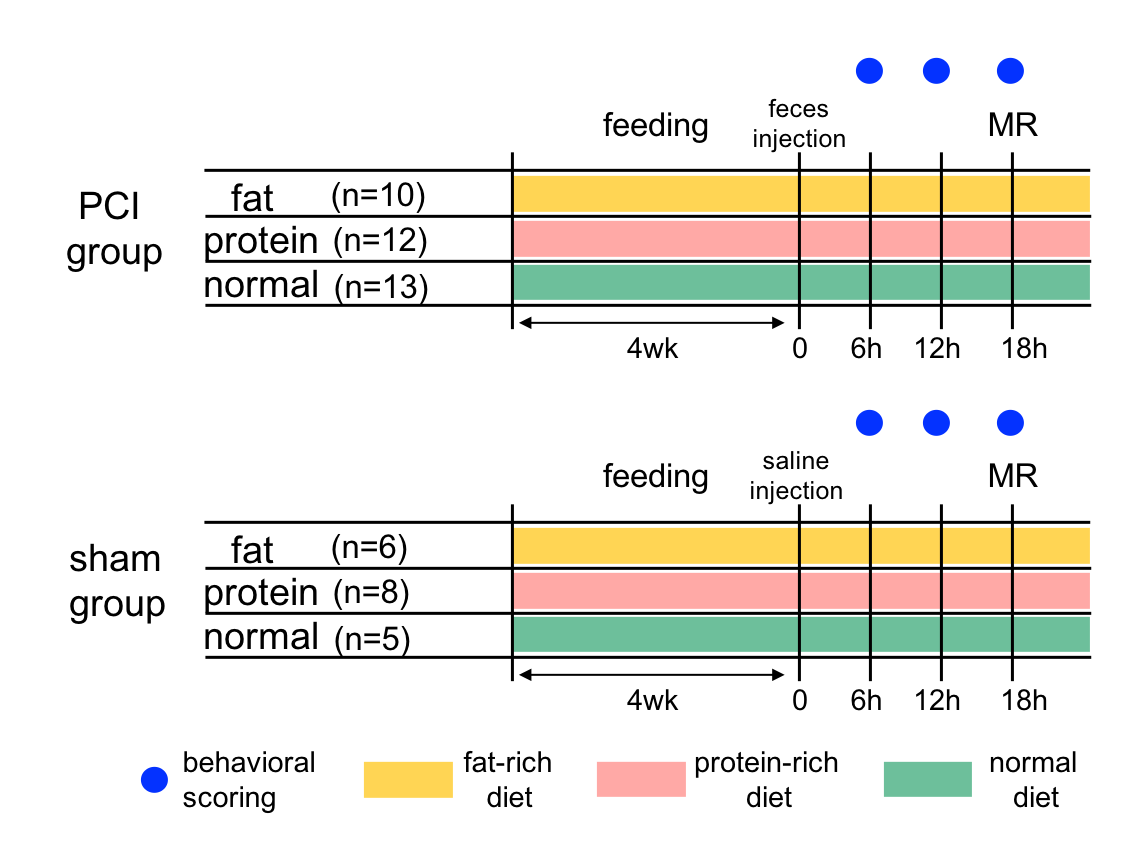
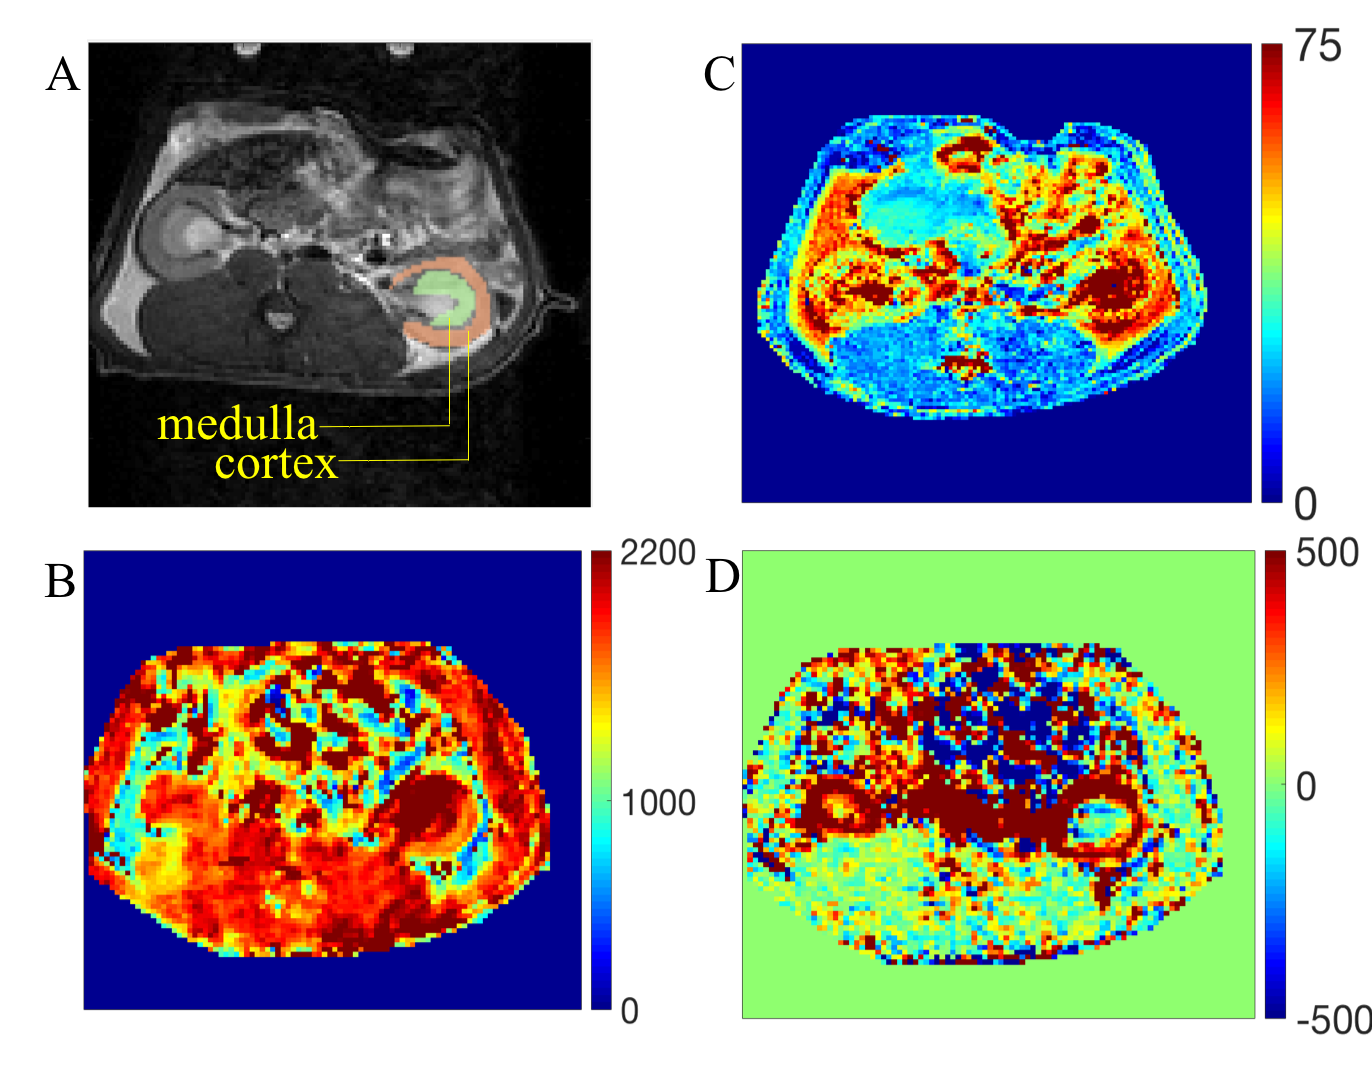
54 SD rats were subjected to this study. First, animals were classified in three groups receiving different diets: fat-rich, protein-rich and normal diet. After four weeks of feeding, animals received either 0.9% of NaCl (1.8µl/g BW, i.p., fat: n=6, protein n=8, normal n=5) in sham group or human feces as peritoneal contamination and infection group (PCI, fat n=10, protein n=12, normal n=13), as previous described [4]. 18 hours post infection, renal MRI was performed on a 9.4T Bruker BioSpec System using a 72 mm quadrature volume coil with the following sequences and parameters: Perfusion and T1 Map (FAIR-EPI, TR/TE=115-4515/12.8ms, matrix size=96x96, FOV=60x60, TI=100-4500ms, 16 TI); T2 Map (MSME, TR/TE=500/14-154ms, 6 TE, matrix size=128x128, FOV=60x60). During the acute phase of sepsis, body weight and temperature were measured daily. The behavioral score was documented every 6 hours for 72 hrs [4]. The experimental design is illustrated in fig.1. Non-survivor and survivors were retrospectively categorized according to the outcome at 72hrs post infection. MRI data were processed using an in-house developed MATLAB (MathWorks, Natick, MA, USA) framework and corresponding MRI parameters were calculated from ROIs of cortex and medulla (fig.2). The entire data sets containing the behavioral score and the corresponding T1 and T2 relaxation time as well as perfusion values were transferred to python (ver 3.2) and the statistical package pingouin was used (ver 0.3.8[5]) for non-parametric Mann-Whitney-U-test and to investigate the correlation between MRI data and behavioral scores.Results
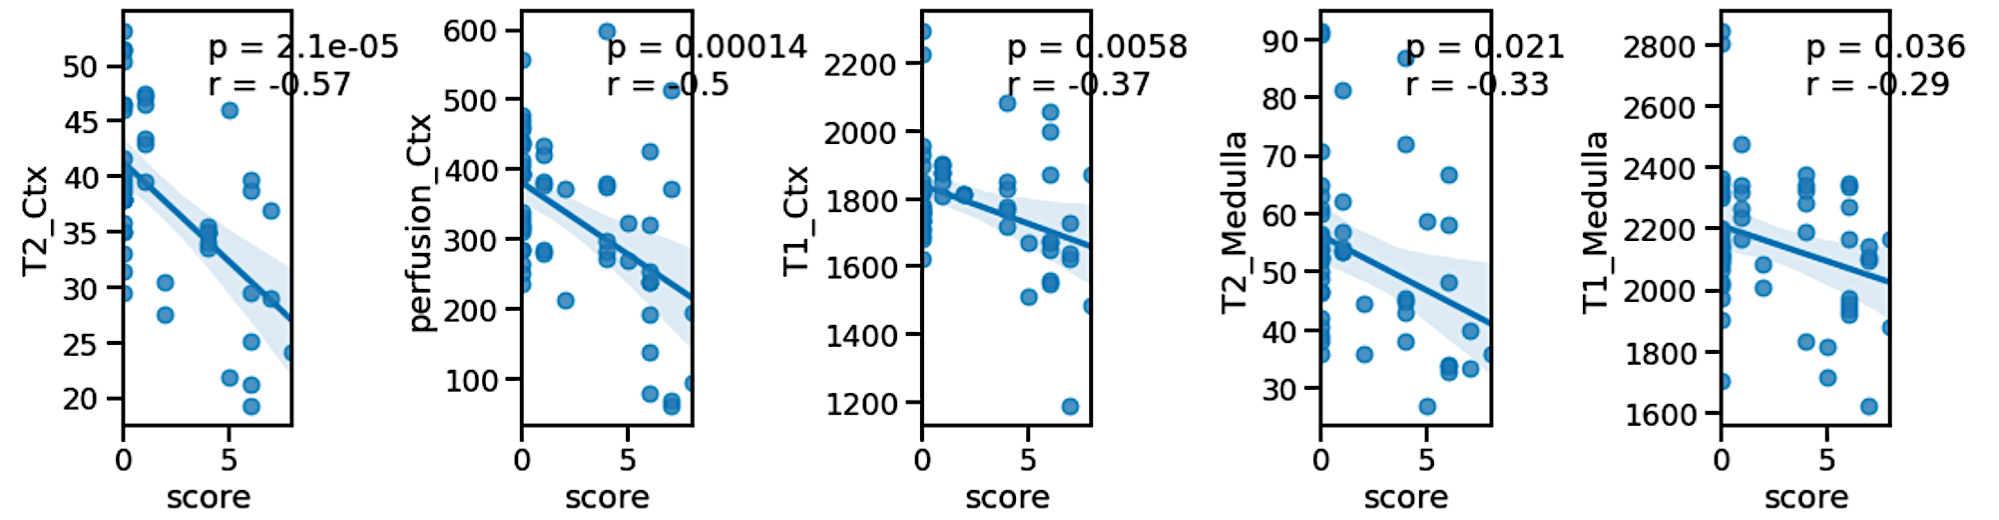
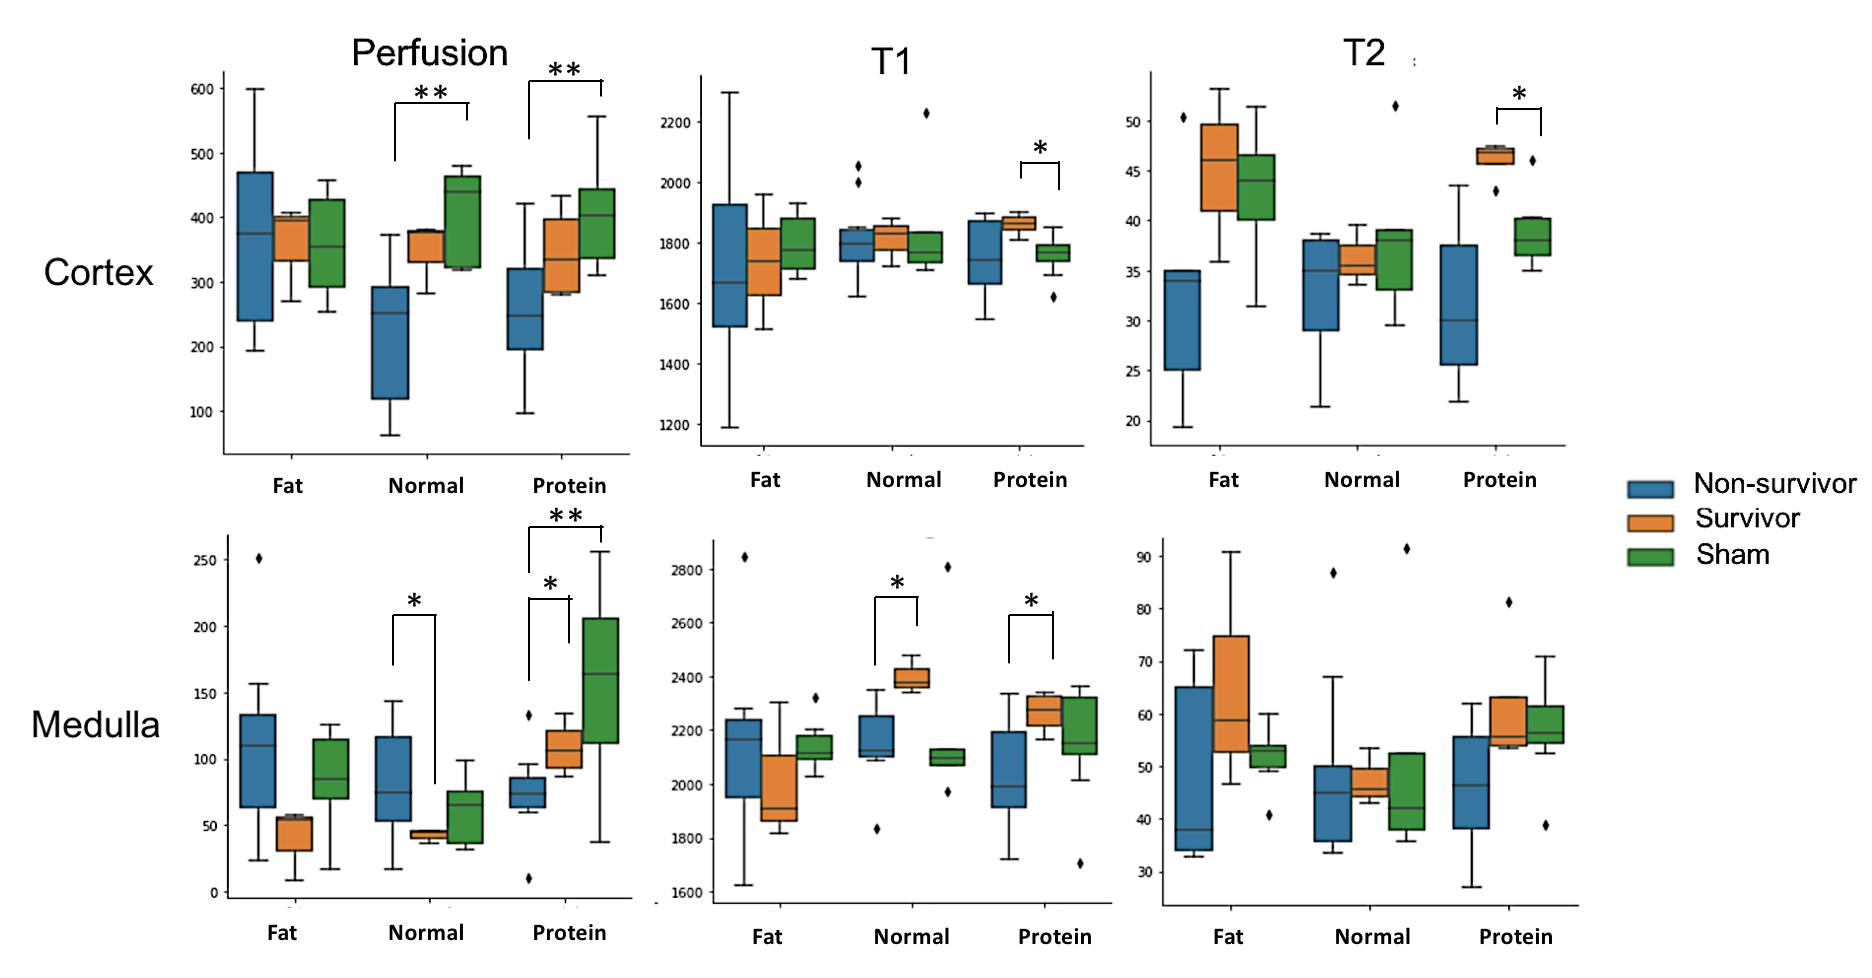
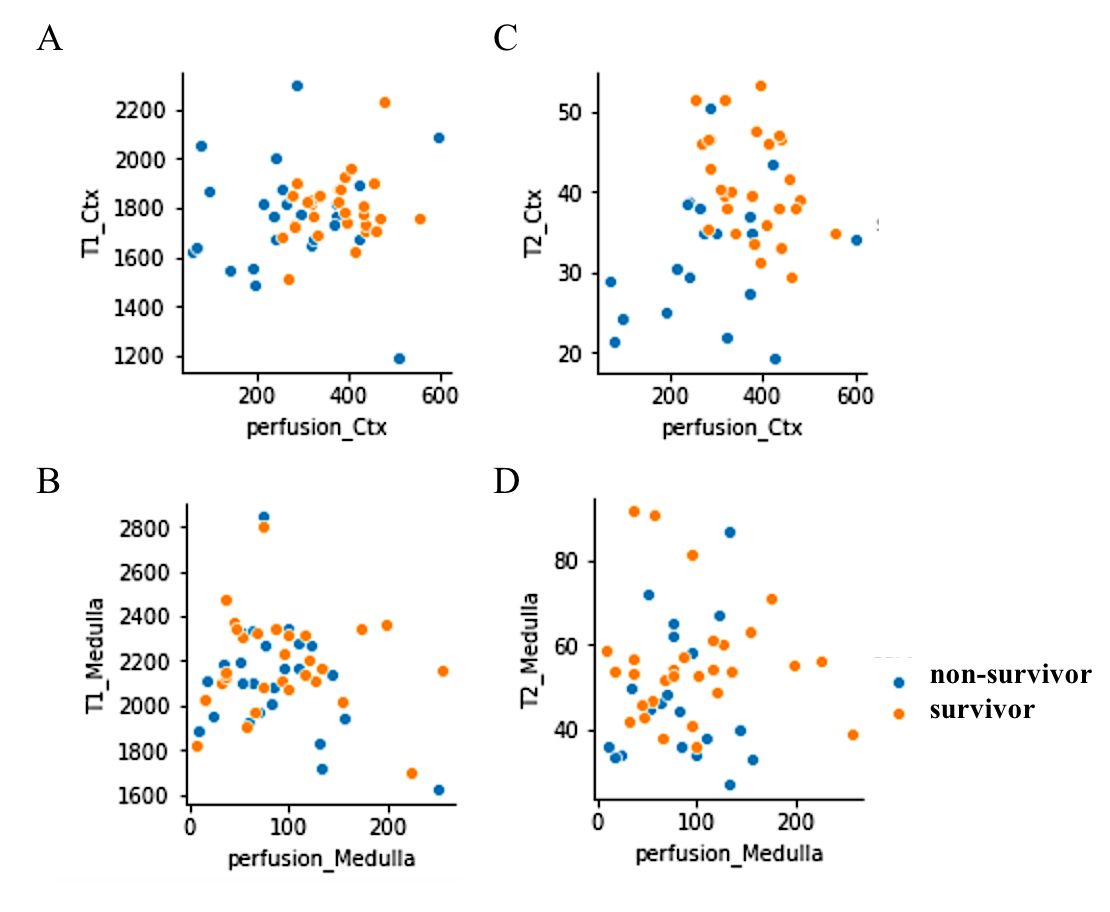
Septic animals which received fat-rich diet demonstrated the highest mortality rate (70%), followed by the group with normal diet (67%) and protein-rich diet (57%). Taking into account all experimental groups (sepsis-survivors, non-survivors, healthy sham group), the MRI parameters of T1, T2 relaxation time in cortex and medullar correlated significantly with the corresponding behavioral scores independently from the applied diet (fig.3). Similar trend was observed for the perfusion in cortex but not in the medulla. Non-survivors clearly showed significantly reduced cortical perfusion compared to the healthy sham group, while the parameter was less reduced in survivors (fig.4). Decreased perfusion was mainly observed in animals having received protein-rich and normal diet and could be preserved in the animal group with fat-rich diet. In the cortex, only survivors with protein-rich diet revealed significantly increased T1 and T2 values compared to healthy controls. In the medulla, distinct differences in T1 relaxation time could be found between survivors and non-survivors in the groups of protein-rich and normal diet. In a correlation analysis it could be demonstrated that neither T2 nor T1 relaxation time correlated significantly with the corresponding tissue perfusion in both the cortex and the medulla. However, the scatter plot showed that these parameters could contribute to distinguish between survivors and non-survivors (fig.5).Discussion and Conclusion
Overall, in all three groups of diets, non-survivors showed high variations in the results of T1, T2, and perfusion. These variations are mostly attributed to versatile immunological responses, inflammation, the autonomic nervous system and the endocrine system which jointly orchestrate within each individual [1]. Interestingly, a universal reduction of cortical T2 relaxation time could be found in non-survivors (fig.4) of all three dietary group independently from an impaired tissue perfusion (fig.5). This finding indicates reduced water content in the renal tissue parenchyma of non-survivors which might be associated with reduced urine output and high mortality. In contrast, the increased T2 relaxation time in survivors of both the fat-rich diet and the protein-rich diet group is a sign of tissue edema due to inflammation and is in accordance to previous reports [7]. The increased medullary T1 relaxation time which was observed in survivors indicates that also macromolecules and structural remodeling processes including cell swelling and fibrosis might be involved in the renal impairment [6]. Notably, in a scatter plot showing the correspondence between cortical perfusion and T2 relaxation time (fig.5-B), non-survivors and survivors could be clearly separated from each other, and thus may offer additional information about responses to therapeutic treatments such as fluid resuscitation support and/or angiotensin administration.Acknowledgements
No acknowledgement found.References
[1]. Peerapornratana, S. et al.,” Acute kidney injury from sepsis: current concepts, epidemiology, pathophysiology, prevention and treatment ”, Kidney International (2019) 96, 1083–1099
[2]. Napier, B.A. et al., “Western diet regulates immune status and the response to LPS-driven sepsis independent of diet-associated microbiome” , PNAS(2019)116, 3688-3694
[3]. Ostermann, M. et al., “Micronutrients in critically ill patients with severe acute kidney injury – a prospective study”, Scientific Report (2020) 10:1:505
[4] Gonnert et al. “Characteristics of clinical sepsis reflected in a reliable and reproducible rodent sepsis model”(2011), J. Surg. Res. 170: e123.
[5]. Vallat, “Pingouin: statistics in Python.” Journal of Open Source Software, (2018) 3(31), 1026
[6]. Hueper, K. et. al., “T1-mapping for assessment of ischemia-induced acute kidney injury and prediction of chronic kidney disease in mice”; Eur Radiol. 2014 sep;24(9):2252-60
[7]. Hueper, K. et al., ” T2 relaxation time and apparent diffusion coefficient for noninvasive assessment of renal pathology after acute kidney injury in mice: comparison with histopathology” ; Invest Radiol. 2013 Dec; 48(12):834-42
Figures