1193
Linear combination SSFP for multi-site chemical shift imaging: Applications to Deuterium Metabolic Imaging1Radiology and Biomed Eng., Yale University, New Haven, CT, United States, 2Weizmann Institute of Science, Rehovot, Israel
Synopsis
Deuterium metabolic imaging (DMI) is a new method to map abnormal metabolism of tumors. bSSFP might provide high SNR for DMI, due to the high T2/T1 ratios of the injected deuterated glucose, and the lactate, which arises from abnormal metabolism. We developed a linear-combination balanced SSFP method for spectrally resolving glucose, lactate and water, using predicted signal evolutions for different bSSFP phase-cyclings. Our method was able to generate images of the individual compounds in phantoms and in vivo.
Background
Deuterium metabolic imaging (DMI, 1-3) injects metabolites such as 2H6,6’-glucose and images at the deuterium (2H) resonance to monitor the transformation of glucose into 2H3,3’-lactate– a hallmark of abnormal tumor metabolism by the “Warburg Effect”– and into 2H-water (4). DMI relies on 2H’s short T1s to provide chemical shift imaging (CSI) with acceptable SNR, despite 2H’s low gyromagnetic ratio and the metabolites’ low concentrations. An option for increasing MRI’s SNR/time is using balanced steady-state free precession, bSSFP, which provides the optimal approach for the T2/T1 ratios characteristic of deuterated compounds (5). Moreover, linear combination bSSFP (LC-SSFP) has been explored as a water-fat separation method (6-7), providing clean multiplexing of two frequencies when using two phase-cyclings. We therefore explore here LC-SSFP’s potential as a spectroscopic imaging method for DMI, focusing on its ability to resolve three metabolites resonating at 1.3ppm (lactate), 3.7ppm (glucose), and 4.8ppm (water). Phase-cycling schemes that use the signal evolution of each metabolite as a “fingerprint” to resolve them are proposed, and demonstrated on phantoms. LC-SSFP’s superior SNR is then applied to DMI mouse model of orthotopic pancreatic cancer, to pinpoint the position of the abnormal metabolism.Methods
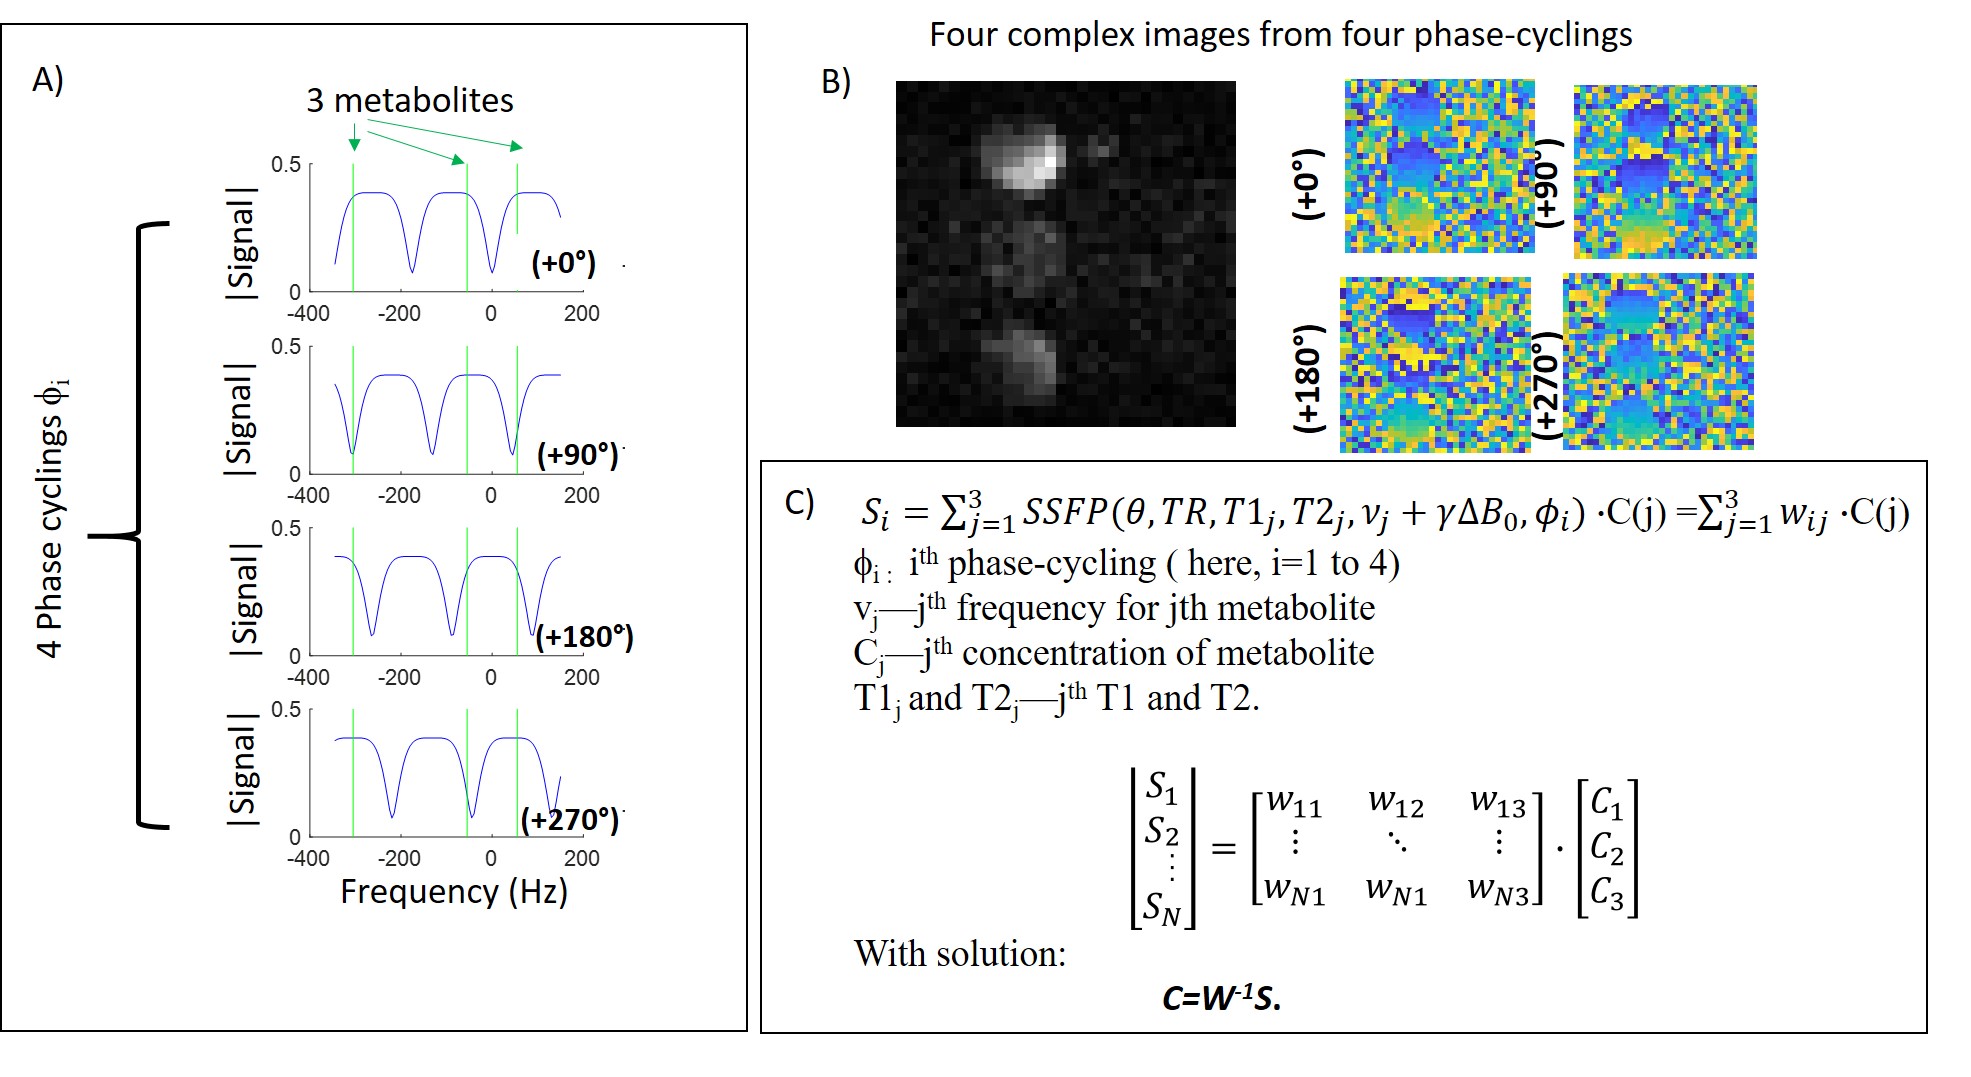
Figure 1A shows the magnetization vs. frequency behaviors predicted for bSSFP, upon utilizing four different phase-cyclings of the RF pulses; also indicated are the positions of the three targeted metabolites at the 15.2T field here employed. Figure 1B shows images (phase and magnitude) arising for each of these phase-cyclings, for a phantom consisting of 10mm tubes of deuterated lactate, glucose and water (all at 200mM). Figure 1C shows the method proposed to separate the metabolites: to isolate each of them, the image-space signal of a pixel for the ith phase-cycling is modeled using the theoretically calculated wij weights for each metabolite (indexed as j, each with a different frequency νj and concentration Cj). Based on the signal evolution or “fingerprint” of the metabolites under this series of phase-cyclings, the concentration is determined, using matrix inversion (pseudo-inverse, “pinv”). All processing was performed in Matlab. All studies were performed on a 15.2T Bruker scanner, unless noted. The scanner bSSFP sequence was modified to add custom phase-cyclings, denoted ‘0°’, ‘90°’, ‘180°’ and ‘270°’ –where 0° indicates that the RF excitation phase increases by 0° in each TR, etc. Scan parameters were: TR/θ =5.7ms/60°, 40mm FOV, 8mm slice thickness, 32x32 matrix. The carrier frequency was set @4.3ppm, between glucose and water. These parameters were chosen to obtain a glucose-only image (0°- i180°), and lactate and water only image (0°+ i180°). Phantoms containing deuterated compounds (lactate/acetone, glucose, and water) were imaged. KPC-based mouse models of pancreatic cancer were also imaged, in an IACUC approved study. LC-SSFP tests of spectral isolation were compared against CSI experiments (TR/θ=95ms/90°) performed at equal spatial resolution and scan times.Results
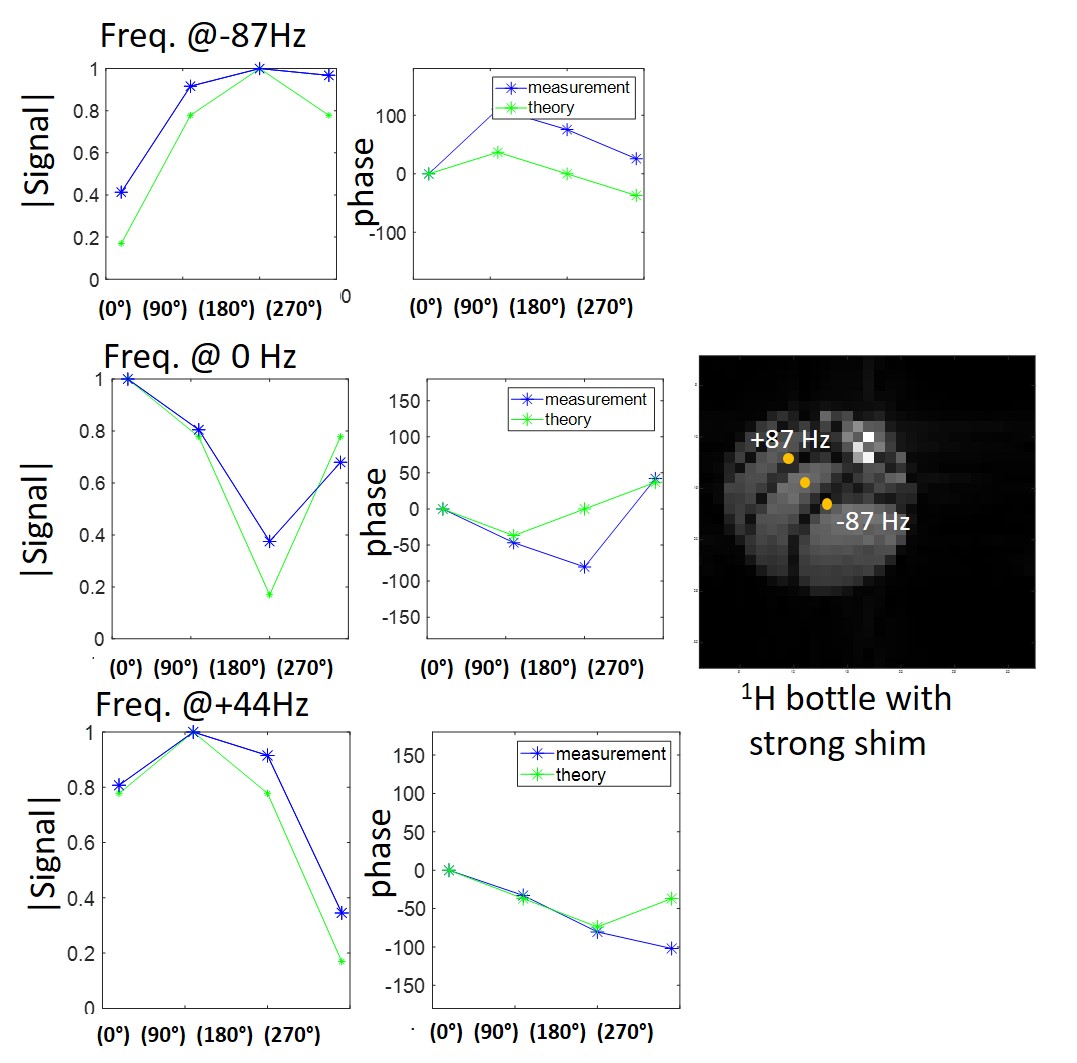
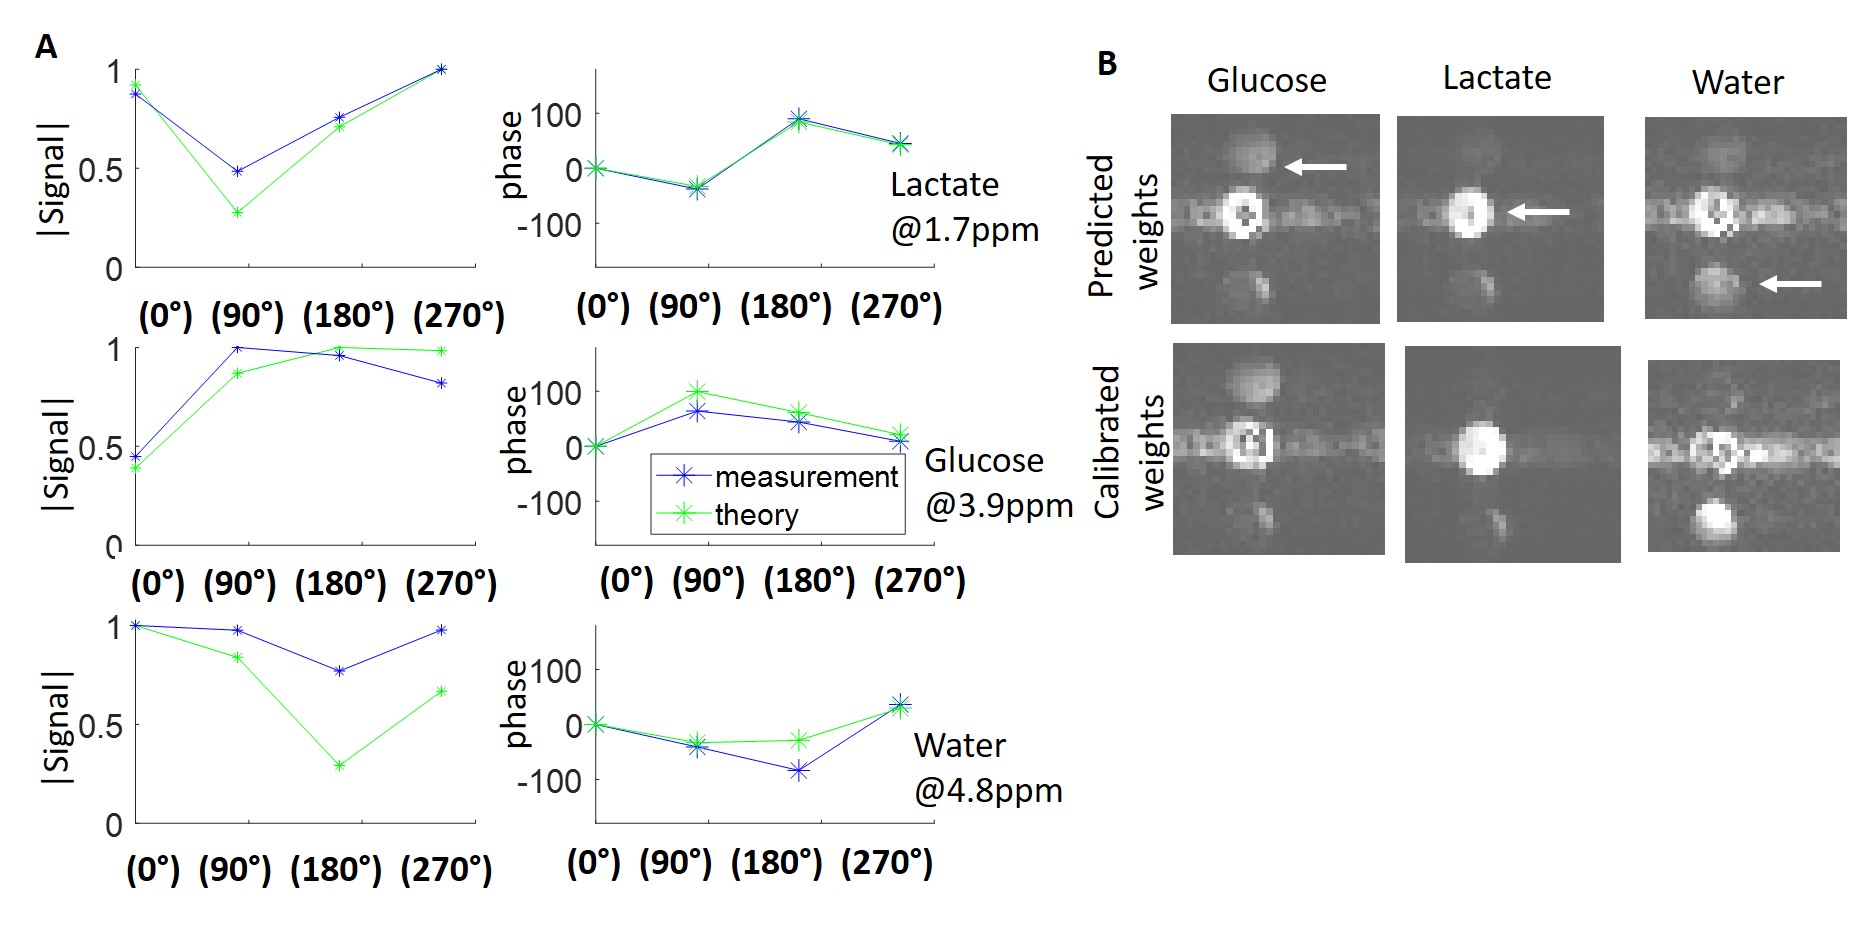
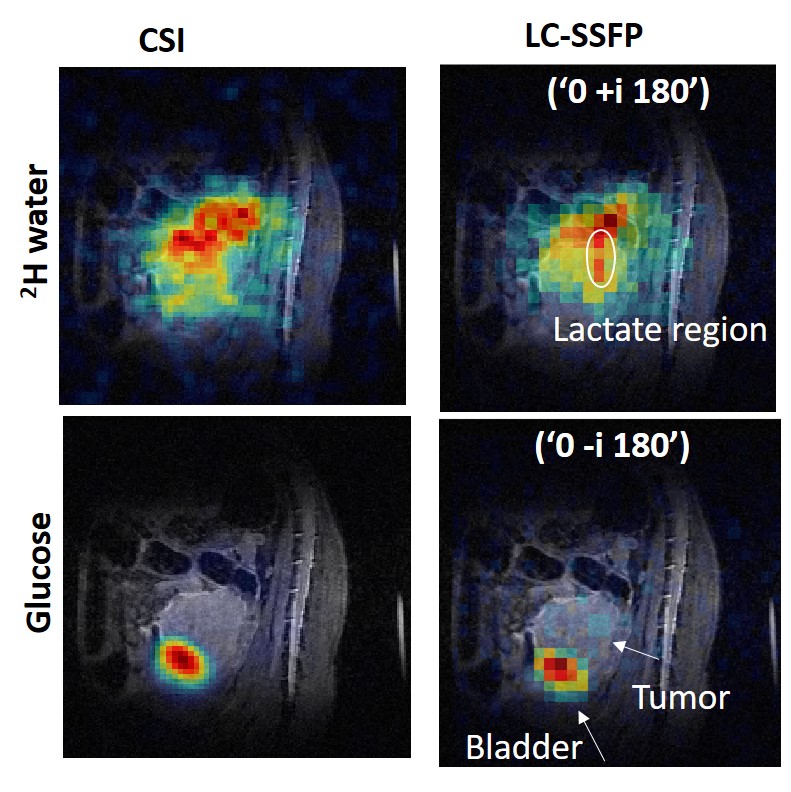
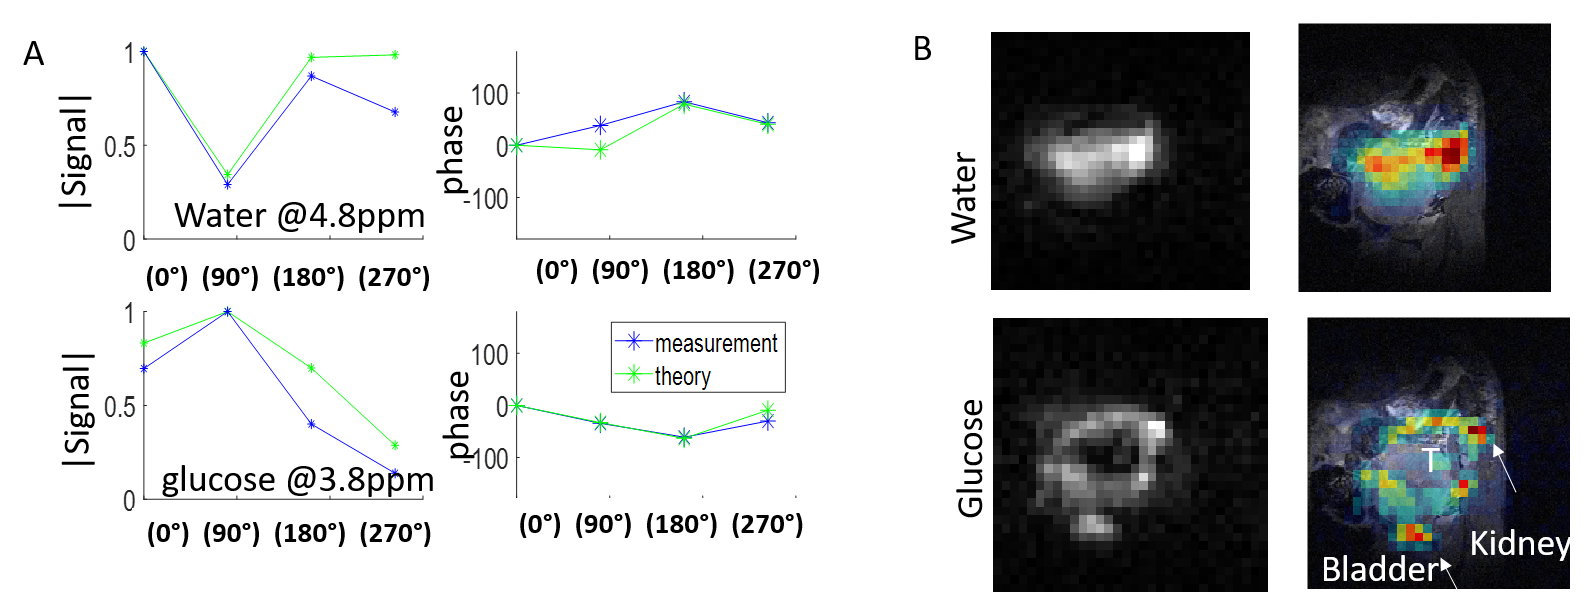
Phantom 1H studies of a bottle subject to a sizable inhomogeneity, are shown in Figure 2. Plots in blue show the measured signal at three defined frequencies, both in magnitude and phase, for each phase-cycling. The theoretical evolution in each phase-cycling that is predicted based on these frequencies, agrees well with the actual signal. A 2H phantom study is shown in Figure 3, comprising separate bottles of deuterated water, lactate and glucose. Actual and theoretical signal (magnitude/phase) are plotted for each phase-cycling, showing good agreement (Figure 3A). Figures 3B show the resultant isolated metabolites (i.e. C=W-1S) using both self-calibrated weights and theoretically-determined weights. The isolation is not perfect due to the phantom’s very intense lactate signal, but both methods work reasonably well –even if the self-calibrated method is superior. Figure 4 shows the use of LC-SSFP (0°- i180° image), to isolate deuterated water+lactate from glucose in vivo on a pancreatic cancer mouse model. compared to results from 2H CSI. Water and glucose were well separated, and the weights obtained by the two methods agree well. Figure 5 shows the use of LC-SSFP to isolate two metabolites (water/glucose) early after an injection of glucose into another mouse with a large tumor, at an early post-injection time-point when lactate still is not strongly present. The physiology of the separation is as expected: water exhibits a diffuse location, while glucose appears as a rim about the tumor, with greater deposition in the kidneys and bladder.Discussion
bSSFP has the potential to improve DMI’s SNR thanks to the large T2/T1 ratios of deuterated metabolites. This pilot study demonstrated that LC-SSFP, a method known for fat-water separation, can be used to spectrally resolve three deuterated metabolites, using either empirically self-calibrated or theoretically-derived weights, and matrix inversions. Using standard LC-SSFP glucose can be isolated, generating information similar to FDG-PET (Figure 4). We found that four phase-cyclings are enough to generate separation of three metabolites, using an unoptimized protocol. However, questions remain regarding the optimal TR and phase-cycling schemes. Furthermore, it is known that some forms of LC-SSFP result in lower SNR efficiency (6), since the acquired signal is not always maximal in each phase-cycling. The SNR of this method needs to be further characterized and optimized but, overall, spectroscopic LC-SSFP shows potential promise for improving DMI.Acknowledgements
This work was supported by the Kimmel and by the Clore Institutes for Magnetic Resonance (Weizmann Institute), by the Israel Science Foundation (grant 965/18), the Thompson Family Foundation, and the Israel Cancer Research Foundation. DCP acknowledges the Benoziyo Endowment Fund for the Advancement of Science, for a Visiting Faculty Fellowship to the Weizmann Institute, and Yale Radiology for a sabbatical.References
1. De Feyter HM, Behar KL, Corbin ZA, Fulbright RK, Brown PB, McIntyre S, Nixon TW, Rothman DL, de Graaf RA. Deuterium metabolic imaging (DMI) for MRI-based 3D mapping of metabolism in vivo. Sci Adv 2018;4(8):eaat7314.
2. de Graaf RA, Hendriks AD, Klomp DWJ, Kumaragamage C, Welting D, Arteaga de Castro CS, Brown PB, McIntyre S, Nixon TW, Prompers JJ, De Feyter HM. On the magnetic field dependence of deuterium metabolic imaging. NMR Biomed 2020;33(3):e4235.
3. Kreis F, Wright AJ, Hesse F, Fala M, Hu DE, Brindle KM. Measuring Tumor Glycolytic Flux in Vivo by Using Fast Deuterium MRI. Radiology 2020;294(2):289-296.
4. Warburg O, Wind F, Negelein E. The Metabolism of Tumors in the Body. J Gen Physiol 1927;8(6):519-530.
5. Bieri O, Scheffler K. Fundamentals of balanced steady state free precession MRI. J Magn Reson Imaging 2013;38(1):2-11.
6. Bangerter NK, Hargreaves BA, Vasanawala SS, Pauly JM, Gold GE, Nishimura DG. Analysis of multiple-acquisition SSFP. Magn Reson Med 2004;51(5):1038-1047.
7. Vasanawala SS, Pauly JM, Nishimura DG. Linear combination steady-state free precession MRI. Magn Reson Med 2000;43(1):82-90.
Figures