1191
Automatic determination of the regularization weighting for low rank reconstruction problems1Centre for Functional and Metabolic Mapping, Robarts Research Institute, Western University, London, ON, Canada, 2Department of Medical Biophysics, Schulich School of Medicine and Dentistry, Western University, London, ON, Canada
Synopsis
Low rank is an appealing method to reconstruct multiple images that share common properties between them. The highest variance, from a singular value decomposition perspective, comes from acquisition noise; therefore, noise can be tracked and discarded by selecting either the ideal rank or denoising threshold. However, the a priori determination of either of them is still an open question. In this work, we develop a general, non-iterative, fast, and automatic procedure to determine the regularization weighting for low rank reconstruction problems.
Purpose
Low rank reconstruction1 simultaneously reconstructs several images that share common information through the dataset. A low rank reconstruction,$$ \hat{X} = \textrm{argmin} _X \ \ \| AX - Y \|_2^2 + \lambda \| X \|_* \ \ \ \textrm{(1)}$$ can be described as the combination between a data consistency term and a regularization term. The data consistency (first term of Eq. (1)) makes that the set of reconstructions, $$$X$$$, resemble the acquired data, $$$Y$$$, after the net operator, $$$A$$$. The regularizer (second term of Eq. (1)) promotes low rank and sparsity from using the nuclear norm (only some singular values are significantly activated). One of the problems in using Eq. (1), is the determination of the regularization weighting, $$$\lambda$$$. An incorrect $$$\lambda$$$ can easily generate artifacts, smoothing, and loss in both structural information as in noise suppression. Although there are strategies to determine $$$\lambda$$$2,3, the state-of-the-art lacks an automatic, non-iterative, fast, and prospective approach to select the regularization weighting for low rank reconstruction procedures. In this work we introduce an approach with these traits. Our approach is built under the assumption that singular values can be classified as noise/artefact- and signal-based and the threshold is the boundary between these two groups. This is our interpretation from the application of the Marchenko-Pastur distribution to the singular values of a dataset corrupted with Gaussian noise4,5, and artefacts that present as noise, as is the case for pseudo-random under-sampling.
Methods
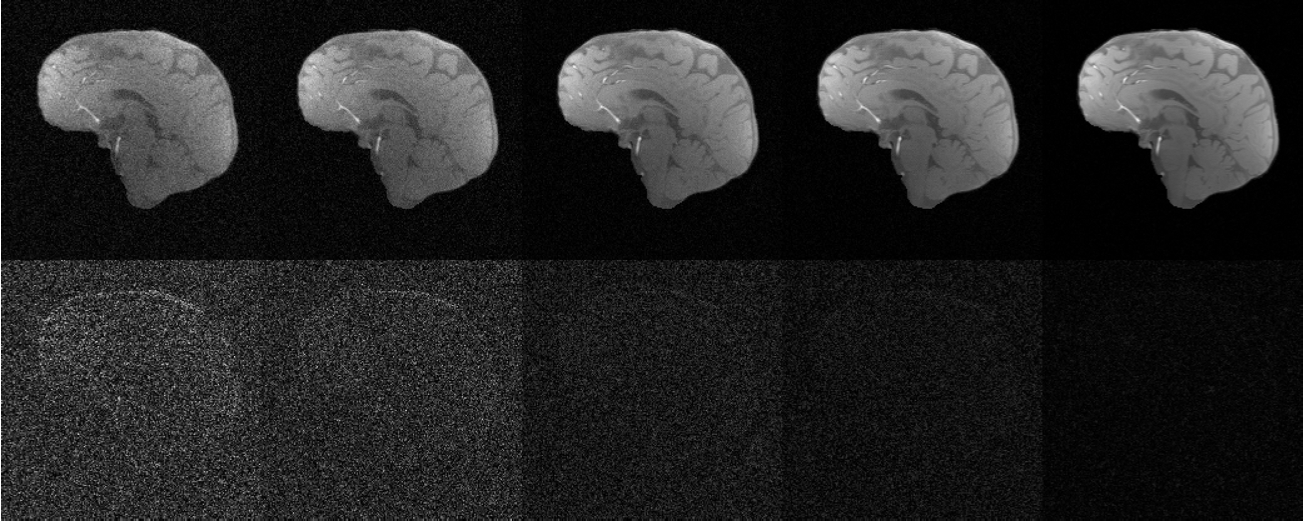
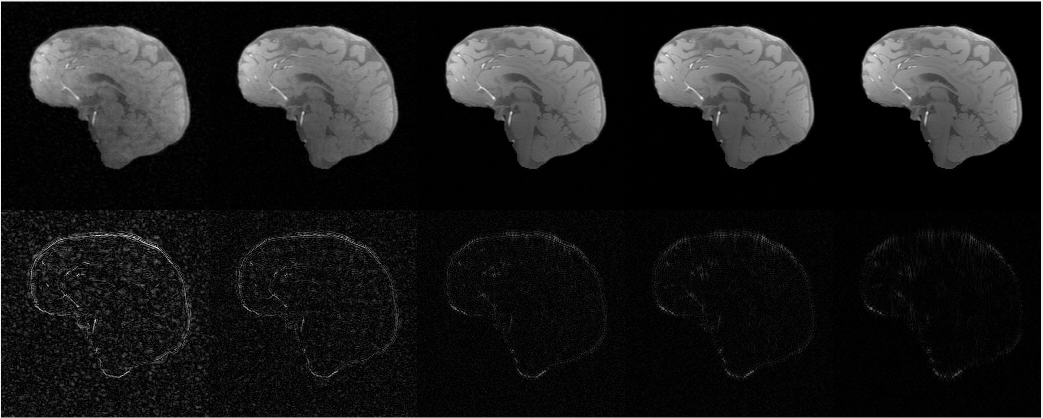
We implemented Eq. (1) as a proximal descent algorithm6–8, where the proximal operator of the nuclear norm corresponds to the singular value thresholding9 operation. To determine the regularization weighting, $$$\lambda$$$, we split the singular values of the inverse Fourier transform of the images from their zero-filled k-space, as noise/artefact- and signal-based coefficients using a $$$k$$$-means ($$$k$$$=2) algorithm and using the histogram of the singular values as the feature for classification. The regularization weighting is the boundary between these two groups.To test our approach, we acquired 4 fully sampled magnitude GRE volumes using our 7T Siemens MRI Plus scanner, which were registered using FLIRT10 and then combined to produce a high SNR reference for use in simulations. We extracted the brain using BET11 and for the sake of less computational overhead, selected a single slice. We replicated the reference image N=[5,10,40,100,600] times and added Gaussian noise on the real and imaginary channels of each k-space to yield SNR values in the magnitude image of SNR = [5,10,20,30]. Finally, we retrospectively under-sampled each k-space from the dataset with different variable-density under-sampling patterns, with under-sampling factors (USF) of USF = [4,8,10,14], and 24 calibration lines. Hence, we made $$$\#\textrm{N} \times \# \textrm{SNR} \times \# \textrm{USF} = 5 \times 4 \times 4 =80$$$ experiments to evaluate the automatic determination of the regularization weighting in Eq. (1), and its effect in the reconstruction as a function of the size of the dataset, noise level and under-sampling.
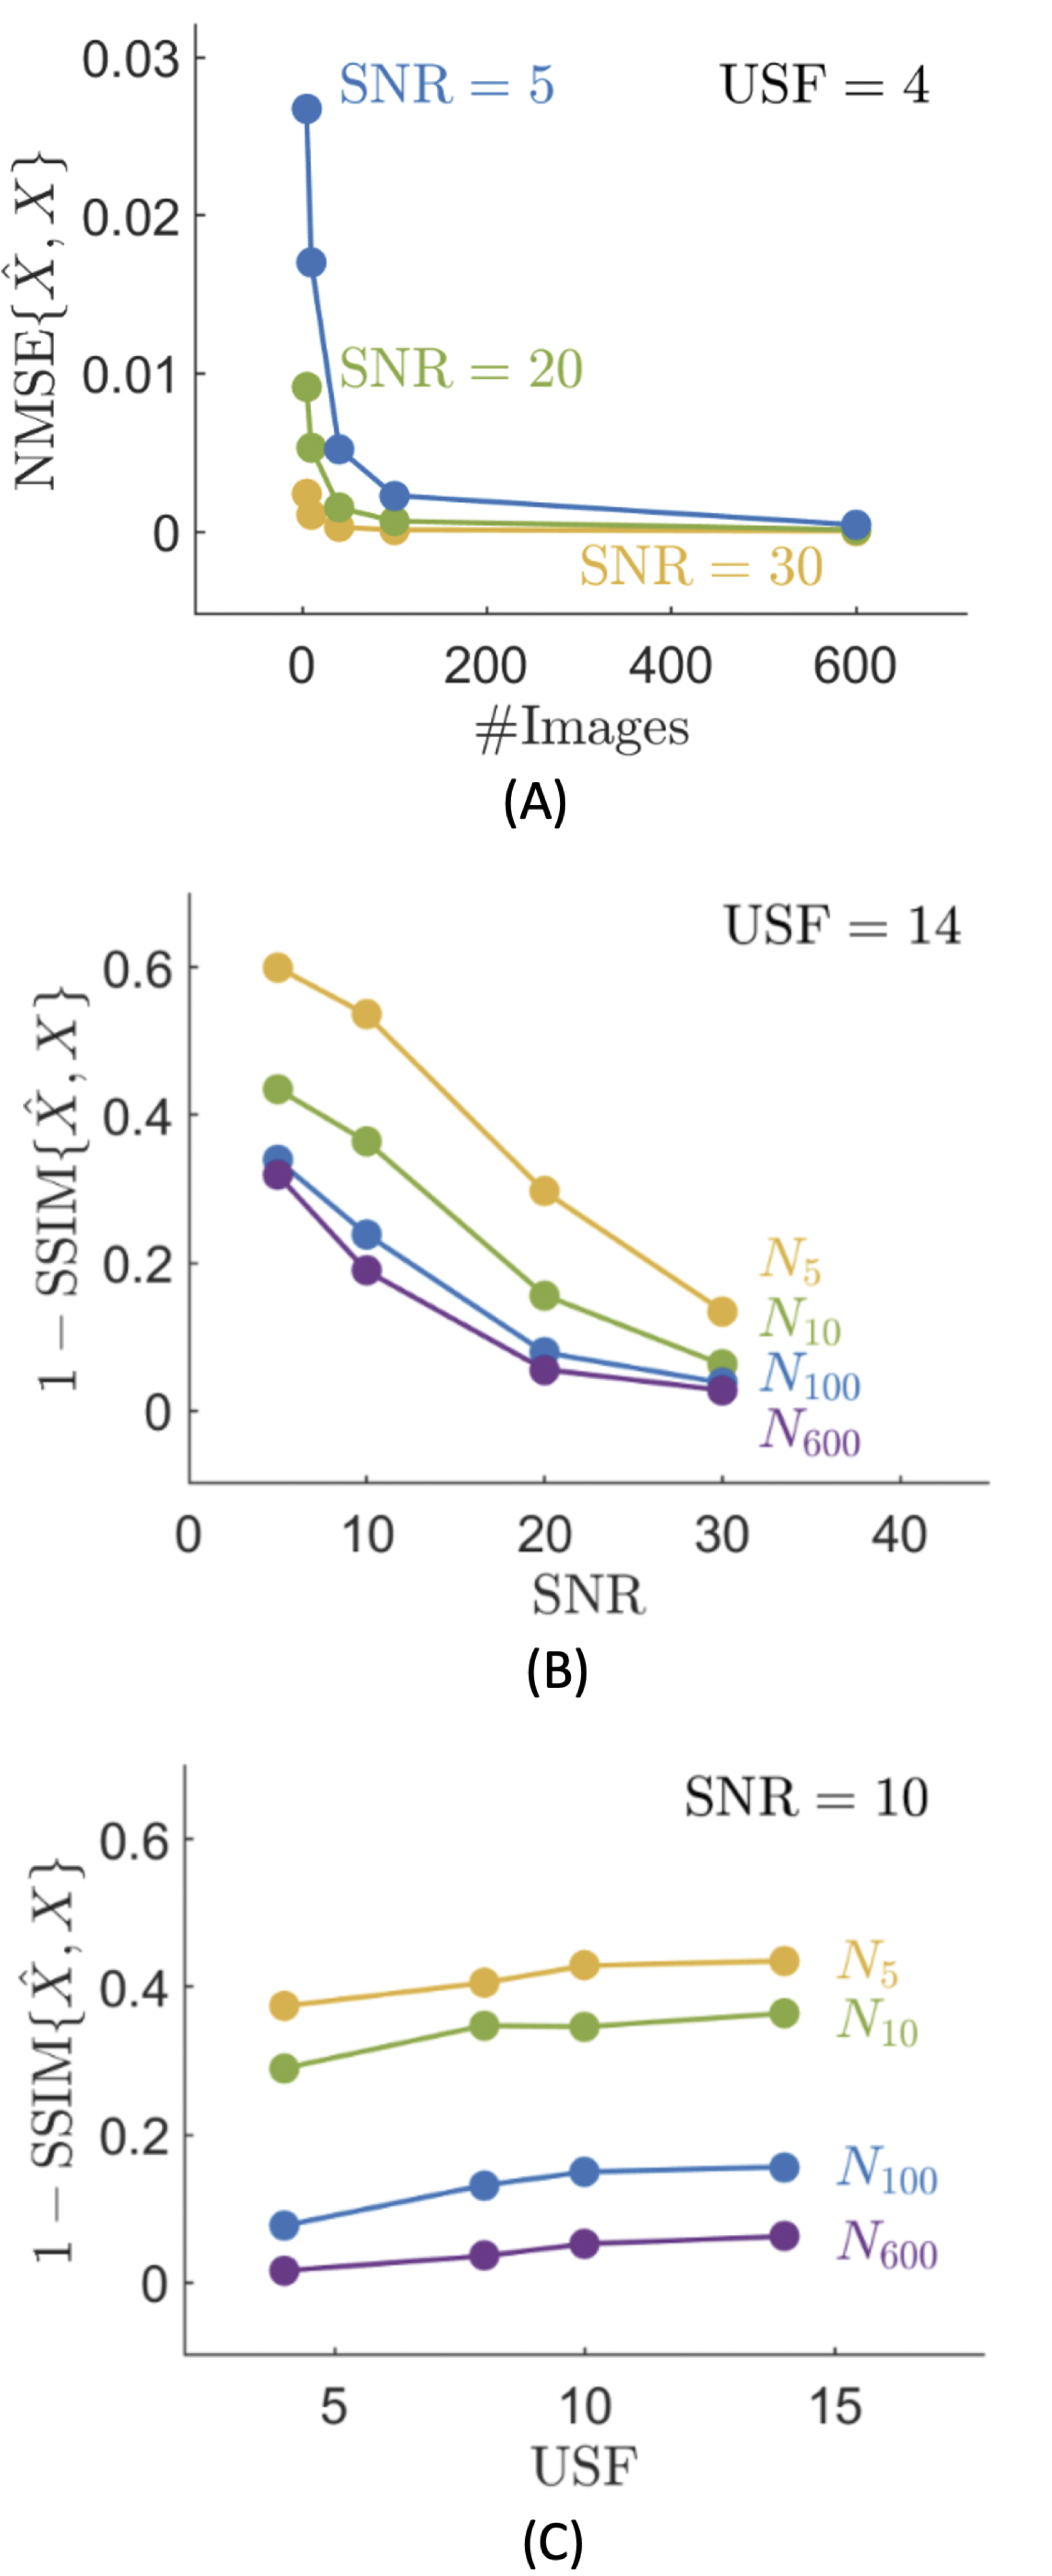
To evaluate the comparison between the reconstruction and the noise-free reference, we used the normalized mean squared error (NMSE), Pearson’s correlation coefficient (PC), high-frequency error norm (HFEN)12 and structural similarity index (SSIM)13 as reconstruction quality indices.
Results
Figures 1-3 show how our method adapts the regularization weighting to perform automatic low rank reconstructions while varying the size of the dataset, under-sampling, or noise level. Best results are found when the dataset has a size over tens or hundreds of images.Conclusion
Initial investigation shows feasible a prospective and automatic procedure for low rank reconstructions. From studying the effect of size, noise, and under-sampling in low rank reconstructions with our method, the size of the dataset appears to be critically important for high reconstruction quality.Acknowledgements
Authors wish to acknowledge funding from CIHR Grant FRN 148453 to RSM and BrainsCAN-the Canada First Research Excellence Fund award to Western University.References
1. Haldar JP. Low-Rank Modeling of Local $k$-Space Neighborhoods (LORAKS) for Constrained MRI. IEEE Trans Med Imaging. 2014;33(3):668-681. doi:10.1109/TMI.2013.2293974
2. Otazo R, Candès E, Sodickson DK. Low-rank plus sparse matrix decomposition for accelerated dynamic MRI with separation of background and dynamic components. Magn Reson Med. 2015;73(3):1125-1136. doi:10.1002/mrm.25240
3. Schloegl M, Holler M, Schwarzl A, Bredies K, Stollberger R. Infimal convolution of total generalized variation functionals for dynamic MRI. Magn Reson Med. 2017;78(1):142-155. doi:https://doi.org/10.1002/mrm.26352
4. Veraart J, Fieremans E, Novikov DS. Diffusion MRI noise mapping using random matrix theory: Diffusion MRI Noise Mapping. Magn Reson Med. 2016;76(5):1582-1593. doi:10.1002/mrm.26059
5. Does MD, Olesen JL, Harkins KD, et al. Evaluation of principal component analysis image denoising on multi-exponential MRI relaxometry. Magn Reson Med. 2019;81(6):3503-3514. doi:10.1002/mrm.27658
6. Combettes PL, Pesquet J-C. Proximal Splitting Methods in Signal Processing. In: Bauschke HH, Burachik RS, Combettes PL, Elser V, Luke DR, Wolkowicz H, eds. Fixed-Point Algorithms for Inverse Problems in Science and Engineering. Vol 49. Springer Optimization and Its Applications. Springer New York; 2011:185-212. doi:10.1007/978-1-4419-9569-8_10
7. Boyd S. Neal Parikh Department of Computer Science Stanford University. :113.
8. Beck A, Teboulle M. A Fast Iterative Shrinkage-Thresholding Algorithm for Linear Inverse Problems. SIAM J Imaging Sci. 2009;2(1):183-202. doi:10.1137/080716542
9. Cai J-F, Candes EJ, Shen Z. A Singular Value Thresholding Algorithm for Matrix Completion. ArXiv08103286 Math. Published online October 17, 2008. Accessed September 3, 2020. http://arxiv.org/abs/0810.3286
10. Jenkinson M, Bannister P, Brady M, Smith S. Improved optimization for the robust and accurate linear registration and motion correction of brain images. NeuroImage. 2002;17(2):825-841. doi:10.1016/s1053-8119(02)91132-8
11. Smith SM. Fast robust automated brain extraction. Hum Brain Mapp. 2002;17(3):143-155. doi:https://doi.org/10.1002/hbm.10062
12. Langkammer C, Schweser F, Shmueli K, et al. Quantitative Susceptibility Mapping: Report from the 2016 Reconstruction Challenge. Magn Reson Med. 2018;79(3):1661-1673. doi:10.1002/mrm.26830
13. Zhou Wang, Bovik AC, Sheikh HR, Simoncelli EP. Image quality assessment: from error visibility to structural similarity. IEEE Trans Image Process. 2004;13(4):600-612. doi:10.1109/TIP.2003.819861
Figures