1190
Fast Variable Density Poisson-Disc Sample Generation with Directional Variation for Compressed Sensing1Radiology and Biomedical Imaging, UCSF, San Francisco, CA, United States, 2Robarts Research, Western University, Ontario, ON, Canada, 3Biomedical Engineering, Northwestern University, Evanston, IL, United States, 4Mathematics and Statistics, University of San Francisco, San Francisco, CA, United States, 5Electrical Engineering, Stanford University, Stanford, CA, United States
Synopsis
We present a fast method for generating a variable density poisson-disc sampling pattern. A minimum parameter value is used to create a background grid array for keeping track of those points that might affect any new candidate point; this reduces the number of conflicts that must be checked before acceptance of a new point, thus reducing the number of computations required. We demonstrate the algorithm's ability to generate variable density poisson-disc sampling patterns where the variations in density are a function of direction. We further show that these sampling patterns are appropriate for compressed sensing applications.
Introduction
Compressed sensing often utilizes a random sampling scheme to create a system matrix that satisfies the Restricted Isometry Property in Levels [1,2]. Parallel imaging uses the sensitivity of multiple antennas to reduce the number of samples of required to reconstruct imagery by interpolating nearby values [3,4,5]. The variable density poisson disc sampling pattern satisfies both purposes. In order to take advantage of multi-coils and compressed sensing well, a fast algorithm to generate asymmetric variable density sampling patterns quickly. The patterns should be asymmetric in order to fully take advantage of coil sensitivity patterns; if the coil sensitivities vary in one direction and not in the orthogonal direction (e.g., as is the case with birdcage and extremity coils) then the density of points should vary differently along different directions.Methods
For this method, a minimum distance between samples for the entire sampling pattern must be established.The density of the poisson disc sampling pattern is varied by parameterizing the pattern's parameter as follows:$$r_{\gamma}(x) = \frac{ \|x\|_2 + 0.15 }{ \gamma },$$
where $$$\gamma>0$$$. With this parameterization, the density of samples is highest near $$$0$$$ frequency and decreases with distance from the origin. Note that $$$r_{\gamma} \geq 0.15$$$, which satisfies the requirement of a minimum.
For an asymmetric sampling pattern with an aspect ratio of $$$\nu$$$, samples with a symmetric sampling parameter are generated on $$$[-0.5/\nu,0.5/\nu)\times[-0.5,0.5)$$$. After the samples are generated, the coordinates of the first dimension are scaled by $$$\nu$$$ to achieve the desired asymmetry.
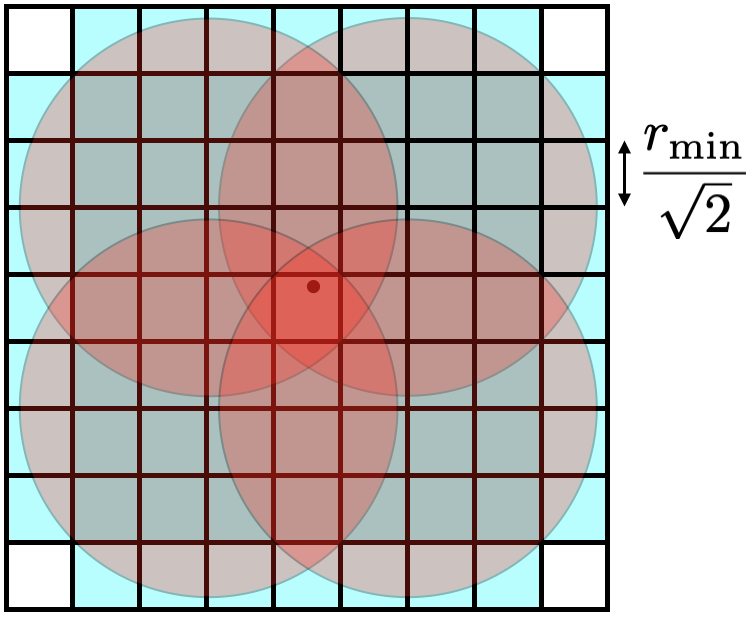
When a candidate point is considered for the sampling pattern, it must be evaluated to see if it's too close to any other point to be valid. The dart-throwing algorithm compares to all other existing points \cite{cline2009dart}; this algorithm is very slow. To reduce the number of comparisons required for each new point, we take advantage of a background grid, as shown in Fig. 1. The size of each square element of the grid is $$$r_{\text{min}}/\sqrt{2} \times r_{\text{min}}/\sqrt{2}$$$; this makes the diagonal with size $$$r_{\text{min}}$$$. When candidate point is evaluated with parameter $$$r_j$$$, the grid element that contains it is identified. Only those points listed in the grid element are compared to the candidate point. If the candidate point is greater than all required distances, then it is added to the list of sample points, and its index $$$j$$$ is added to only those squares in the background that may contain points within its distance metric (identified by the blue squares in Fig. 1). By taking advantage of the background grid, the number of points that must be compared to the candidate point is dramatically reduced.
Results
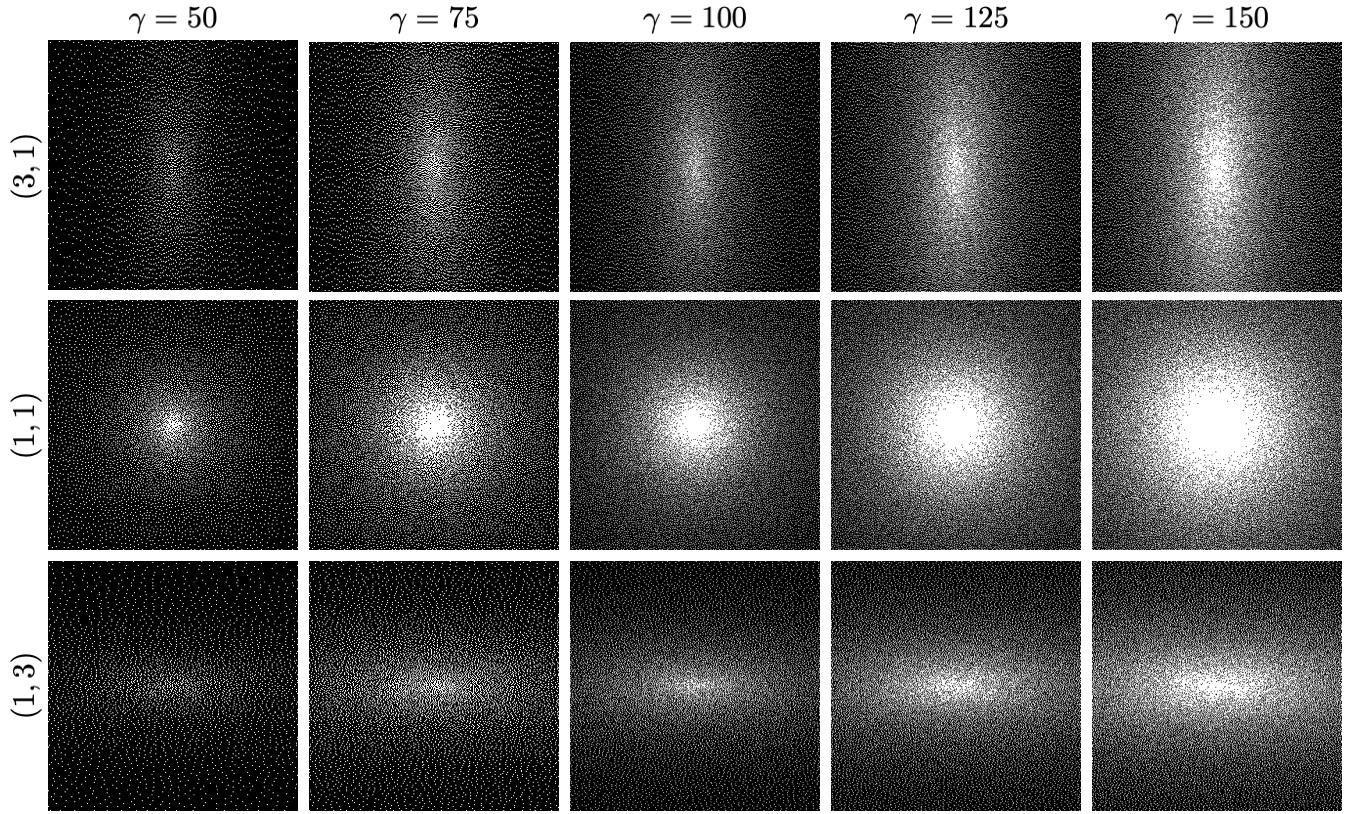
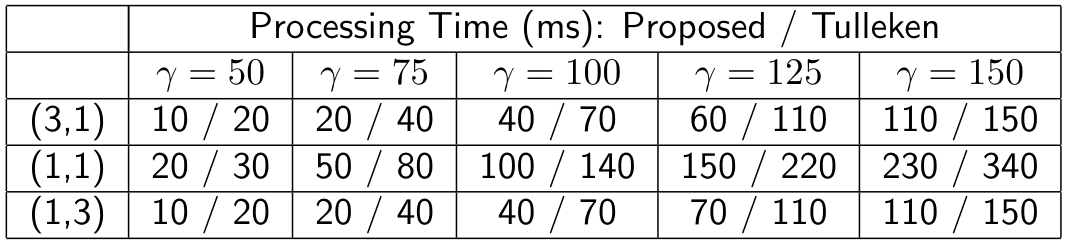
Figure 2 shows sampling patterns generated with the proposed algorithm for different values of $$$\gamma$$$ and $$$\nu$$$.Table 1 compares the time required to compute the variable density poisson-disc sampling pattern with the proposed algorithm to the time required by the Tulleken algorithm of [7] for the sampling patterns shown in Fig. 2. Note that the Tulleken algorithm also takes advantage of a background grid, but does so in a way that requires more comparisons for each candidate point. The improvement in run time is between $$$30-50\%$$$. The algorithms were implemented in C and run on a 2012 Macbook Pro with a 2.5 GHz Intel i7 processor.
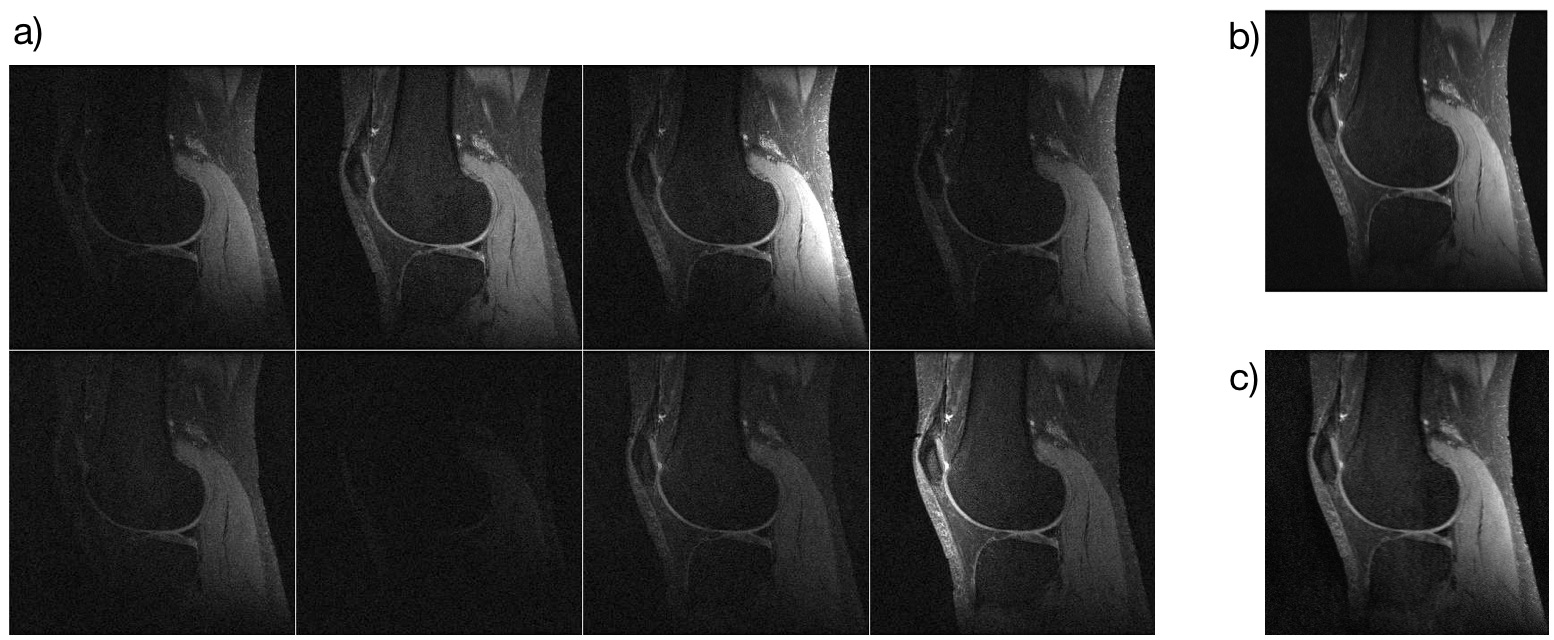
Figure 3 shows the compressed sensing reconstruction for data from an 8 channel extremity coil using the SAKE+L1-ESPIRiT reconstruction algorithm [8,9].
Conclusion
We have created an algorithm that generates fast variable density poisson disc sampling patterns. The algorithm is $$$30-50\%$$$ faster than the Tulleken algorithm for the data tested. Future work could explore generating variable density sampling patterns on a surface [10].Acknowledgements
No acknowledgement found.References
[1] Emmanuel J Cand`es and Michael B Wakin. An introduction to compressive sampling [a sensing/sampling paradigm that goes against the common knowledge in data acquisition].IEEE signal processing magazine,25(2):21–30, 2008.
[2] Ben Adcock, Anders C Hansen, Clarice Poon, and Bogdan Roman. Breaking the coherence barrier: Anew theory for compressed sensing. InForum of Mathematics, Sigma, volume 5, pages 1–84. CambridgeUniversity Press, 2017.
[3] Daniel K Sodickson and Warren J Manning. Simultaneous acquisition of spatial harmonics (SMASH):fast imaging with radiofrequency coil arrays.Magnetic resonance in medicine, 38(4):591–603, 1997.
[4] Peter M Jakob, Mark A Grisowld, Robert R Edelman, and Daniel K Sodickson. AUTO-SMASH: a self-calibrating technique for SMASH imaging.Magnetic Resonance Materials in Physics, Biology andMedicine, 7(1):42–54, 1998.
[5] Nicholas Dwork, Ethan MI Johnson, Daniel O’Connor, Jeremy W Gordon, Adam B Kerr, Corey ABaron, John M Pauly, and Peder EZ Larson. Calibrationless multi-coil magnetic resonance imaging with compressed sensing.arXiv preprint arXiv:2007.00165, 2020.
[6] David Cline, Stefan Jeschke, K White, Anshuman Razdan, and Peter Wonka. Dart throwing on surfaces.InComputer Graphics Forum, volume 28 (4), pages 1217–1226. Wiley Online Library, 2009.
[7] Herman Tulleken. Poisson disk sampling.Dev. Mag, 21:21–25, 2008.
[8] Peter J Shin, Peder EZ Larson, Michael A Ohliger, Michael Elad, John M Pauly, Daniel B Vigneron,and Michael Lustig. Calibrationless parallel imaging reconstruction based on structured low-rank matrix completion. Magnetic resonance in medicine, 72(4):959–970, 2014.
[9] Martin Uecker, Peng Lai, Mark J Murphy, Patrick Virtue, Michael Elad, John M Pauly, Shreyas S Vasanawala, and Michael Lustig. ESPIRiT—an eigenvalue approach to autocalibrating parallel MRI:where SENSE meets GRAPPA.Magnetic resonance in medicine, 71(3):990–1001, 2014.
[10] Ethan M. I. Johnson.Techniques and analyses for ultrashort echo-time magnetic resonance imaging.PhD thesis, Stanford University, 2016.
Figures