1167
Two-Dimensional Coil-signature-based Phase Cycled Reconstruction for Inherent Correction of Echo-Planar Imaging Nyquist Ghost Artifacts1Biomedical Engineering Department, The University of Arizona, Tucson, AZ, United States, 2Siemens Medical Solutions USA, New York, NY, United States, 3Medical Imaging Department, The University of Arizona, Tucson, AZ, United States
Synopsis
A novel two-dimensional (2D) coil-signature-based phase cycled correction method has been developed for Nyquist artifact removal in echo planar imaging (EPI). Our method uses already available coil sensitivity information, without requiring extra reference scans, to correct 2D phase errors and can be applied equally well to single-shot and multi-shot EPI. Our results show that the developed method can effectively reduce Nyquist artifacts in EPI data acquired using a variety of acceleration schemes, such as through-plane Multi-band Imaging (MB) and in-plane parallel SENSitivity Encoding Imaging (SENSE).
Introduction
EPI is a fast-imaging technique, which reduces scan time and dramatically minimizes motion artifacts. However, EPI is more sensitive to artifacts due to the reversal of readout gradient polarities between two consecutive echoes1. A unique artifact of EPI, termed Nyquist artifact, is caused by inconsistency between positive-readout and negative-readout ky lines.Traditional techniques are designed to correct k-space trajectory shift along frequency-encoding direction, referred to as one-dimensional (1D) correction. However, residual artifacts after 1D correction usually remain significant, particularly for oblique-plane EPI2 or in the presence of cross-term eddy current3. Instead, 2D phase correction is more effective in suppressing Nyquist artifacts. The 2D phase inconsistency map can be obtained either directly from separately acquired reference scans4 or inherently from the acquired image data itself using techniques like phase-cycled reconstruction5. However, reference scans require additional scan time and may be susceptible to changes in subject position4. Phase-cycled reconstruction requires a relatively large field of view (FOV) so that artifacts in the image background can be measured5, which may not be feasible for EPI scans under a small or tight FOV, which are used to acquire high-resolution images of small regions (e.g. brainstem and hippocampus) in brain.
To address these limitations, we investigated an inherent 2D coil-signature-based phase-cycled correction technique for EPI Nyquist removal, that can be implemented without acquiring additional reference scans and which is effective for EPI with different acceleration approaches and under different FOVs.
Methods
The correction algorithm is outlined below:Step 1: The phase inconsistency map was determined by using phase-cycled reconstruction and coil sensitivity profile (CSP). We first performed phase-cycling along the frequency-encoding direction using Eq.1, in which $$$C_{0}$$$ was cycled between $$$-\pi$$$ and $$$\pi$$$.
$$ \theta(x,y)=C_{0}(x)+C_{1}\times y \;\;\;\;\;[1] $$
Then Nyquist artifact-free complex image signals can be solved using Eq.2.
$$ I=Cg \;\;\;\;\;[2] $$
where $$$I$$$ represents the positive and negative readout images, $$$C$$$ represents phase inconsistency map with elements $$$\theta(x,y)$$$, and $$$g$$$ represents Nyquist artifact-free complex image signals.
With each possible phase $$$C_{0}$$$, we generated corresponding CSPs from the corrected complex image $$$g$$$ and determined the phase value with the minimum CSP difference compared to the Nyquist artifact-free CSP. Phase cycling was performed again but this time along the phase-encoding direction using Eq.1 and Eq.2, in which $$$C_{1}$$$ was also cycled between $$$-\pi$$$ and $$$\pi$$$.
Figure 1 shows an illustration of single-band EPI (SB-EPI) correction. Figure 1(a) shows SB-EPI with strong Nyquist artifact and Figure 1(b) shows the region used for comparing CSP (marked as green), which is defined as the overlapping regions of Nyquist artifacts and parent image. Figure 1(c) shows a series of corrected complex images of one coil. Figure 1(d) shows CSPs of one column from images in Figure 1(c) and Figure 1(e) shows the variation of CSP difference.
Step 2: With the 2D phase map from step 1 and the unaliased CSP from the scanner, the unaliased parent-image intensity $$$P$$$ can be resolved using Eq.3 or equivalently using Eq.4 and Eq.5.
$$ I=CKP\;\;\;\;\;[3] $$
where $$$I$$$ represents aliased positive or negative read-out complex image intensity; $$$C$$$ is the 2D phase map from step 1 and $$$K$$$ represents the unaliased CSP.
$$ I_{p,i,s_{l}}(x,y)=\frac{1}{2Acc_{in}}\sum_{z=1}^{Acc_{MB}}\sum_{n=0}^{2Acc-1}K_{z,i}(x,y+\frac{n\times FOV}{2Acc_{in}})P_{z}(x,y+\frac{n\times FOV}{2Acc_{in}})\;\;\;\;\;[4] $$
$$ I_{n,i,s_{l}}(x,y)=\frac{1}{2Acc_{in}}\sum_{z=1}^{Acc_{MB}}\sum_{n=0}^{2Acc-1}e^{i\theta(x,y+\frac{n\times FOV}{2Acc_{in}})}e^{i\theta_{n}}K_{z,i}(x,y+\frac{n\times FOV}{2Acc_{in}})P_{z}(x,y+\frac{n\times FOV}{2Acc_{in}})\;\;\;\;\;[5] $$
where $$$Acc_{MB}$$$ and $$$Acc_{in}$$$ represent through-plane and in-plane acceleration factors, respectively. $$$K_{z,i}(x,y+\frac{n\times FOV}{2Acc_{in}})$$$ represents the unaliased complex CSP intensity separated by $$$\frac{FOV}{2Acc_{in}}$$$ at slice $$$z$$$ of coil $$$i$$$; $$$P_{z}(x,y+\frac{n\times FOV}{2Acc_{in}})$$$ represents the unaliased parent-image intensity separated by $$$\frac{FOV}{2Acc_{in}}$$$ at slice $$$z$$$; $$$\theta(x,y+\frac{n\times FOV}{2Acc_{in}})$$$ represents the 2D phase map from step 1, which is separated by $$$\frac{FOV}{2Acc_{in}}$$$ and $$$\theta_{n}$$$ is known as priority, which is a phase term caused by the k-space acquisition trajectories.
Figure 2 shows a workflow of correction for single-shot EPI with $$$Acc_{MB}=2$$$ and $$$Acc_{in}=2$$$. If correction is performed for SB-EPI, Nyquist artifact-free CSP in (F) is the same as unaliased CSP from scanner in (J).
Results and Discussion
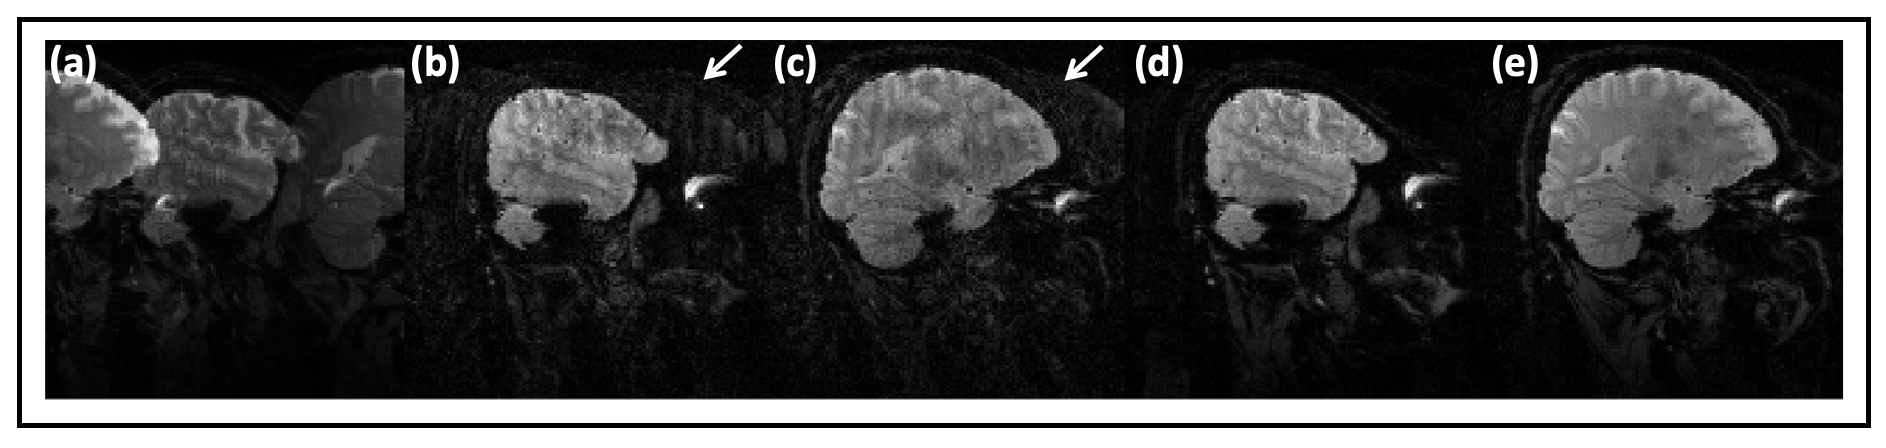
Figure 3 shows the aliased images and (1D and 2D) corrected images: (a) 1st-shot SB-EPI; (b) 2nd-shot SB-EPI; (c) 2-shot SB-EPI. The images in the left column were reconstructed directly from k-space data, showing strong Nyquist and under-sampling aliasing artifacts. The images in the middle column were reconstructed with 1D correction. Residual artifacts remain visible and may interfere with the parent image, as indicated by arrows. The images in the right column were reconstructed with our proposed 2D phase correction technique. Nyquist artifacts are much better suppressed with 2D correction in comparison to conventional 1D correction.Figure 4 shows the aliased 2-shot MB-EPI ($$$Acc_{MB}=2$$$) and (1D and 2D) corrected images. Arrows in Figure 4(b-c) indicates significant residual artifacts after 1D correction. After 2D correction, the Nyquist artifact are effectively eliminated, shown in Figure 4(d-e).
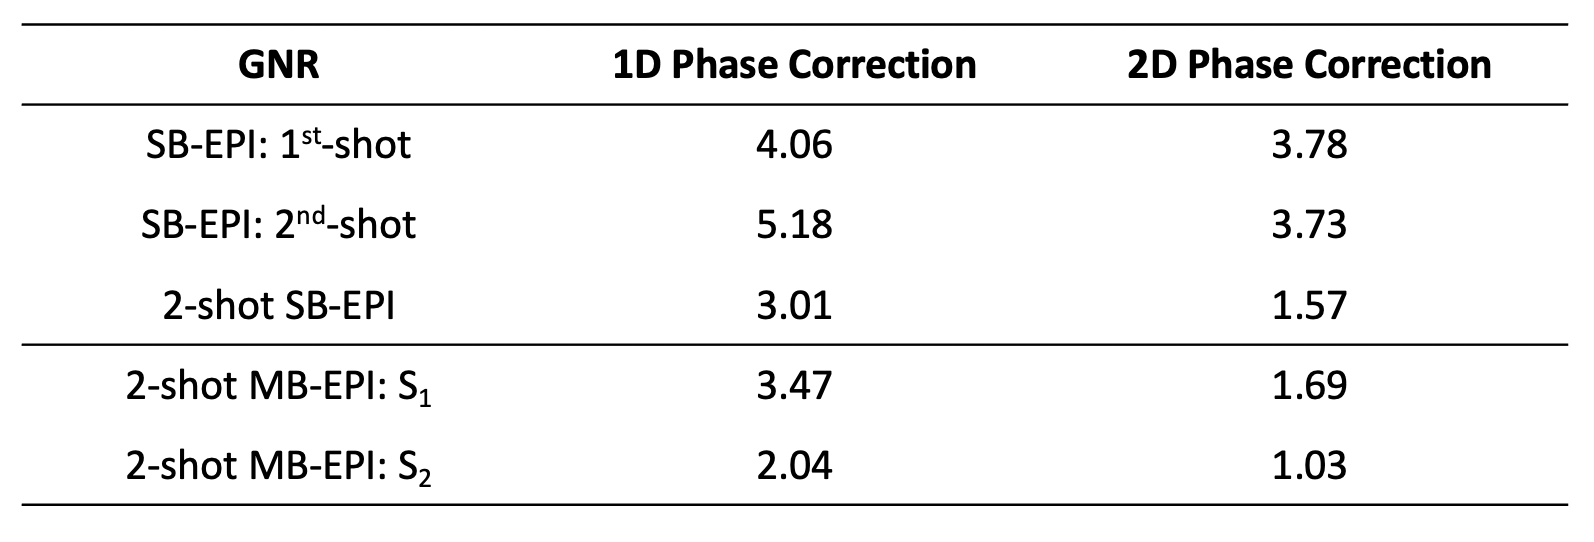
Quantitative assessment of aliasing artifact, ghost-to-noise ratio (GNR), is shown in Table 1. For 2-shot SB-EPI, GNR is 3.01 after 1D correction and reduces to 1.57 after 2D correction. For 2-shot MB-EPI, GNR for two slices reduces to 1.69 and 1.03, respectively, after 2D correction.
Conclusions
We have developed a novel 2D coil-signature-based phase-cycled reconstruction method that can successfully reduce Nyquist artifacts in single-shot and multi-shot EPI, that have been acquired using a variety of in-plane and through-plane acceleration approaches.Acknowledgements
No acknowledgement found.References
1. Schmitt, F., Stehling, M., Turner, R. and Mansfield, P. (2013). Echo-Planar Imaging. Berlin: Springer Berlin.
2. Reeder, S., Atalar, E., Faranesh, A. and McVeigh, E. (1999). Referenceless interleaved echo-planar imaging. Magnetic Resonance in Medicine, 41(1), pp.87-94.
3. Grieve, S., Blamire, A. and Styles, P. (2002). Elimination of Nyquist ghosting caused by read-out to phase-encode gradient cross-terms in EPI. Magnetic Resonance in Medicine, 47(2), pp.337-343.
4. Xu, D., King, K., Zur, Y. and Hinks, R. (2010). Robust 2D phase correction for echo planar imaging under a tight field-of-view. Magnetic Resonance in Medicine, 64(6), pp.1800-1813.
5. Chen, N., Avram, A. and Song, A. (2011). Two-dimensional phase cycled reconstruction for inherent correction of echo-planar imaging nyquist artifacts. Magnetic Resonance in Medicine, 66(4), pp.1057-1066.
Figures
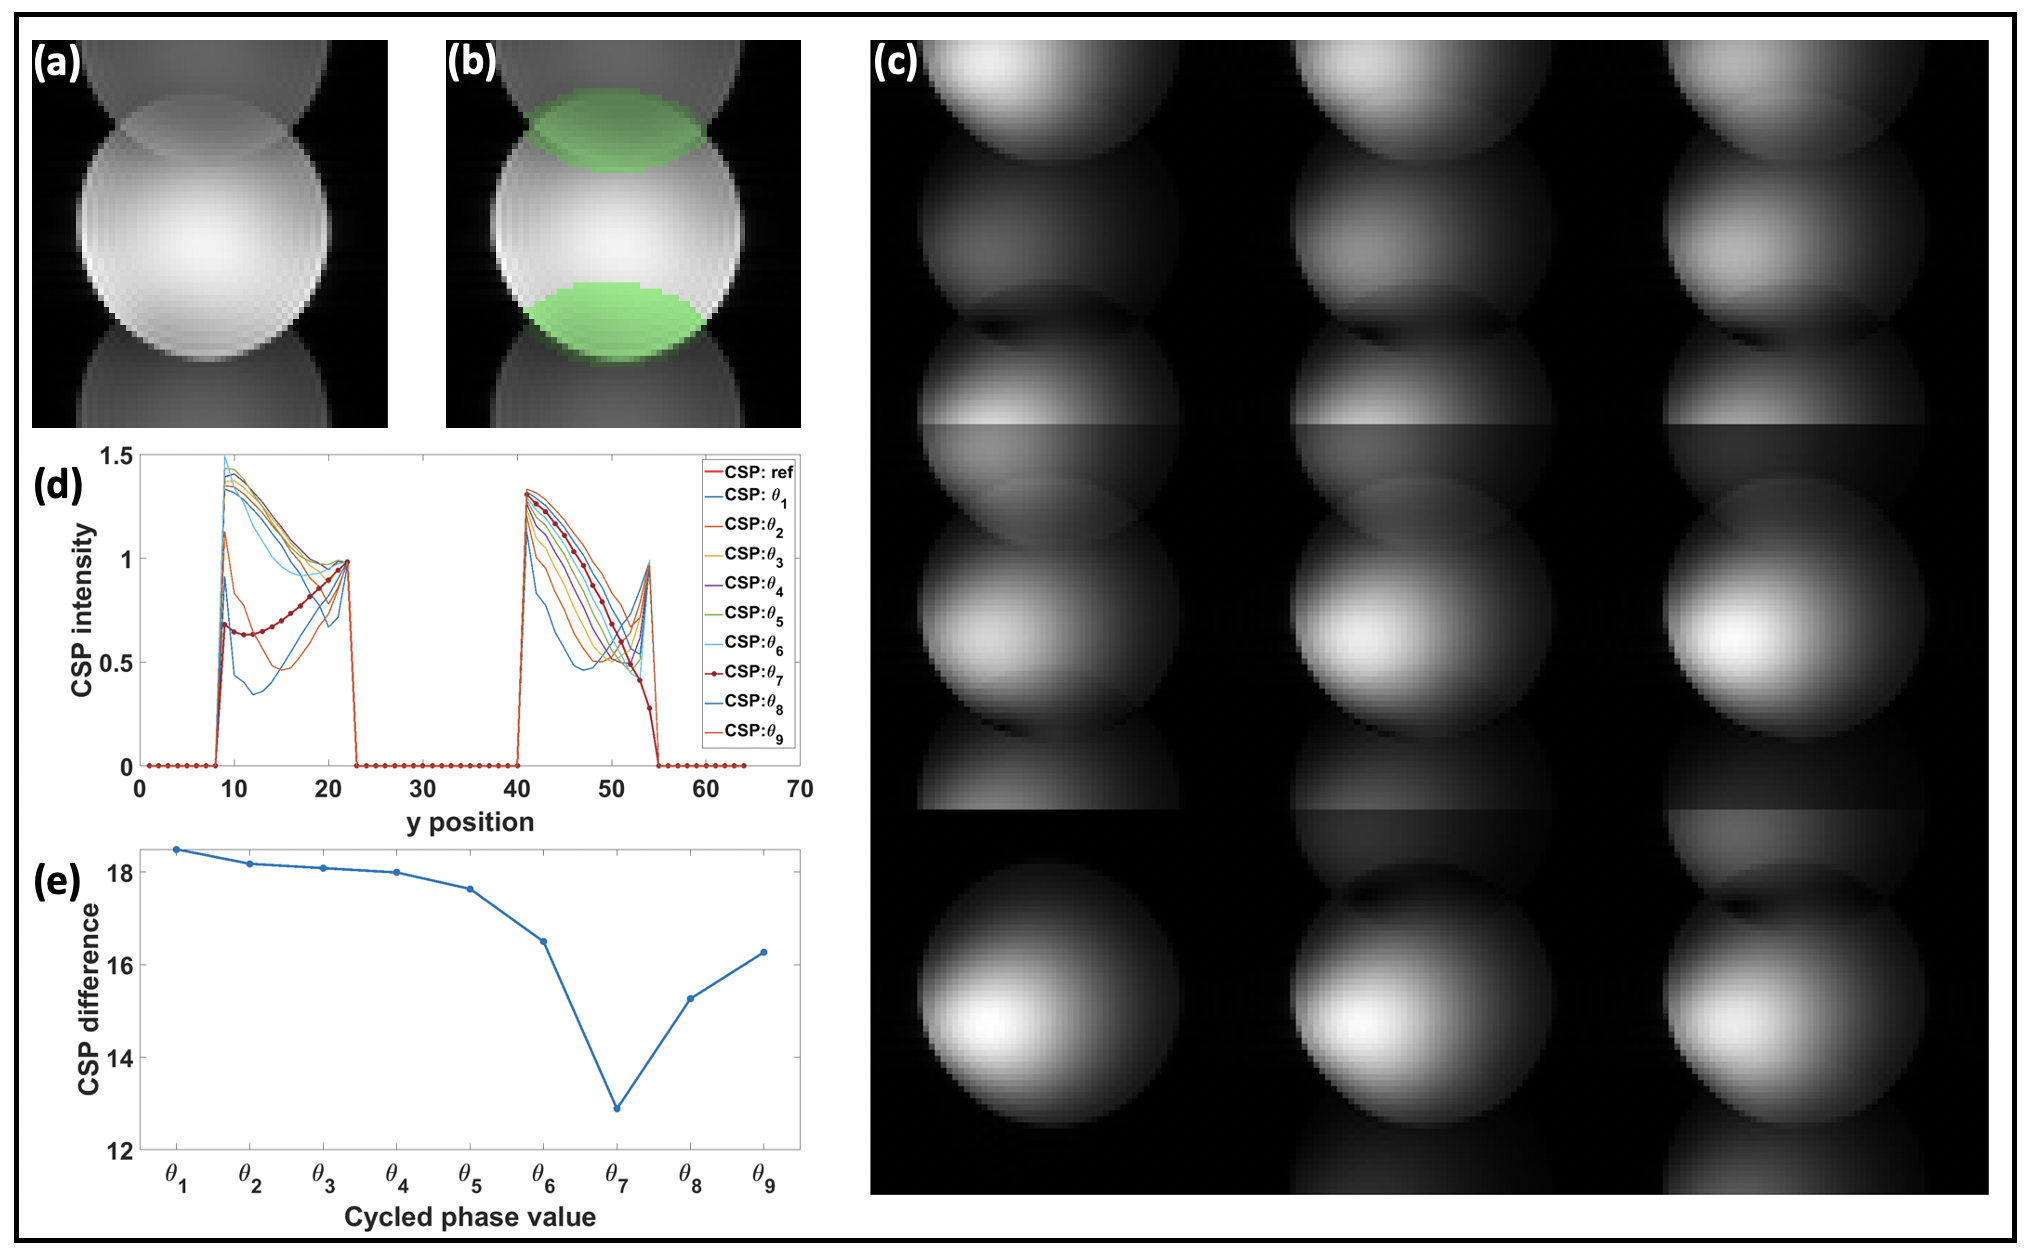
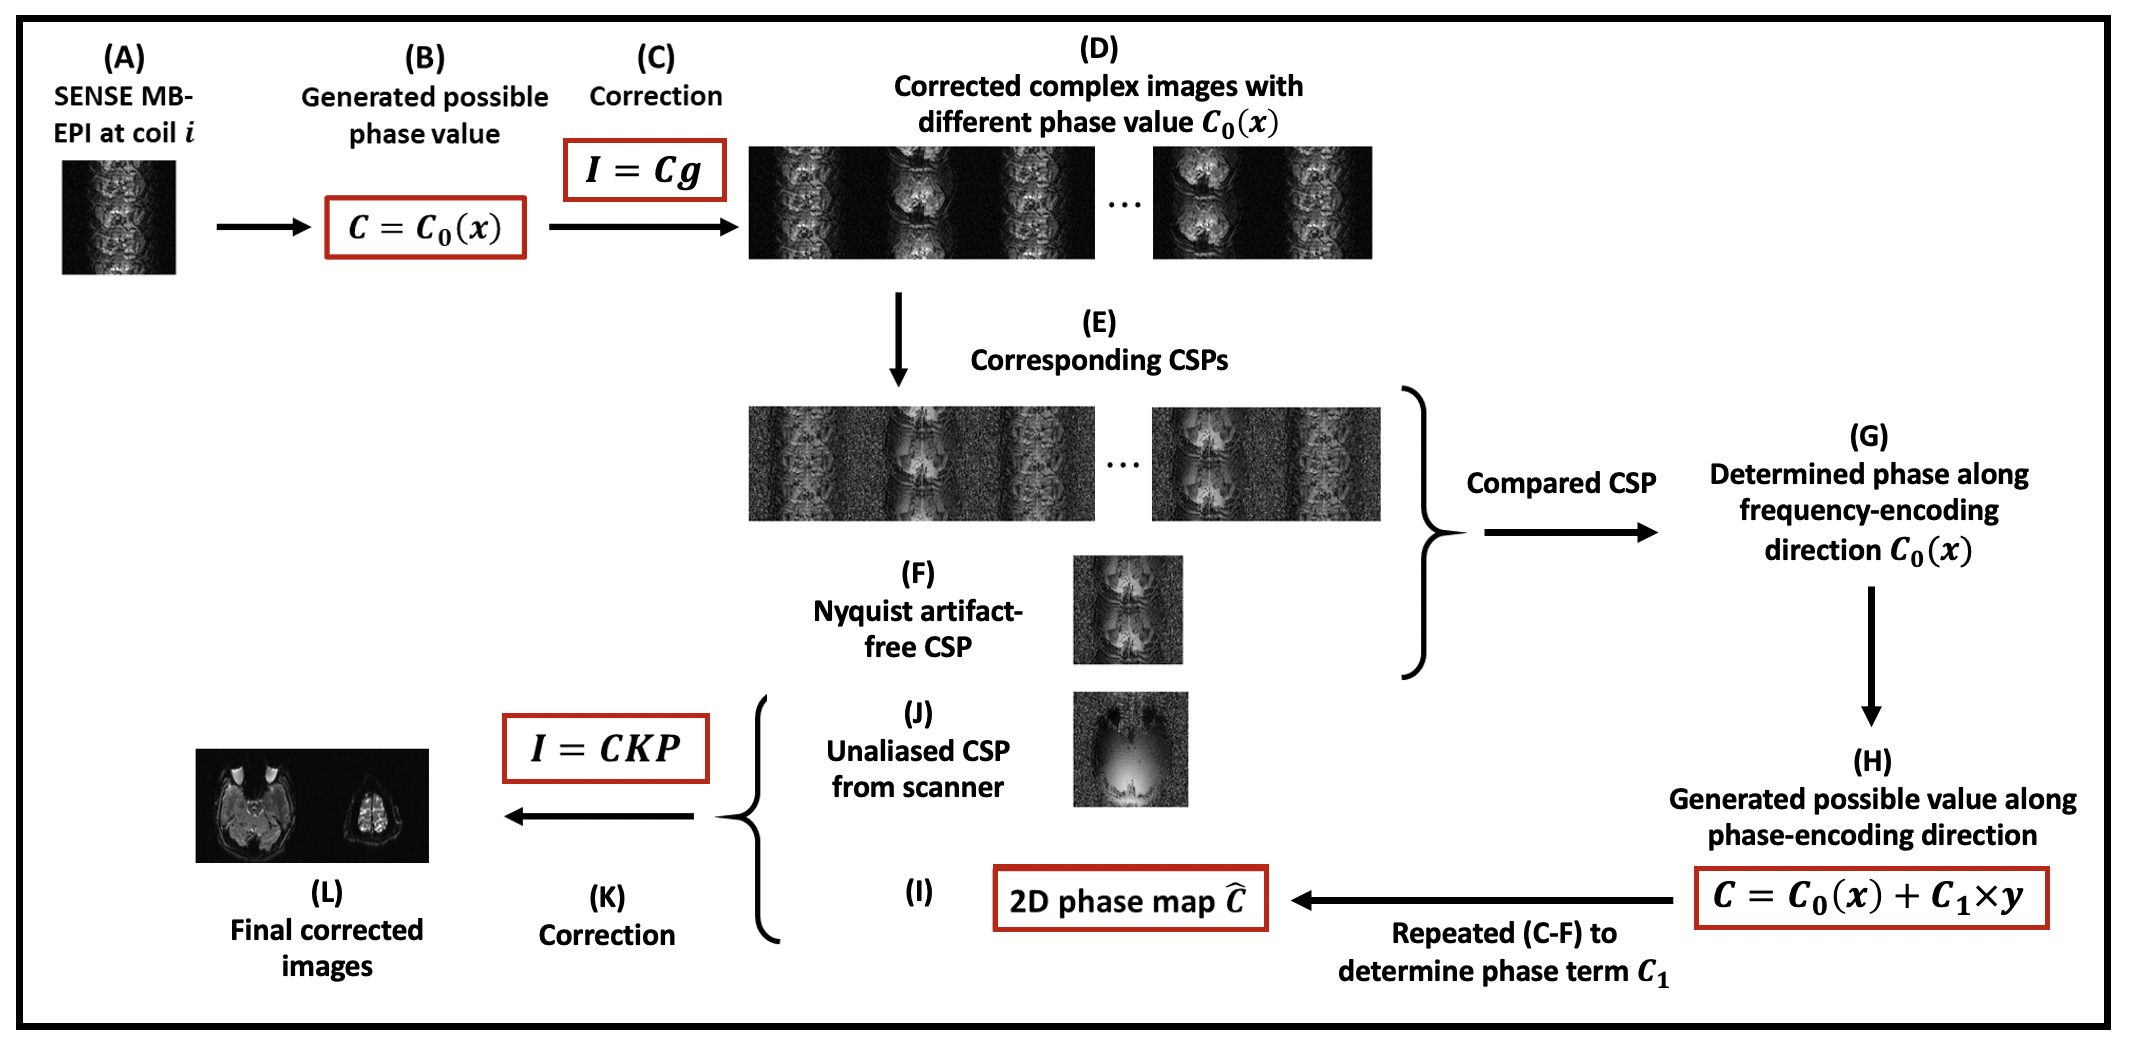
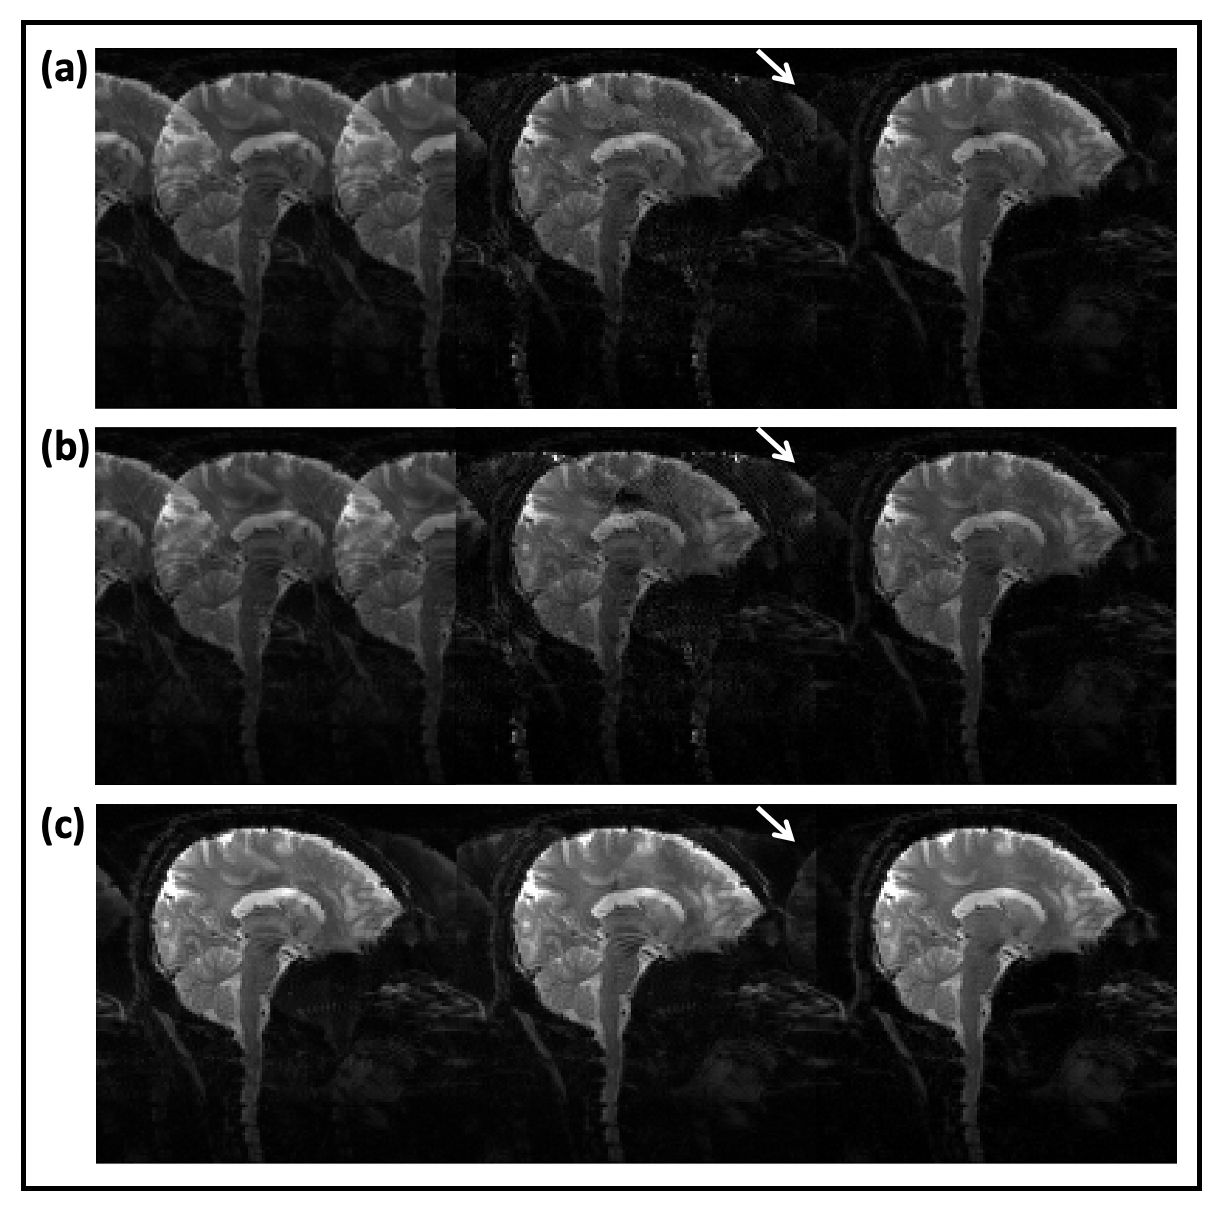
Figure 3. Aliased images and corresponding (1D and 2D) corrected images. From left to right, Figure 3(a): 1st-shot SB-EPI reconstructed directly from k-space data by extracting only odd ky lines, corrected images after 1D correction and 2D correction. Figure 3(b): 2nd-shot SB-EPI reconstructed directly from k-space data by extracting only even ky lines, corrected images after 1D correction and 2D correction. Figure 3(c): 2-shot SB-EPI reconstructed directly from k-space data, corrected images after 1D correction and 2D correction.