1152
Electric properties tomography (EPT) of breast tissue using High Spectral and Spatial resolution (HiSS) MRI1Department of Radiology, The University of Chicago, Chicago, IL, United States, 2Philips Research, Hamburg, Germany
Synopsis
Current breast MRI protocols are heavily reliant on dynamic contrast-enhanced MRI (DCEMRI), but this practice is not ideal, due to recently reported findings of long-term gadolinium deposition in several tissues. We demonstrate feasibility of EPT analysis as applied to HiSS MRI data, which could simplify the process of lesion delineation relative to the current method and may thus improve the diagnostic accuracy of non-contrast breast MRI. Linearly extrapolated phase, to TE = 0 ms, from complex multi-TE gradient echo images obtained using HiSS MRI was used for this purpose.
INTRODUCTION
MRI exams are recommended as part of a screening protocol for several subsets of women, including women at high risk for development or recurrence of breast cancer.1 Current breast MRI protocols are heavily reliant on dynamic contrast-enhanced MRI (DCEMRI),2,3 but this practice is not ideal. The use of gadolinium-based contrast media raises concerns due to occasional adverse events and recent reports of gadolinium deposition in brain, bone, and other tissues.4-6 In order to reduce risks for women at high risk for breast cancer, and increase compliance for implementation of MRI-based screening in a wider population, an effective non-contrast MRI protocol is needed. Electric properties tomography (EPT) is a novel and promising technique that allows calculation of conductivity and permittivity of tissue, with potential to address the above concerns.7,8 In cancerous lesions, conductivity is increased due to higher sodium concentration and higher water content. Thus, in principle, EPT could be used to differentiate cancerous from benign tissue and its utility in diagnosing breast lesions has been explored in several studies, with promising results.9-11 Here, we demonstrate feasibility of EPT as applied to HiSS MRI data in breast and compare the results to values obtained from T2-weighted spin-echo based sequence.METHODS
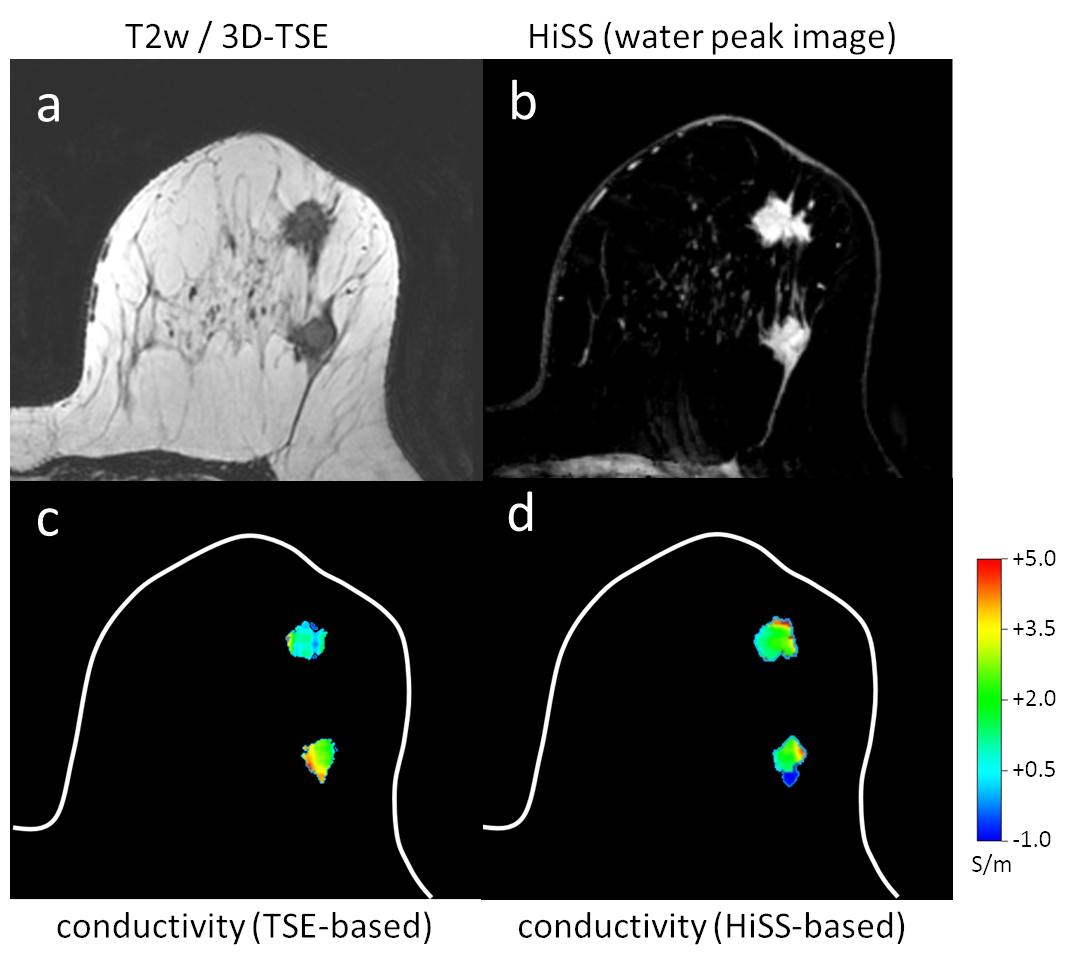
Echo-planar spectroscopic imaging (EPSI) was implemented using a 16-channel dedicated breast coil on a 3.0T Philips dStream Ingenia scanner (TR/TEeffective: 2820/23 ms; TE = 2.95 ms + N x 1.82 ms, N=0,1,2…,22; spectral resolution: 23.9 Hz; flip angle: 45°; FOV 256 x 384 mm2; spatial resolution: 0.8x0.8 mm2; slice thickness 3 mm; 60 slices; SENSE acceleration factor: 3 (RL)), yielding multi-echo gradient echo 2D axial HiSS images and spectra of water and fat resonances in each voxel, in a patient with two breast lesions (invasive ductal carcinomas).12 Water peak height images were constructed from HiSS MRI spectral data.12 Complex individual echo HiSS images were used to linearly extrapolate the phase dependence to TE = 0 ms. Every other echo was used in extrapolation to correct for phase wraparound. From the extrapolated phase, conductivity maps were calculated by Electrical Properties Tomography (EPT). For comparison, conductivity was also calculated from the phase of a 3D turbo spin echo T2-weighted non-fat suppressed sequence (T2W-VISTA). Conductivity s was calculated numerically from the corresponding phase j via s = Ѳj/(2mw) (with vacuum permeability m and Larmor frequency w) in combination with a bilateral denoising filter.8RESULTS
The slice through the center of the two invasive ductal carcinomas of the patient is shown in Fig. 1. The HiSS image clearly delineates the two lesions of the patient. EPT yields a median lesion conductivity of 1.91 S/m (upper/lower quartile = 1.31/2.77 S/m) for the HiSS-based conductivity reconstruction and 1.48 S/m (upper/lower quartile = 0.69/2.61 S/m) for the TSE-based conductivity reconstruction. This is in line with the expected conductivity as found in previous studies.10,11DISCUSSION
We demonstrate feasibility of calculating conductivity maps using EPT, from HiSS MRI data. Previously, DCEMRI images were used to outline lesion ROIs for EPT analysis on 3D T2W-VISTA images. EPT implementation in HiSS MRI allows outlining of the lesion on the same sequence that is used to calculate conductivity maps, increasing reliability and eliminating the task of image registration between sequences with different contrast.The difference between T2W-VISTA and HiSS MRI in calculated conductivity may be due to differences in the acquisition schemes. The fast readout spin-echo train in T2W-VISTA could be introducing spatial blurring which can smooth out the phase map. In HiSS MRI there is no k-space acceleration and thus no associated blurring, so HiSS-derived phase map could more closely represent the intrinsic variability in tissue properties. In addition, HiSS phase maps are extrapolated to TE = 0 ms using multiple echoes which could improve accuracy. Conversely, the image phase is more readily obtained from T2W-VISTA, as phase calculation in HiSS MRI necessitates extrapolation to TE = 0 ms. Processing HiSS data in the spectral domain could further improve estimation of phase maps.
CONCLUSION
We demonstrate feasibility of EPT analysis as applied to HiSS MRI data, which could simplify the process of lesion delineation relative to the current method and may improve the diagnostic accuracy of non-contrast breast MRI. This would, in turn, facilitate development of non-contrast breast cancer MRI screening protocols and reduce risk of gadolinium deposition in the population of women currently screened with MRI. It could also make it possible to offer MRI screening to women outside the high-risk population.Acknowledgements
This work was supported by NIH R01 CA167785.References
1. Mainiero MB, Moy L, Baron P, et al. ACR Appropriateness Criteria((R)) Breast Cancer Screening. Journal of the American College of Radiology : JACR. 2017;14(11s):S383-s390.
2. Morris EA, Comstock CE, Lee CH, et al. ACR BI-RADS® Magnetic Resonance Imaging. In: ACR BI-RADS® Atlas, Breast Imaging Reporting and Data System. Reston, VA: American College of Radiology; 2013.
3. Mann RM, Kuhl CK, Moy L. Contrast-enhanced MRI for breast cancer screening. J Magn Reson Imaging. 2019.
4. Costa AF, van der Pol CB, Maralani PJ, et al. Gadolinium Deposition in the Brain: A Systematic Review of Existing Guidelines and Policy Statement Issued by the Canadian Association of Radiologists. Canadian Association of Radiologists journal = Journal l'Association canadienne des radiologistes. 2018;69(4):373-382.
5. Gulani V, Calamante F, Shellock FG, Kanal E, Reeder SB. Gadolinium deposition in the brain: summary of evidence and recommendations. The Lancet Neurology. 2017;16(7):564-570.
6. Murata N, Murata K, Gonzalez-Cuyar LF, Maravilla KR. Gadolinium tissue deposition in brain and bone. Magnetic resonance imaging. 2016;34(10):1359-1365.
7. Hancu I, Liu J, Hua Y, Lee SK. Electrical properties tomography: Available contrast and reconstruction capabilities. Magn Reson Med. 2019;81(2):803-810.
8. Katscher U, van den Berg CAT. Electric properties tomography: Biochemical, physical and technical background, evaluation and clinical applications. NMR Biomed. 2017;30(8).
9. Kim SY, Shin J, Kim DH, et al. Correlation between conductivity and prognostic factors in invasive breast cancer using magnetic resonance electric properties tomography (MREPT). Eur Radiol. 2016;26(7):2317-2326.
10. Mori N, Tsuchiya K, Sheth D, et al. Diagnostic value of electric properties tomography (EPT) for differentiating benign from malignant breast lesions: comparison with standard dynamic contrast-enhanced MRI. Eur Radiol. 2019;29(4):1778-1786.
11. Shin J, Kim MJ, Lee J, et al. Initial study on in vivo conductivity mapping of breast cancer using MRI. J Magn Reson Imaging. 2015;42(2):371-378.
12. Medved M, Li H, Abe H, et al. Fast bilateral breast coverage with high spectral and spatial resolution (HiSS) MRI at 3T. J Magn Reson Imaging. 2017;46(5):1341-1348.
Figures