1149
Fast Longitudinal Image REgistration (FLIRE) for Breast MRI1Radiology, University of California, San Diego, La Jolla, CA, United States, 2Circulation and Medical Imaging, Norwegian University of Science and Technology, Trondheim, Norway, 3Radiation Oncology, University of California, San Diego, La Jolla, CA, United States
Synopsis
MRI is commonly used to evaluate breast cancer response to neoadjuvant chemotherapy. Image registration algorithms aid diagnostic accuracy by correcting changes in patient position across visits. A novel technique, Fast Longitudinal Image REgistration (FLIRE), was evaluated by comparison to a standard algorithm optimized for breast tissue, DRAMMS. Breast images acquired over the course of neoadjuvant treatment were registered to baseline images. FLIRE runtime was 5 minutes (~20× faster). With this fast processing time, FLIRE performed within 2.5-10.2% of optimized DRAMMS in similarity measures. Overall accuracy and computation speed for FLIRE with default arguments demonstrates promise for clinical time-sensitive applications.
Introduction
Breast cancer is the most common and second deadliest cancer for women in the United States [1]. MRI is commonly used to evaluate response to treatment in the neoadjuvant setting [2,3]. In particular, diffusion MRI has been demonstrated to show response to chemotherapy early in treatment [4]. Evaluation of response to treatment across time points would benefit from quantitative assessment across time points, for which fast and reliable registration methods are needed. Currently, a variety of image registration methods based on affine, elastic, and deformable transformations are used to adjust for differences in patient positioning [5-8]. For breast registration, the Deformable Registration via Attribute Matching and Saliency Weighting (DRAMMS) demonstrated higher accuracy than five other signal intensity based methods [9]. However, widespread adoption of registration methods presents a challenge due to long run times and variable parameters for each application. The goal of this study was to explore intrasubject registration of longitudinal breast MRI images using a novel Fast Longitudinal Image REgistration algorithm and compare registration performance to the state-of-the-art method, DRAMMS. FLIRE utilizes voxel smoothing and intensity based matching to register the most to least prominent voxels. DRAMMS examines the Gabor attributes and mutual-saliency weighting to register voxels based on geometric texture [9,10].Methods
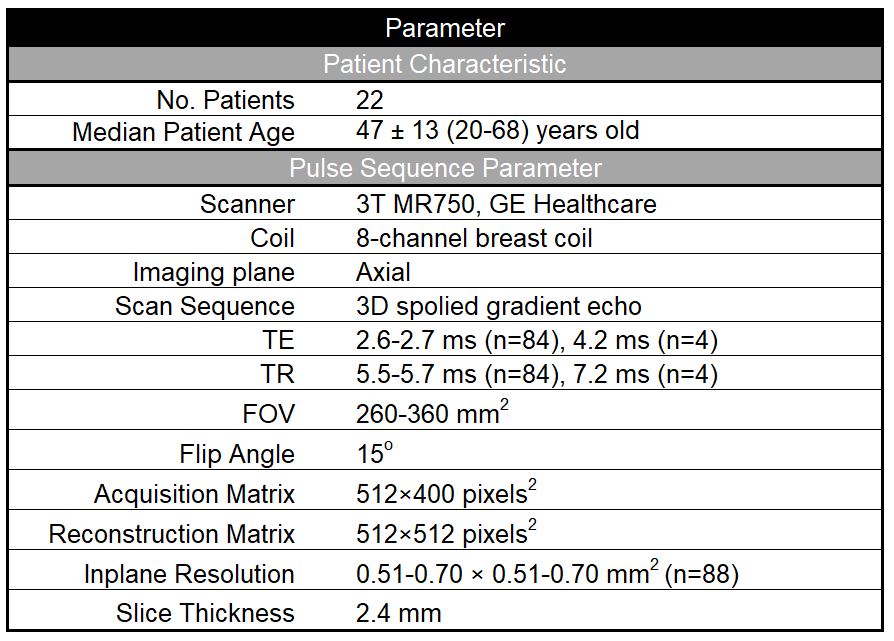
Twenty-two breast cancer patients (age 47±13 years old, range 20-68) received neoadjuvant chemotherapy (primarily paclitaxel ±experimental agent followed by anthracycline) prior to surgery and a biopsy confirmed cancer diagnosis. Patients underwent multi-parametric MRI exams at 4 timepoints: before neoadjuvant treatment, early-treatment, mid-treatment, and prior to surgery, over a period of 1-7 months. Data were collected using a breast-coil array on two 3T scanners (MR750, GE Healthcare, Milwaukee, U.S.). Pulse sequence parameters are shown in Table 1.Registration
Longitudinal T1 images were registered to baseline using both FLIRE and DRAMMS. All datasets were normalized by the 98th percentile of signal intensity before registration to account for intensity differences across visits. FLIRE was run with default arguments not yet optimized for breast and DRAMMS regularization weight and speed option (-g 0.3 -fast) were adjusted based on a previously reported configuration for breast registration [9].
Evaluation
Registration methods were evaluated within the breast tissue using sum of squared differences (SSD), correlation coefficient (CC), and mutual information (MI) between baseline and each visit, as described below:
$$SSD = \frac{\Sigma(I(t_i)-T(I(t)))^2}{\Sigma(I(t_i))^2}, \space\space\space$$
$$CC=\frac{\sum\space( I(t_1)-\overline{I}(t_1))\space\space(T(I(t))-T(\overline{I}(t)))}{[\space\sum(I(t_1)-\overline{I}(t_1))^2\space\space\sum((T(I(t))-T(\overline{I}(t)))^2\space]^{1/2}}, \space\space\space \overline{I}(t)=\frac{\sum\space( I(t)}{n}, n= elements\space in \space I(t), \space\space\space$$
$$MI(x,y) = \sum_{y\epsilon Y}\sum_{x\epsilon X}p(x,y)log(\frac{p(x,y)}{p(x)p(y)}), \space\space\space$$
All statistical analyses were performed using SPSS statistics software (version 26 for Mac OS X, IBM, Armonk, NY, USA). Threshold for significance was set at 0.05. Differences in SSD, MI and CC were compared using two-way (registration methods and visits) repeated measures analyses of variance (ANOVA) with Sidak post hoc tests. To compare registration methods, similarity measures for each patient were averaged across time points.
Results
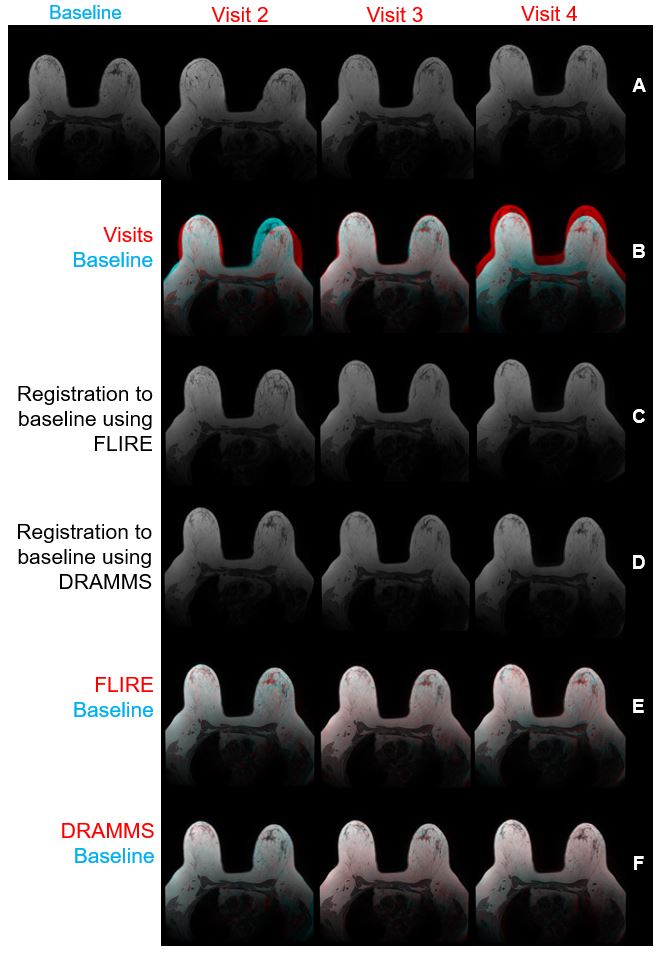
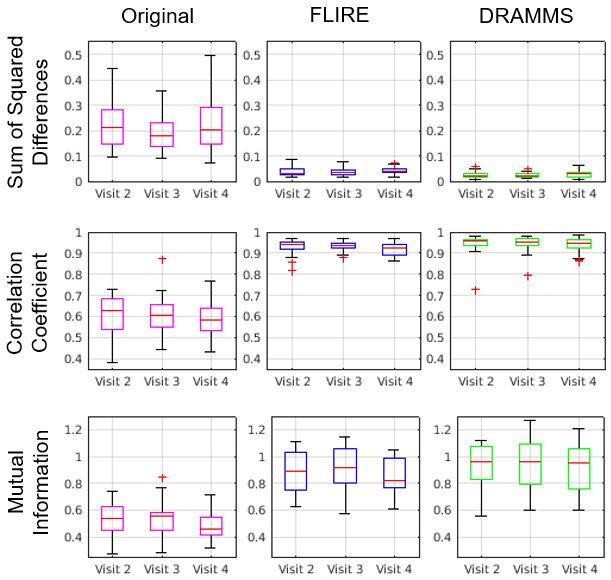
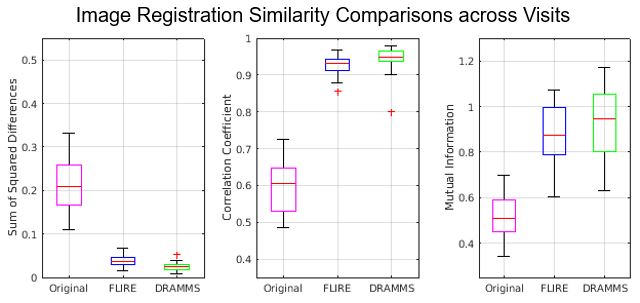
Representative images before and after registration with FLIRE and DRAMMS are shown in Figure 1. Both methods improved registration across time points based on a two way repeated measure ANOVA (p<0.05). No differences across visits were detected for SDD, CC and MI with either method (Figure 2). FLIRE image registration ran for approximately 5 minutes and DRAMMS with the fast option for 1.5-2 hours. When comparing registration performance, FLIRE improved the SSD (82.0%), CC (55.3%), and MI (70.3%). DRAMMS improved SSD (88.4%), CC (57.8%), and MI (80.6%) as well (Figure 3). The performance of DRAMMS was 6.4, 2.5, and 10.2% higher (p<0.05) compared to FLIRE in terms of SSD, CC, and MI, with a processing time of approximately 20 times longer than FLIRE.Discussion and Conclusions
This work demonstrated the feasibility of FLIRE to perform longitudinal registration of high-resolution breast MRI data with similar performance to the well-established DRAMMS software. Both methods performed similarly throughout the course of neoadjuvant chemotherapy and have the potential to assist quantifying longitudinal change in tumor volume. On average, FLIRE processing duration is significantly faster at 5 minutes compared to 1.5-2 hours for DRAMMS which is critical to facilitate clinical workflow at the time of interpretation. Although FLIRE has not yet been optimized for breast registration, there was only 6-10% variation in similarity measures between registration techniques. This study was an initial evaluation of the utility of FLIRE for breast image registration. Future studies include optimization of FLIRE parameters, potentially improving overall registration.Acknowledgements
California Breast Cancer Research Program, GE HealthcareReferences
[1] U.S. Cancer Statistics Working Group. U.S. Cancer Statistics Data Visualizations Tool, based on 2019 submission data (1999-2017): U.S. Department of Health and Human Services, Centers for Disease Control and Prevention and National Cancer Institute; www.cdc.gov/cancer/dataviz, released in June 2020.
[2] Manton DJ, Chaturvedi A, Hubbard A, et al. Neoadjuvant chemotherapy in breast cancer: early response prediction with quantitative MR imaging and spectroscopy. Br J Cancer. 2006 Feb 13;94(3):427-35. doi: 10.1038/sj.bjc.6602948. Erratum in: Br J Cancer. 2006 May 22;94(10):1544. PMID: 16465174; PMCID: PMC2361138.
[3] Jahani N, Cohen E, Hsieh MK, et al.: Prediction of Treatment Response to Neoadjuvant Chemotherapy for Breast Cancer via Early Changes in Tumor Heterogeneity Captured by DCE-MRI Registration. Sci Rep 9, 12114 (2019). doi: 10.1038/s41598-019-48465-x.
[4] Rakow-Penner R, Albino-Kroesing K, Abudu B et al.: Restriction Spectrum Imaging in Breast Cancer: Improved Evaluation of Response to Neoadjuvant Chemotherapy. International Society of Magnetic Resonance Medicine Honolulu, Hawaii, 2017.
[5] Guo Y, Sivaramakrishna R, Lu CC, Suri JS, Laxminarayan S: Breast image registration techniques: a survey. Med Biol Eng Comput. 2006 Mar;44(1-2):15-26. doi: 10.1007/s11517-005-0016-y. PMID: 16929917.
[6] Sivaramakrishna R: 3D breast image registration--a review. Technol Cancer Res Treat. 2005 Feb;4(1):39-48. doi: 10.1177/153303460500400106. PMID: 15649086.
[7] Li X, Dawant BM, Welch EB, et al.: A nonrigid registration algorithm for longitudinal breast MR images and the analysis of breast tumor response. Magn Reson Imaging. 2009 Nov;27(9):1258-70. doi: 10.1016/j.mri.2009.05.007. Epub 2009 Jun 13. PMID: 19525078; PMCID: PMC2763059.
[8] Mehrabian H, Richmond L, Lu Y, Martel AL: Deformable Registration for Longitudinal Breast MRI Screening. J Digit Imaging. 2018 Oct;31(5):718-726. doi: 10.1007/s10278-018-0063-1. PMID: 29654424; PMCID: PMC6148821.
[9] Ou Y, Weinstein SP, Conant EF et al.: Deformable registration for quantifying longitudinal tumor changes during neoadjuvant chemotherapy. Magn Reson Med. 2015 Jun;73(6):2343-56. doi: 10.1002/mrm.25368. Epub 2014 Jul 15. PMID: 25046843; PMCID: PMC5496099.
[10] Ou Y, Sotiras A, Paragios N, Davatzikos C.: DRAMMS: Deformable registration via attribute matching and mutual-saliency weighting. Med Image Anal. 2011 Aug;15(4):622-39. doi: 10.1016/j.media.2010.07.002. Epub 2010 Jul 17. PMID: 20688559; PMCID: PMC3012150.
Figures