1147
Triple negative breast cancer COX-2 expression distinctly alters spleen metabolism in immunocompromised mice compared to immunocompetent mice1The Johns Hopkins University School of Medicine, Baltimore, MD, United States
Synopsis
Cycloxygenase-2 (COX-2) is a pathological marker of high clinical relevance. COX-2 initiates the biosynthesis of inflammatory and immunosuppressive prostanoids to promote a hostile tumor microenvironment. Solid tumors rely on vital organs such as the spleen to survive, proliferate and evade immune recognition. We modulated breast cancer COX-2 expression to investigate the metabolic effects in the spleen of immunocompetent and immunocompromised mice. High resolution 1H magnetic resonance spectroscopy (MRS) was performed to identify changes in spleen metabolites. We observed distinct, COX-2-dependent increases in various metabolites in severe combined immunodeficient (SCID) mice compared to immunocompetent BALB/c mice.
Introduction
The inducible enzyme cyclooxygenase-2 (COX-2) catalyzes the conversion of arachidonic acid into proinflammatory mediators such as prostaglandins, thromboxanes and cytokines. COX-2 overexpression is frequently observed in human cancers and is considered a strong prognostic marker for poor clinical outcomes and cancer progression [1]. We generated genetically modified human triple negative breast cancer (TNBC) cells to overexpress COX-2 [2] and murine TNBC cells to silence COX-2 for the investigation of its role in promoting cancer aggressiveness. In previous studies, we discovered that COX-2 modulation alters choline phospholipid metabolism in breast cancer cells [3]. Using high resolution 1H magnetic resonance spectroscopy (MRS), we investigated the effects of silencing and overexpressing tumor COX-2 on spleen metabolism in severe combined immunodeficient (SCID) and immunocompetent BALB/c mice. In recent decades, the spleen has been shown to serve as a reservoir for immunosuppressive myeloid cells that support tumorigenesis and metastasis [4]. Understanding how tumor COX-2 expression affects the metabolic function of vital organs will expand our understanding of what shapes the tumor macroenvironment.Methods
We generated human triple negative SUM-149 cells stably overexpressing COX-2 (SUM-149-COX-2) or cells with an empty vector (SUM-149-EV) by cloning the COX-2 gene into an expression vector as previously reported [2]. Due to the high COX-2 expression of murine triple negative 4T1 cells, we established 4T1 cells with an empty vector (4T1-EV) and COX-2-silenced cells through shRNA-mediated gene silencing (4T1-COX2shRNA). The SUM-149-EV and SUM-149-COX-2 cells were inoculated in the mammary fat pad of SCID mice. We inoculated 4T1-wt (parental), 4T1-EV and 4T1-COX2shRNA cells in the mammary fat pad of BALB/c mice. Mouse organs were harvested once tumors reached an approximate volume of 500 mm3. Tumor COX-2 expression was then confirmed through western blot analysis. Subsequently, spleen samples were cryopulverized in liquid nitrogen followed by dual-phase extraction using methanol, chloroform and water. 1H MRS was performed on a Bruker Avance III 750 MHz (17.6T) MR spectrometer to identify water-soluble metabolites. Data acquisition was performed using a 5 mm inverse triple-resonance (TXI) probe. Topspin 3.5 software was used for data processing, analysis and quantification.Results
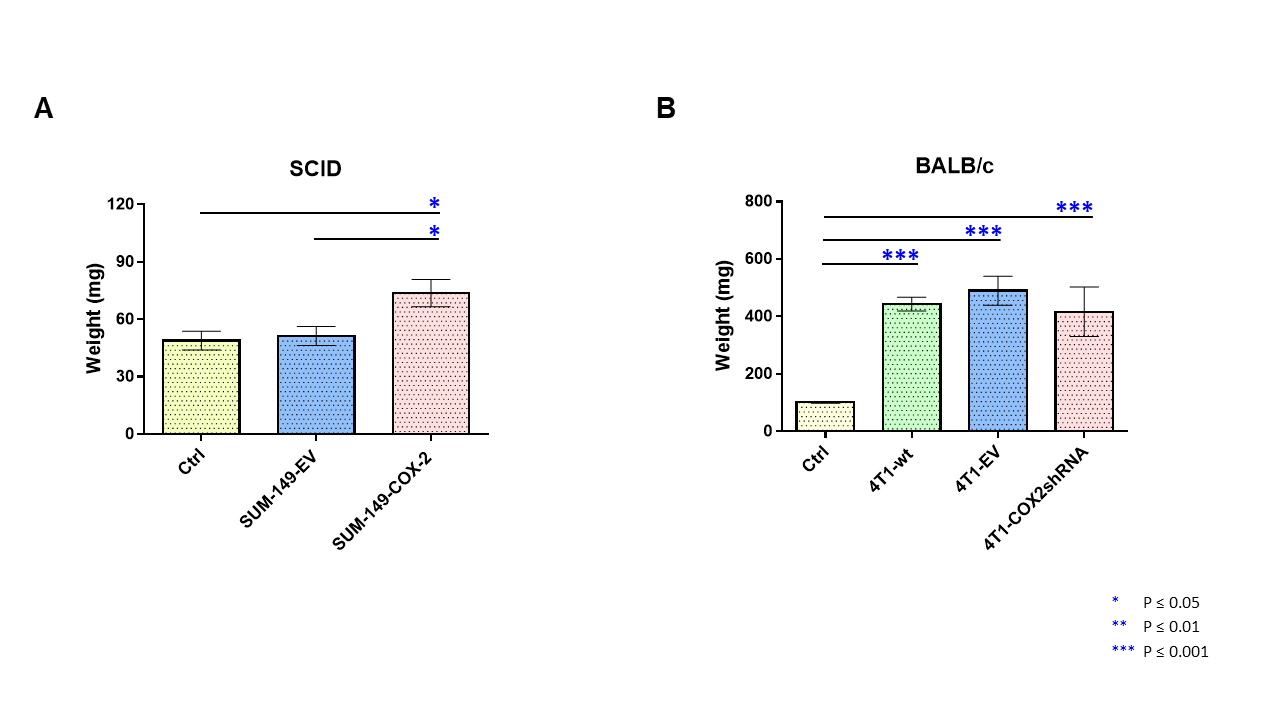
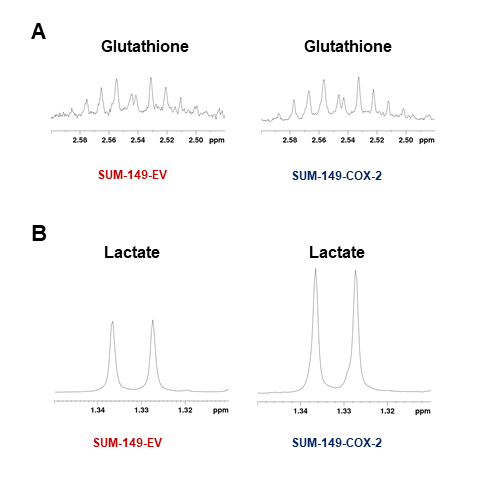
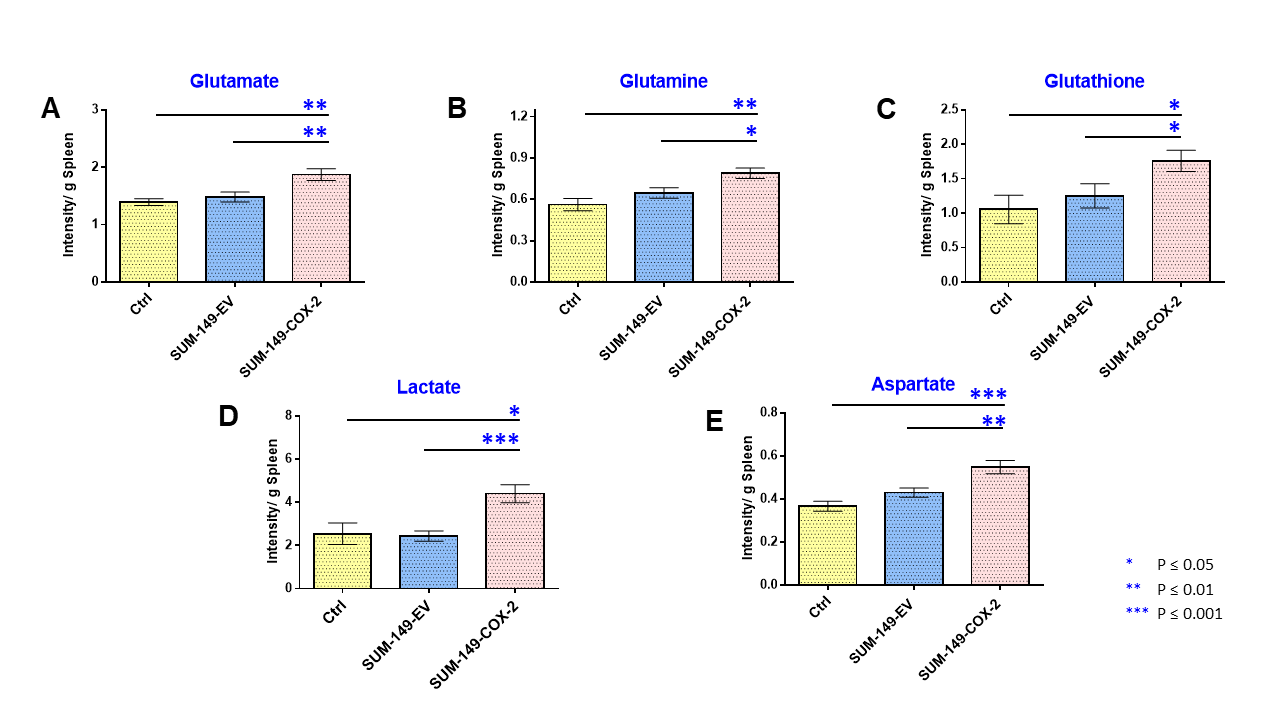
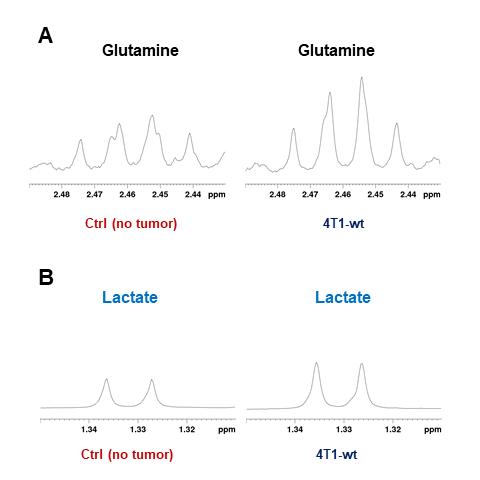
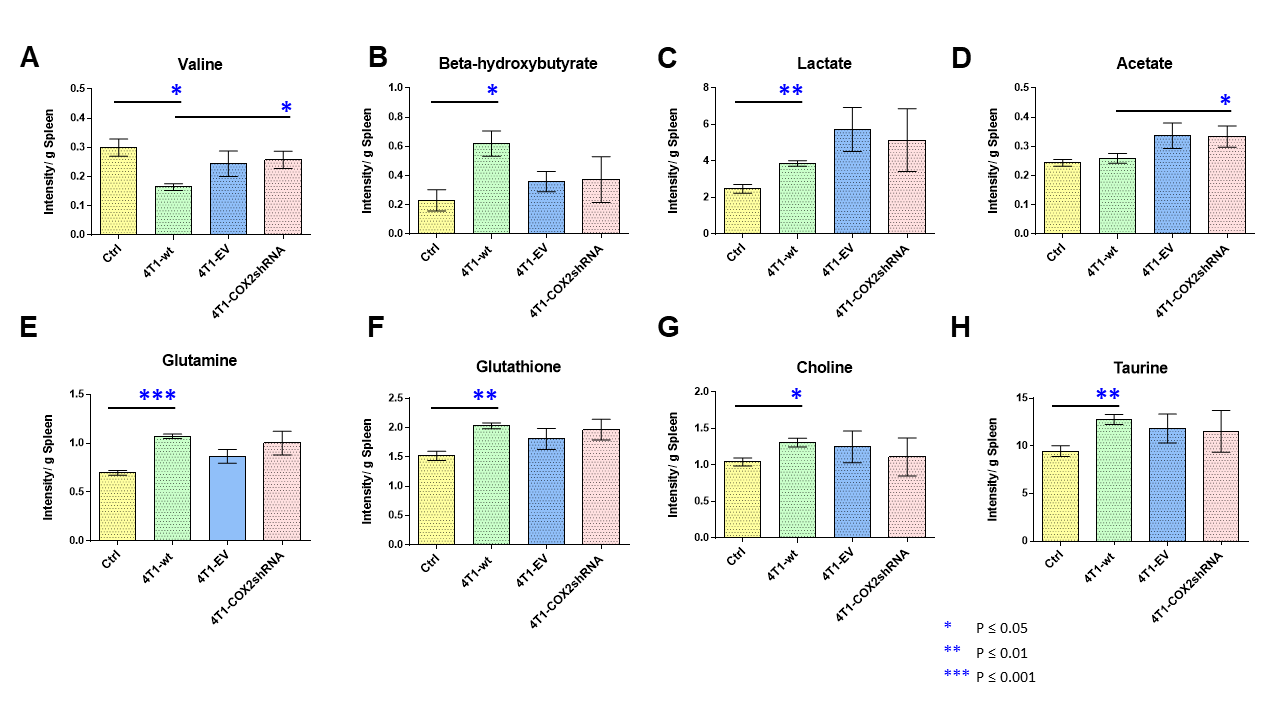
Data summarized in Figure 1 illustrate a COX-2-dependent increase in spleen weight in mice bearing SUM-149-COX-2 tumors in contrast to the 4T1-tumor-induced, COX-2-independent increase in spleen weight of BALB/c mice. Representative spleen 1H MR spectra obtained from a SUM-149-EV tumor-bearing mouse and a SUM-149-COX-2 tumor-bearing mouse are shown in Figure 2 for (A) the glutathione region and for (B) the lactate region. Spectral peak intensities normalized to SCID mouse spleen weight are presented in Figure 3 from the non-tumor-bearing control, SUM-149-EV and SUM-149-COX-2 groups illustrated respectively for (A) glutamate, (B) glutamine, (C) glutathione, (D) lactate and (E) aspartate. Figure 4 shows (A) the glutamine region and (B) the lactate region of representative 1H MR spectra obtained from the spleen of a non-tumor-bearing BALB/c mouse and a 4T1-tumor-bearing mouse. Intensity quantifications normalized to BALB/c mouse spleen weight from non-tumor-bearing control, 4T1-wt, 4T1-EV and 4T1-COX2shRNA groups are illustrated in Figure 5 respectively for (A) valine, (B) beta-hydroxybutyrate, (C) lactate, (D) acetate, (E) glutamine, (F) glutathione, (G) choline and (H) taurine.Discussion
We identified a significant increase in lactate, glutamine, glutamate, glutathione and aspartate in the spleens of SUM-149-COX-2-bearing SCID mice. These metabolic changes were accompanied by a profound COX-2-dependent increase in spleen weight compared to the control and SUM-149-EV groups. Statistically significant metabolic changes in valine, beta-hydroxybutyrate, lactate, glutamine, glutathione, choline and taurine were observed in mice bearing 4T1-wt tumors compared to non-tumor-bearing controls, and splenomegaly was observed independent of COX-2 expression. Our data suggest that the tumor secretome, in the presence or absence of COX-2, may potentially contribute through effects on the spleen, to poor survival associated with cancers. These findings can be applied to the development of metabolic strategies to improve patient quality of life.Acknowledgements
Supported by NIH R01CA193365 and R35CA209960.References
1. Hoellen F et al., Anticancer research. 2011;31(12):4359-67.
2. Krishnamachary B et al., Oncotarget. 2017;8(11):17981-94.
3. Shah T et al., NMR in Biomedicine. 2012;25(5):746-54. 21953546.
4. Wu, C et al., Front Immunol. 2020
Figures