1145
High spatial and temporal resolution breast DCE-MRI using MOCCO reconstruction for quantitative PK analysis
Ping N Wang1, Julia V Velikina2, Leah C Henze Bancroft2, Alexey A Samsonov2, Frederick Felcz2, Roberta M Strigel1,2,3, and James H Holmes2
1Department of Medical Physics, University of Wisconsin-Madison, Madison, WI, United States, 2Department of Radiology, University of Wisconsin-Madison, Madison, WI, United States, 3Carbone Cancer Center, University of Wisconsin-Madison, Madison, WI, United States
1Department of Medical Physics, University of Wisconsin-Madison, Madison, WI, United States, 2Department of Radiology, University of Wisconsin-Madison, Madison, WI, United States, 3Carbone Cancer Center, University of Wisconsin-Madison, Madison, WI, United States
Synopsis
Radial acquisition with MOCCO reconstruction has been proposed for high spatial and temporal resolution breast DCE imaging. However, the performance of the method has not been evaluated across a wide range of temporal enhancement curves. In this work, we use a breast digital reference object with the ability to provide a wide range of lesion contrast kinetics using the extended Tofts model for pharmacokinetic simulation. A voxel-by-voxel quantitative analysis was applied and compared with the ground truth.
Introduction
Dynamic contrast-enhanced (DCE) MRI provides the most reliable method for following a known breast cancer to confirm its response to therapy due to its ability to reveal the contrast difference between tumors and normal tissues. Because of this property, DCE-MRI has been investigated as a powerful tool for treatment planning1, screening2 and treatment response assessment3. The lesion curves measured from conventional DCE-MRI with high spatial resolution but low temporal resolution imaging protocols can provide only moderate specificity to characterize different lesion types4. Quantitative pharmacokinetic (PK) modeling of DCE-MRI has shown promise to provide additional non-invasive evidence for differentiating benign and malignant lesions5. However, the current breast DCE-MRI strategies are known to be insufficient to fully capture rapidly changing contrast kinetics at high spatial resolution during bi-lateral assessment. Studies have shown the potential of high spatial-temporal resolution breast MR imaging by using stack-of-stars radial acquisition with compressed sensing (CS) reconstruction6. Previous work has shown that using a data-driven low-rank based CS method (MOCCO) demonstrated improved temporal fidelity when matching spatial resolution and coverage from routine clinical protocols as compared with CS with total variation7. However, there is a need to validate the accuracy and robustness of PK parameter estimation using advanced acquisition and/or reconstruction if these approaches are to be used in clinical practice. Therefore, the purpose of this study is to assess the performance of radial acquisition with MOCCO reconstruction for PK assessment across a wide range of parameter values in the setting of a digital reference object (DRO) for breast DCE MRI.Methods
Simulations: Time-resolved radial data was simulated using a DRO to model an acquisition using a 16-channel breast coil with bilateral axial breast MRI protocol (TR/TE= 5.5/2.4 ms, FOV= 340 x 340 mm, 448x448 in-plane matrix, 142 z-phase encodes) (Fig. 1). Homogeneously enhancing round lesions were simulated with different PK parameters to generate slow, intermediate, and fast changing lesion kinetics. Specific values of Ktrans, Ve and the corresponding curve shapes are listed in Table 1.Reconstruction: The low-rank data-driven temporal model for MOCCO8,9 was obtained from the low frequency region of the fully-sampled central k-space data using progressive learning with cubic spline approximation9,10 followed by complex independent component analysis11. The undersampled data were reconstructed at 5 s temporal resolution, corresponding to 8 projections/frame (undersampling factor R=88) using MOCCO.
Analysis: PK modeling was performed by fitting the curves to the extended Tofts model (ETM)12,13 using an in-house implementation of the Levenberg-Marquaradt algorithm to assess the ability to fit and recover specific kinetic parameters.
Results
In the case of slow, and intermediate lesion kinetic curves (Figure 2, A-C), the lesion kinetics can be accurately recovered using MOCCO reconstruction. In the case of fast lesion kinetics (Figure 2, D-H), a decrease in the wash-in slope was observed when the Ktrans value increased. Further, the MOCCO reconstruction showed underestimation of the maximum peak intensity when Ktrans was larger than 1 min-1 (Figure 2, F-H). Figure 3 presents both the mean and standard deviation (SD) of the % difference between fitted parameters and ground truth. The accuracy and precision of the fitted parameters are well within ±15% for slow, intermediate, and fast lesion kinetics with Ktrans < 1 min-1. For fast kinetic curves with Ktrans > 1 min-1, the underestimation of Ktrans and Ve were increased because the larger Ktrans value yields rapidly changing curve shapes. Although MOCCO reconstruction showed high underestimation at fast lesion kinetic curves, the measurements were still highly correlated (r = 0.995) (Figure 3, B). Figure 4 displays color maps of the estimated and the associated errors expressed in % difference to known truth values, where the greatest error most frequently occurred for voxels on the edge of the lesion.Discussion and conclusions
In this study, we evaluated the robustness of the MOCCO reconstruction to recover different DCE curve shapes in the setting of a DRO with the ETM. A 5 second temporal resolution and 0.75mm x 0.75mm spatial resolution was demonstrated and is expected to be well suited to the demands of bilateral breast DCE-MRI. The simulated results indicated that MOCCO reconstruction ensures less than 15% error in Ktrans and Ve when Ktrans < 1 min-1 and Ve = 0.3, which is within the reasonable physiological ranges. Underestimation of Ktrans was found in fast lesion contrast curves, but MOCCO reconstruction still showed the ability to capture rapidly enhancing lesion characteristics. However, some evidence of spatial-temporal blurring was observed in the voxels at junctions between high-intensity lesion and low-contrast tissue, which introduced the estimation error into the PK parameters and will be the focus of future work. Although the ETM was used in this study due to its wide usage in the literature, alternative PK models can readily be used in the simulation pipeline.Acknowledgements
The authors wish to acknowledge support from the following NIH grants: R21EB018483, R01EB027087, P30CA014520, and R01CA248192. As well as support from GE Healthcare, the RSNA Research and Education Foundation, and a Research and Development Grant from the Departments of Radiology and Medical Physics, University of Wisconsin-Madison.References
- Garimella V, Qutob O, Fox JN, Long ED, Chaturvedi A, Turnbull LW, Drew PJ. Recurrence rates after DCE-MRI image guided planning for breast-conserving surgery following neoadjuvant chemotherapy for locally advanced breast cancer patients. European Journal of Surgical Oncology (EJSO). 2007;33(2):157–161. doi:10.1016/j.ejso.2006.09.019
- Mann RM, Mus RD, van Zelst J, Geppert C, Karssemeijer N, Platel B. A Novel Approach to Contrast-Enhanced Breast Magnetic Resonance Imaging for Screening: High-Resolution Ultrafast Dynamic Imaging. Investigative Radiology. 2014;49(9):579–585. doi:10.1097/RLI.0000000000000057
- Wang C-H, Yin F-F, Horton J, Chang Z. Review of treatment assessment using DCE-MRI in breast cancer radiation therapy. World Journal of Methodology. 2014;4(2):46–58. doi:10.5662/wjm.v4.i2.46
- Kuhl CK, Schild HH, Morakkabati N. Dynamic Bilateral Contrast-enhanced MR Imaging of the Breast: Trade-off between Spatial and Temporal Resolution. Radiology. 2005;236(3):789–800. doi:10.1148/radiol.2363040811
- Furman-Haran E, Schechtman E, Kelcz F, Kirshenbaum K, Degani H. Magnetic resonance imaging reveals functional diversity of the vasculature in benign and malignant breast lesions. Cancer. 2005;104(4):708–718. doi:10.1002/cncr.21225
- Kim SG, Feng L, Grimm R, Freed M, Block KT, Sodickson DK, Moy L, Otazo R. Influence of temporal regularization and radial undersampling factor on compressed sensing reconstruction in dynamic contrast enhanced MRI of the breast: Temporal Regularization and Radial Undersampling Effects on DCE-MRI. Journal of Magnetic Resonance Imaging. 2016;43(1):261–269. doi:10.1002/jmri.24961
- Wang PN, Velikina JV, Strigel RM, Henze Bancroft LC, Samsonov AA, Cashen TA, Wang K, Kelcz F, Johnson KM, Korosec FR, Ersoz A, Holmes JH. Comparison of data-driven and general temporal constraints on compressed sensing for breast DCE MRI. Magn Reson Med. 2020 Dec 11. doi: 10.1002/mrm.28628. Epub ahead of print. PMID: 33306217.
- Velikina JV, Samsonov AA. Reconstruction of dynamic image series from undersampled MRI data using data-driven model consistency condition (MOCCO). Magnetic Resonance in Medicine. 2015;74(5):1279–1290. doi:10.1002/mrm.25513
- Velikina J, Alexander A, Salmons J, Raimy E, Purnell T, Kecskemeti S, Samsonov A. Ultrafast Speech Imaging at High Spatial Resolution using Model-Consistency Condition Reconstruction with Progressive Temporal Basis Learning. Proceedings of the 26th ISMRM Scientific Meeting 2018. 2018 Paris France. https://cds.ismrm.org/protected/18MPresentations/abstracts/0245.html
- Boor C de. A Practical Guide to Splines. In: Applied Mathematical Sciences. 1978. doi:10.1007/978-1-4612-6333-3
- Novey M, Adali T. On Extending the Complex FastICA Algorithm to Noncircular Sources. IEEE Transactions on Signal Processing. 2008;56(5):2148–2154. doi:10.1109/TSP.2007.911278
- Tofts PS. Modeling tracer kinetics in dynamic Gd-DTPA MR imaging. Journal of Magnetic Resonance Imaging. 1997;7(1):91–101. doi:https://doi.org/10.1002/jmri.1880070113
- Sourbron SP, Buckley DL. On the scope and interpretation of the Tofts models for DCE-MRI. Magnetic Resonance in Medicine. 2011;66(3):735–745. doi:10.1002/mrm.22861
Figures
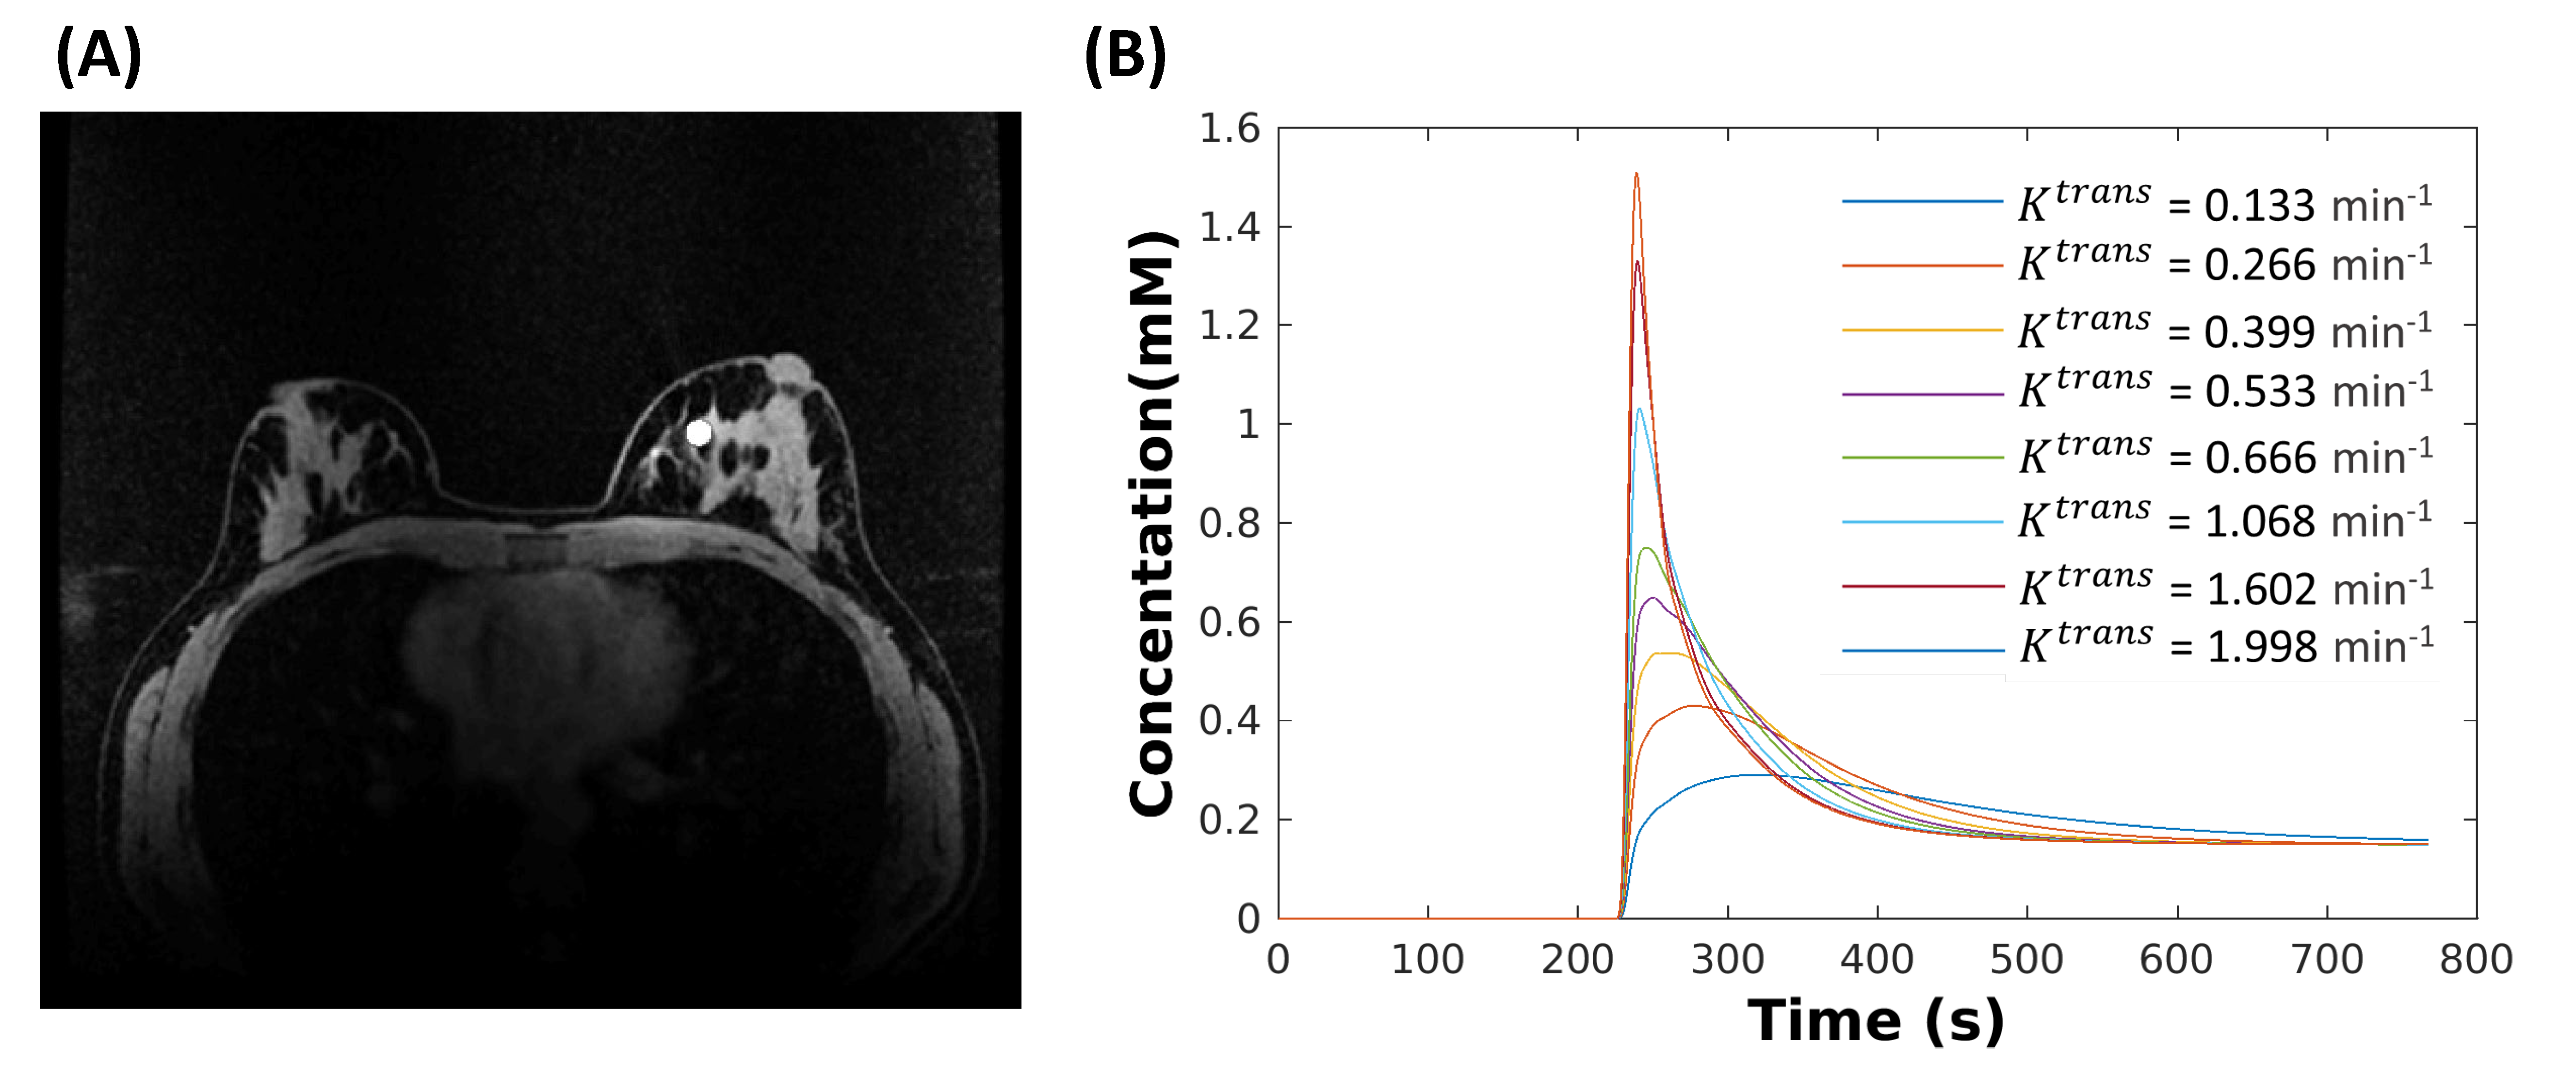
Figure 1. Breast DRO (matrix size 448x448x142) is shown with one
lesion located in the fibroglandular tissue (A). The simulation was performed
eight times with the same 10 mm lesion but with different contrast kinetics
generated by assigning the Ve = 0.3, Vp = 0, and Ktrans
ranging from 0.133 to 1.998 from the ETM (B), respectively.
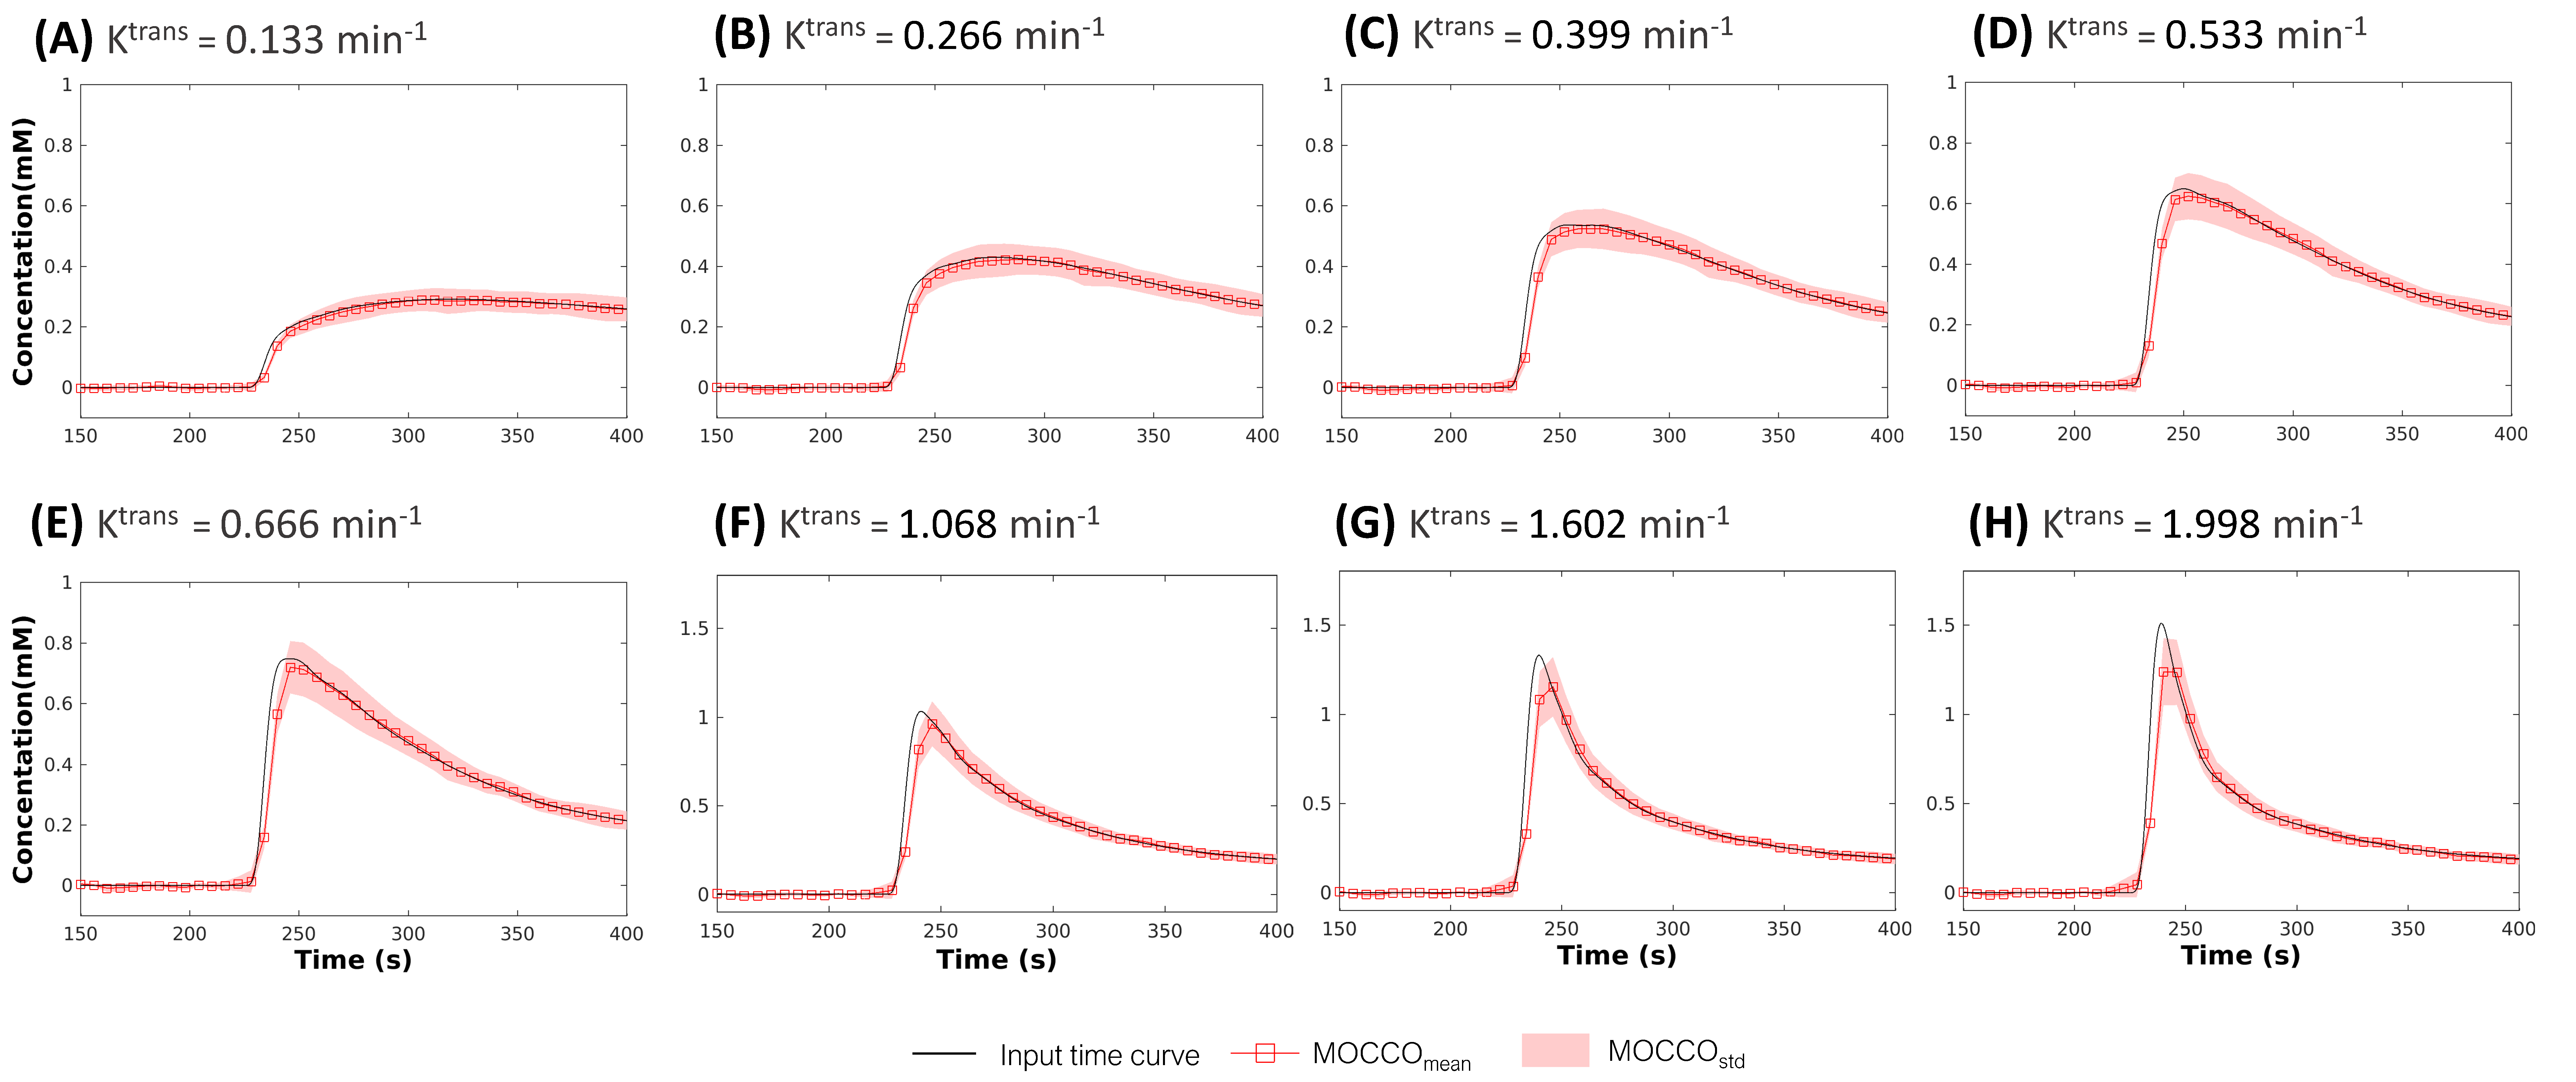
Figure 2: Simulated contrast agent concentration uptake
curves (displayed for a subset of time from 150 s to 400 s). Mean concentration
for eight lesions with varying pharmacokinetics reconstructed using MOCCO (A-H,
red squares). Standard deviations are shown with banded areas. The input time
curves (“truth”) used to generate the source data are plotted in black for all
frames.
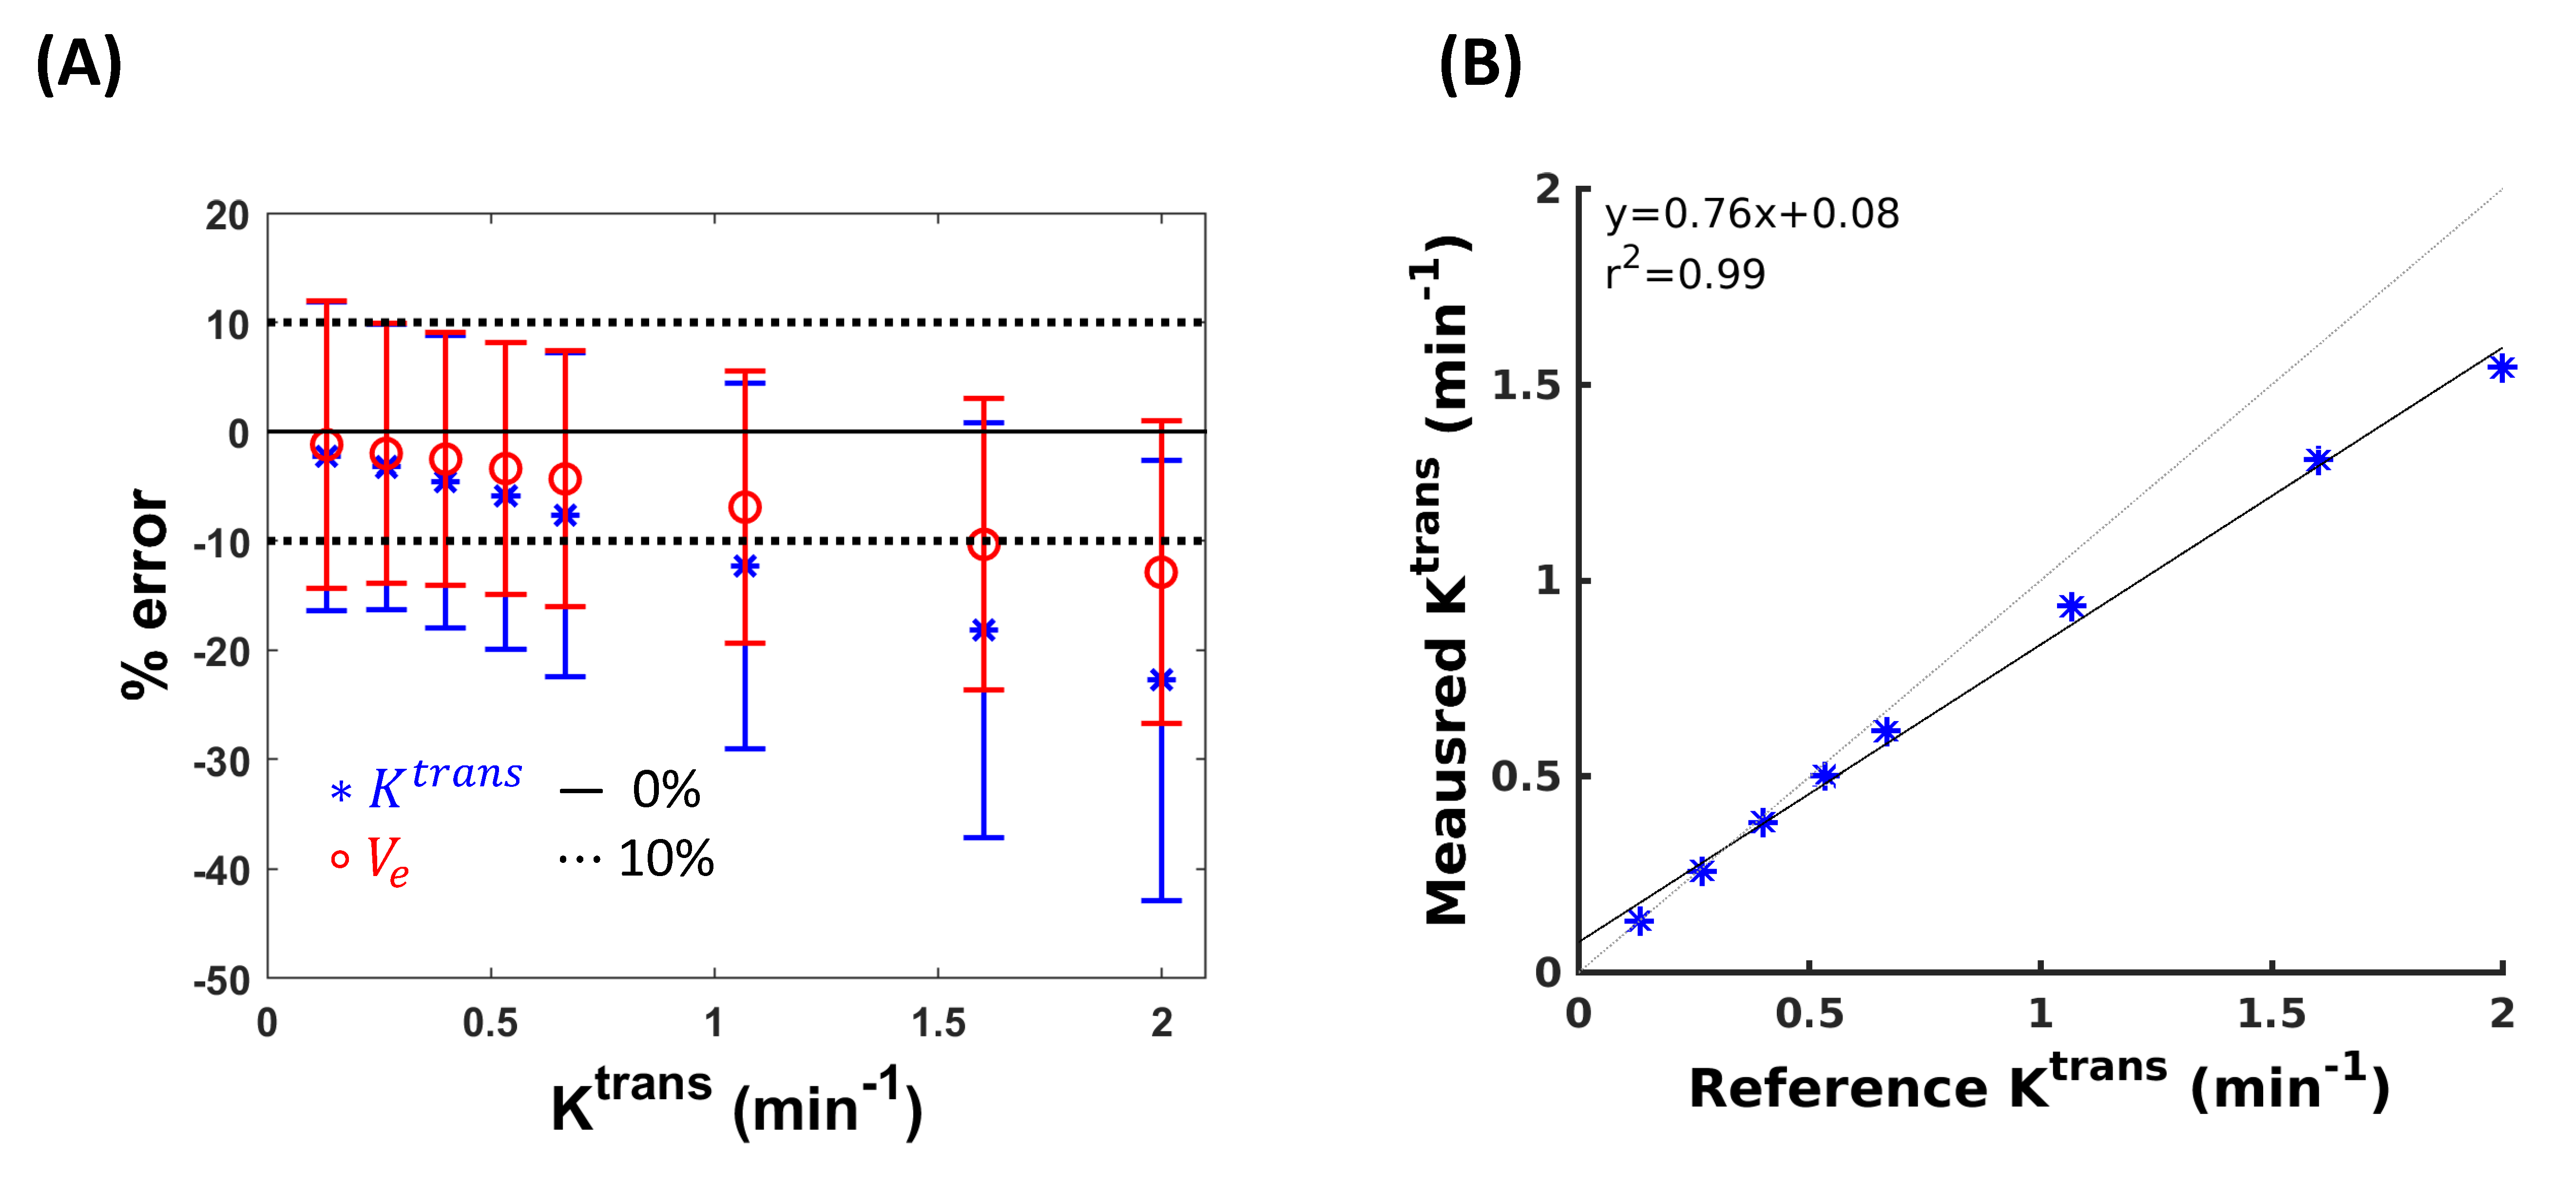
Figure 3: The influence of MOCCO reconstruction on parameter
estimation of Ktrans and Ve. Bland-Altman plot (A) for mean
(±
standard deviation) of Ktrans (blue stars) and Ve (red circles) and the corresponding
scatter plot (B) for mean of Ktrans.
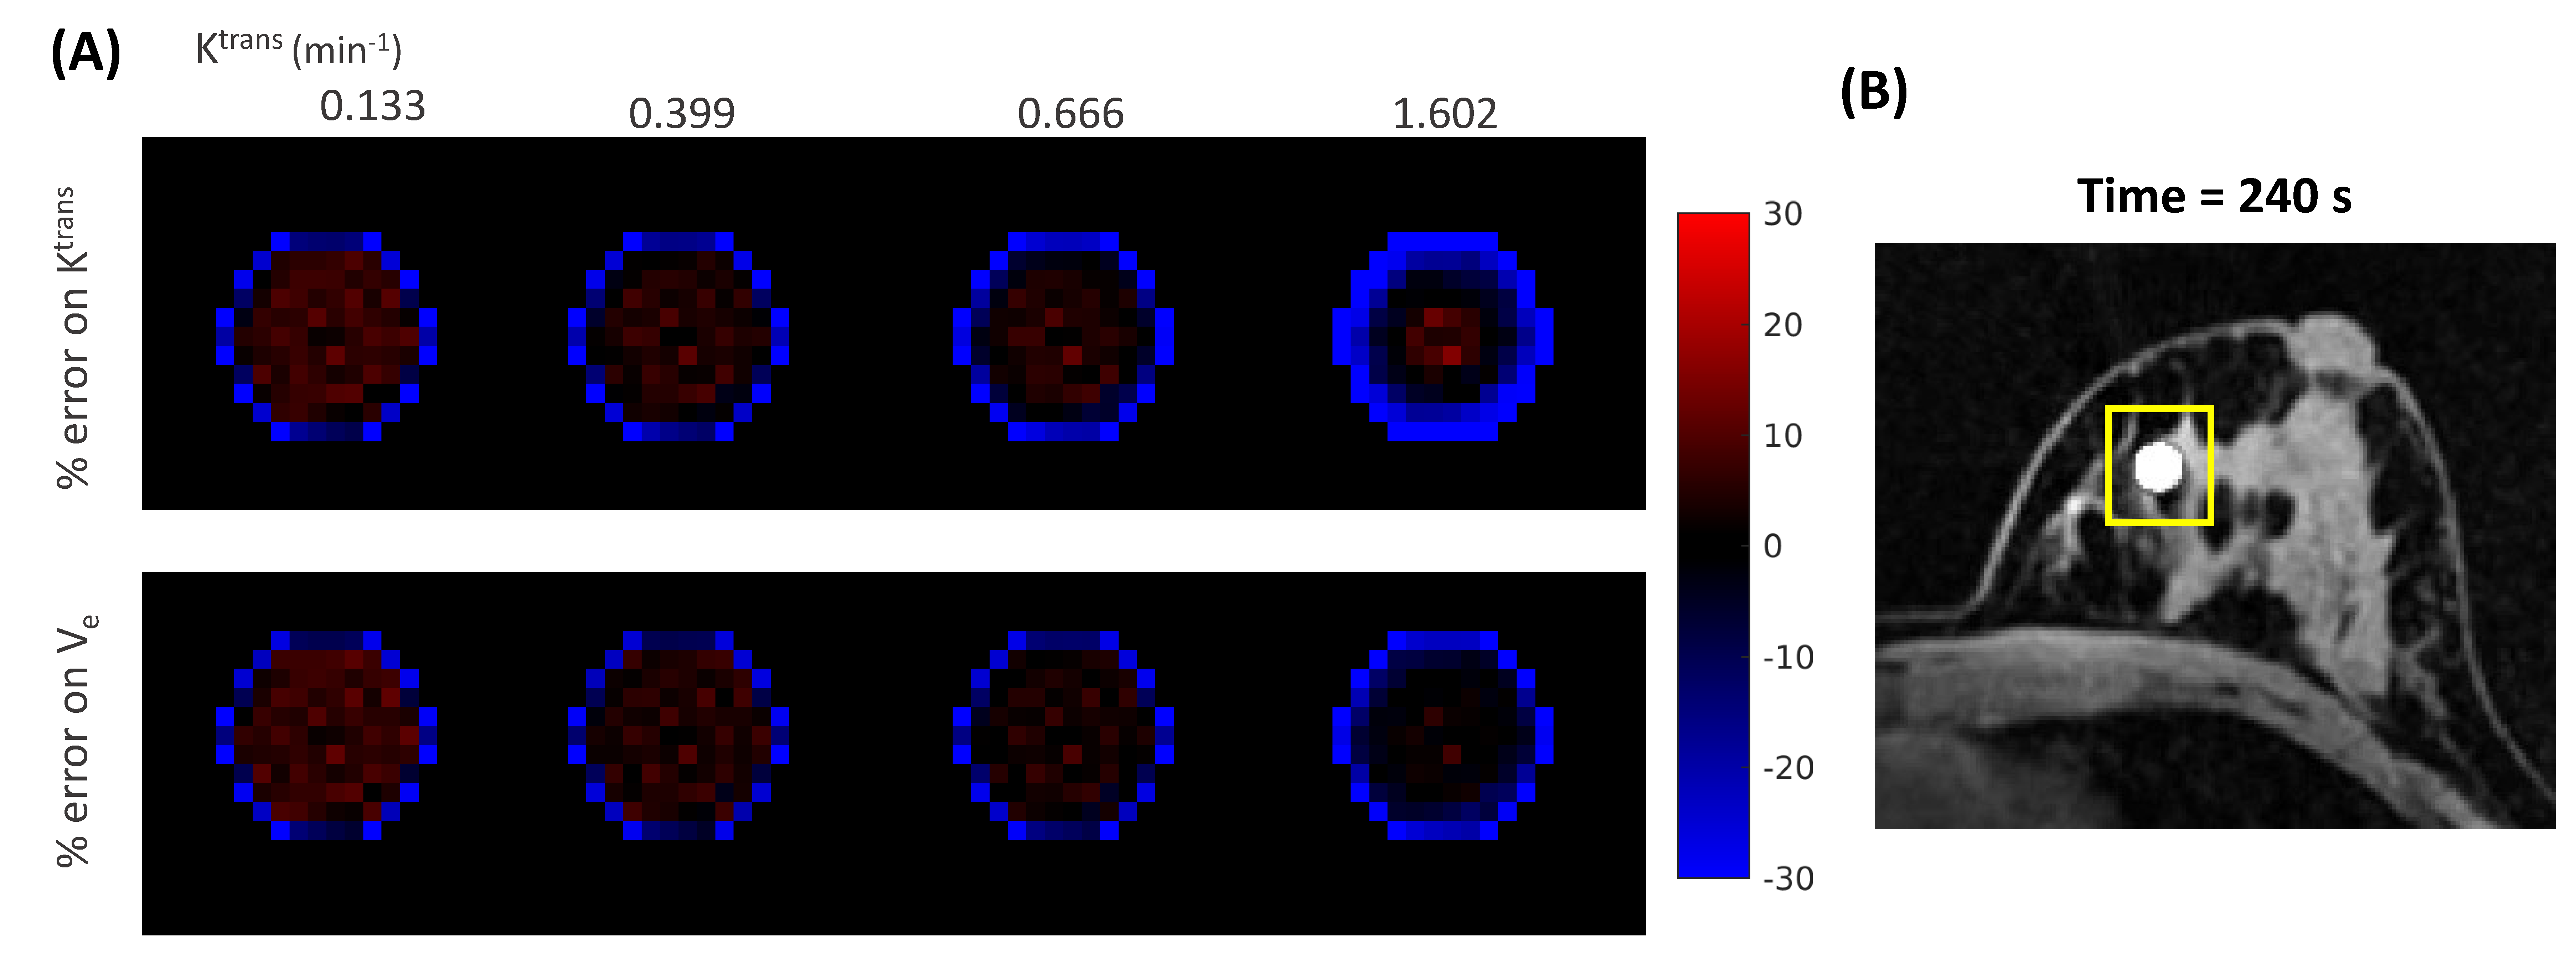
Figure 4. Visualization of error maps of (A) Ktrans
= 0.133, 0.399, 0.666, 1.602 min-1
and Ve = 0.3 obtained by measuring the % differences between
the fitted parameters and the true values (% error) for the lesion region depicted
in (B). Red and blue represent the level of overestimation and underestimation,
respectively.
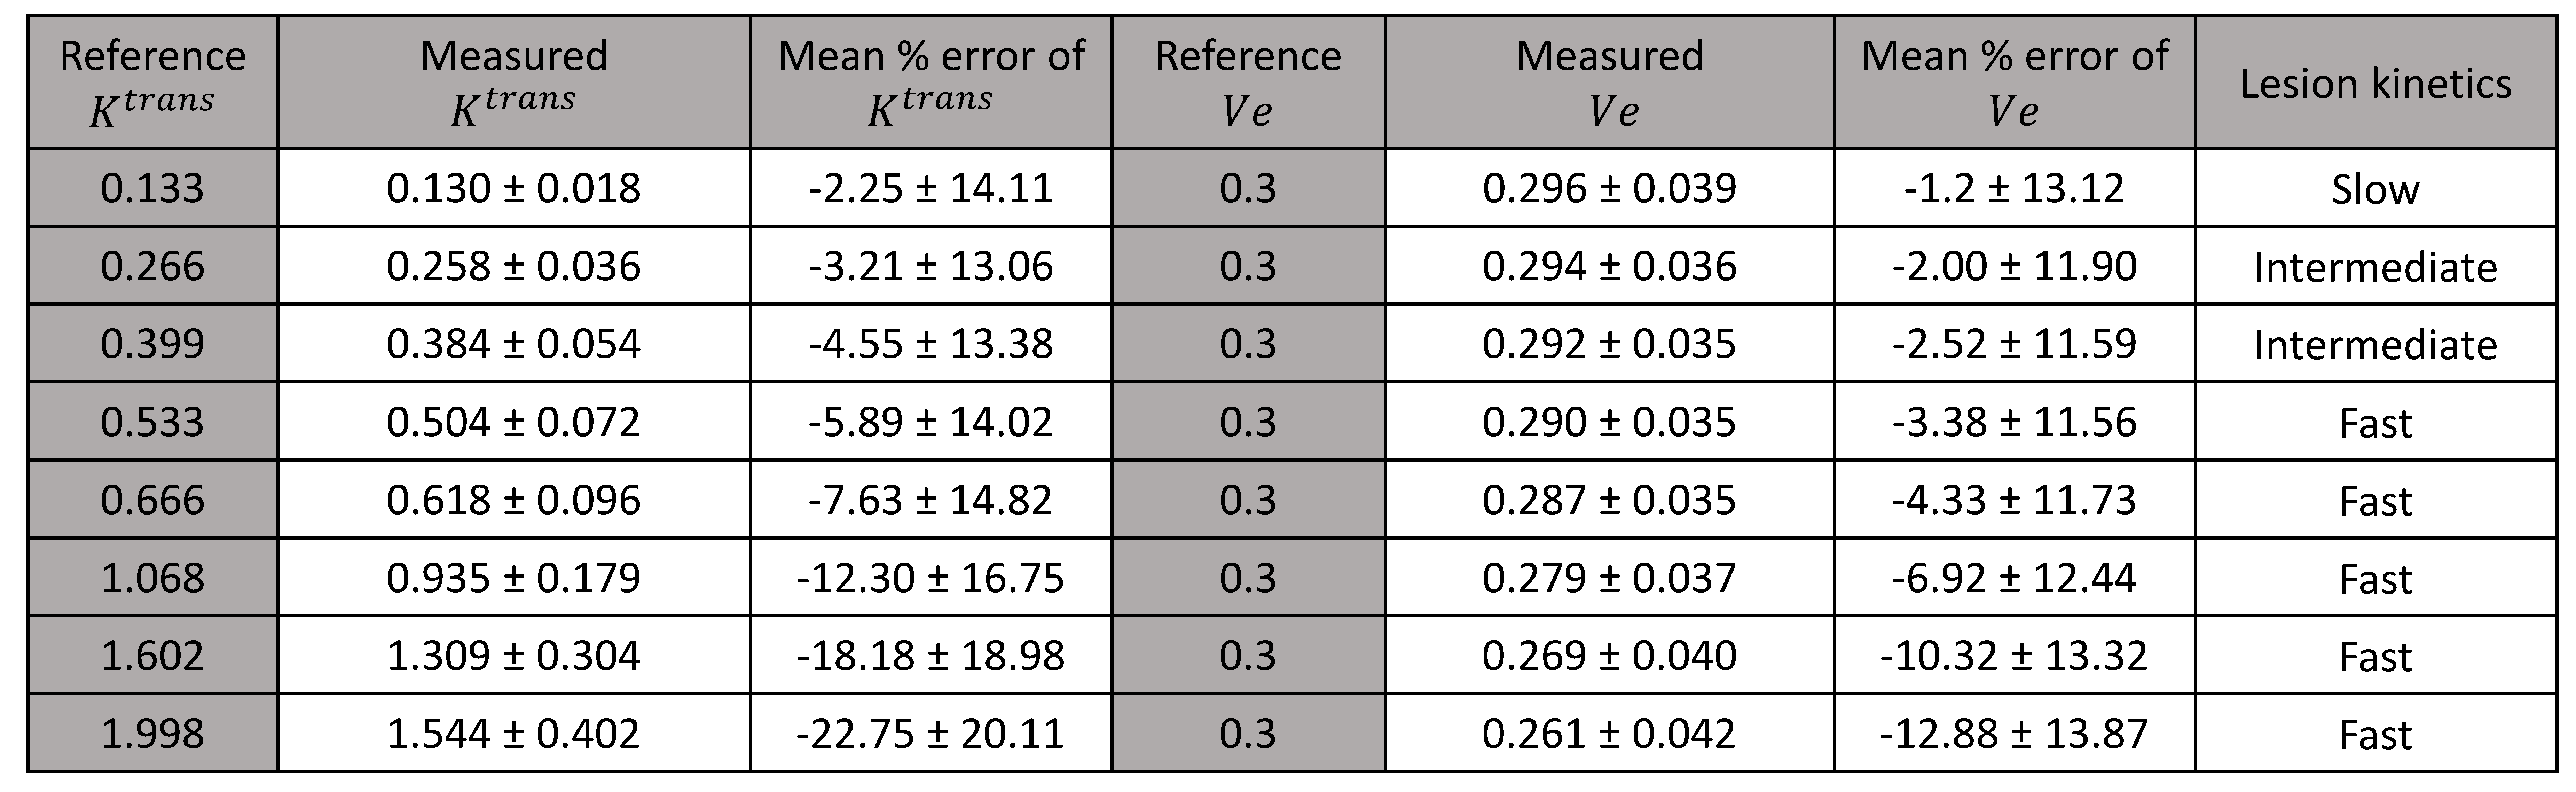
Table 1: Summary of results and % errors from PK model fitting
to the reconstruction results.