1142
Multisite generalizability comparison of Dynamic Contrast Enhanced Breast MRI Breast Cancer Recurrence Score Models at multiple scales
Michael Liu1, Richard Ha1, Terry Button2, Yucheng Liu1, Yun-Hsu Hao3, and Sachin Jambawalikar1
1Radiology, Columbia University, New York, NY, United States, 2Stonybrook University, Stonybrook, NY, United States, 3Columbia University, New York, NY, United States
1Radiology, Columbia University, New York, NY, United States, 2Stonybrook University, Stonybrook, NY, United States, 3Columbia University, New York, NY, United States
Synopsis
Multisite Breast Dynamic Contrast Enhanced MRI based Oncotype DX score models benefit from multiscale sampling
Introduction
Oncotype DX(ODX) Breast Recurrence score uses reverse transcriptase polymerase chain reaction (RT-PCR) to detect the expression of 16 cancer related genes to calculate a recurrence score used to guide clinical decisions regarding the potential benefits of chemotherapy.Convolutional Neural Networks (CNNs) have been used to model ODX scores in breast cancers examined with Gadolinium Dynamic Contrast Enhanced MRI across a single institution.1 The generalizability of models to predict ODX recurrence risk across multiple institutions with different MRI hardware and software as well as different patient populations is evaluated here. Since ODX scores are evaluated from biopsy specimen, localized context of the biopsied area are studied at various scales to determine the contribution of surrounding anatomy on model accuracy.
Methods
Patients411 patients who had received both DCE-MRI studies as well as ODX Recurrence score evaluation on from 4 sites were analyzed in this IRB approved retrospective study. Patients were scanned with a dedicated multichannel breast receive coil or a shoulder receive coil in 1.5T (301) and 3T(110) MRI machines from Siemens (42), General Electric Medical (264), and Philips (105). The MRI examination included a dynamic contrast enhanced 3D T1 weighted SPGR sequence before and after receiving an injection of a gadolinium based contrast agent. Scans were acquired in both the sagittal and axial plane over one or both breasts. Ranges of acquisition parameters are included: Field of View (FOV) AP 18-36 cm, FOV LR 18-36 cm, FOV SI 18-36 cm, Repetition time Time 3.63-8.67 ms, Echo Time 1.1-4.25, matrix 224fzx192ph, slice thickness 1-3.6. Temporal resolution 1:03 - 2:00). A total of 344 exams were used in this study.
A supervised ODX CNN model trained is with the DCE-MRI data and the ground truth ODX scores. We evaluate recurrence risk based on the clinical implications of the ODX test, namely that an ODX score<18 indicates low risk of recurrence and a score score >=18 indicates moderate to high risk. The network used is a Residual Net 101 layer CNN.
Data Gathering and Splitting
Sagittally reformatted slices of the first three phases of DCE-MRI are reshaped and stacked in the third dimension to form 256x256x3 matrices. Data is normalized by dividing by the highest individual signal intensity in the exam.
Data Labeling
Slices containing biopsy site are identified and verified by a fellowship trained radiologist. These slices containing the biopsy site are used as inputs into the Recurrence score model.
Convolutional Neural Network Model
The CNN uses a standard Resnet 101 backbone with a softmax classifier. optimized with RMSProp at learning rate 0.001 with 0.1 decay after 3 epochs of plateau loss with batch size of 300.
Data Augmentation
In addition to standard affine transformations, random hue transforms are applied to simulate the variable phase and injection timings at different institutions. These hue transforms can also be interpreted as added noise in the pharmatokinetic curves.
Input data is also augmented with random patches upsampled with splines to the native input resolution of 256x256 introducing variables scales of imaging. This variable scale measures the impact of spatial context in the model's accuracy.
Evaluation
Patients in the leave one out test set are evaluated by a majority vote methodology. Each of the sagittal slices is individually evaluated by the network and the majority prediction is compared against the ground truth. The average probabilities of low score and medium to high score are used to generate the ROC curves. Average and standard deviation statistics are generated for 5 fold ROC curves.
Results
The following are the results from the variable patch sampling methodology and its impact on Sensitivity, Specificity, Accuracy and AUC performance metrics.112x112 effective patches Sensitivity 19.7± 9.9, Specificity 94.6 ± 3.1, Accuracy 62.6 ± 5.1, AUC 0.61 ±0.06.
56x56 effective patches Sensitivity 27.9 ± 13.0, Specificity 90.6 ± 7.9, Accuracy 64.6 ± 4.0, AUC 0.63 ±0.05.
28x28 effective patches Sensitivity 34.7± 16.5, Specificity 89.4 ± 8.3, Accuracy 66.5 ± 9.0, AUC 0.65 ±0.04.
14x14 effective patches Sensitivity 23.7± 13.0, Specificity 93.2 ± 4.0, Accuracy 63.4 ± 6.1, AUC 0.63 ±0.04.
Discussion
With the incorporation of dynamic data into the channel dimension, the model incorporates tumor kinetics into its decision making. The parallel hue and saturation based data augmentation jitters the data for better generalizability to sites with varied acquisition hardware and protocol parameters. The data used in this study are sourced from many institutions using hardware from the three major MR vendors at the two most common field strengths and extremely inhomogenous acquisition parameters, with both axial and sagittal acquisitions, unilateral and bilateral fields of view, and varied acquisition voxel dimensions.The increase of performance metrics with the incorporation of smaller effective patches suggests that tailored data is more helpful than whole slice information. The slight decrease in performance when patches become too small, 14x14 pixels in this case, suggests that there there is an inflection point in performance gains and that some context is needed for better model performance.When compared to single site performance1 which achieved 87% sensitivity, 81% specificity, and 84% accuracy, performance is significantly degraded, but expected given the heterogeneity of training and testing data.
Acknowledgements
No acknowledgement found.References
1. R Ha, P Chang, S Mutasa, J Karcich, S Goodman, E Blum, K Kalinsky, MZ Liu, S Jambawalikar "Convolutional neural network using a breast MRI tumor dataset can predict oncotype Dx recurrence score." Journal of Magnetic Resonance Imaging 49 (2019), 518-524
Figures
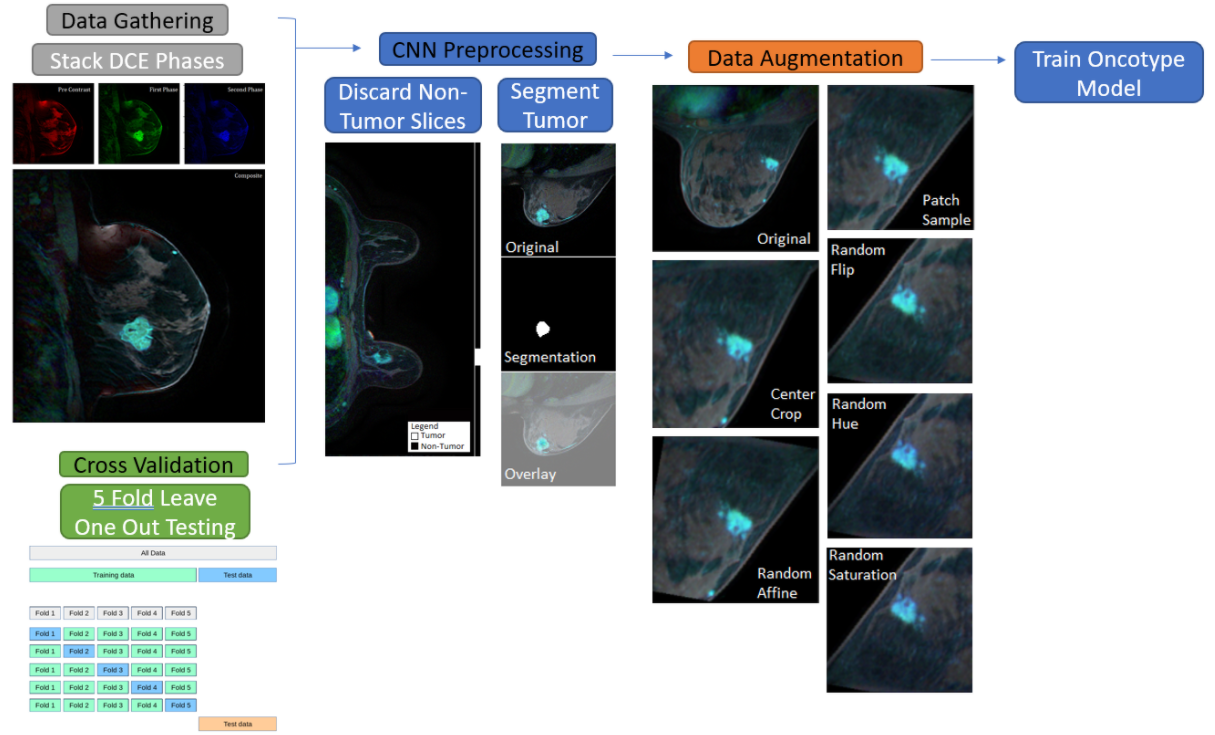
This chart illustrates the flow of data into the network.
1) The first three phases of each DCE Exam are gathered and stacked in the 4th dimension.
2) Slices containing the biopsy site are then isolated and annotated.
3) Before introduction to the model, the data is exposed to different scales of patch sampling, Hue shifts, and standard affine transforms.
4) The network is trained using 5 fold cross validation with leave one out testing
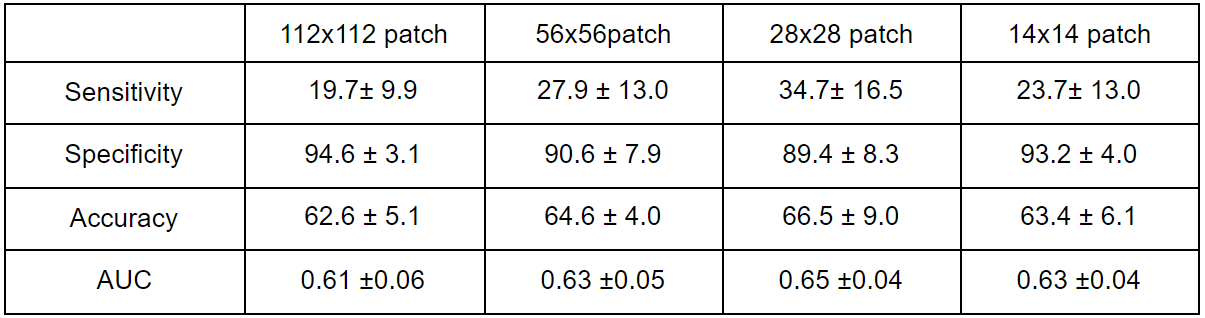
Performance Statistics for various sampling techniques