1141
The Performance of Breast Diffusion Tensor Imaging in the Evaluation of Pre-Surgical Treatment of Breast Cancer.1Medical Imaging, University of Toronto, Toronto, ON, Canada, 2Weizmann Institute of Science, Rehovot, Israel, 3Department of Radiology, St Joseph's Healthcare. McMaster University, Hamilton, ON, Canada, 4DDE MRI Solutions Ltd., Tel Aviv, Israel
Synopsis
Response to breast neoadjuvant systemic therapy (NAST) was longitudinaly monitored with Diffustion Tensor Imaging (DTI) pre and post therapy and evaluated in reference to post surgery histopatholgy results. A correlation was demonstrated between DTI residual tumor size and pathology size. Response in the various breast cancer subtypes was revealed by increased λ 1 values validated by a correlation with the pathological residual disease. DTI detected pCR in all breast subtypes with a good sensitivity and specificity
Introduction:
MRI has been found to be a useful clinical tool in evaluating response to neoadjuvant treatment of breast cancer (1) and thereby helping assessment of prognosis and surgical planning. The breast cancer response to treatment is dependent on tumor morphology, histology, physiology and molecular subtype, leading to various treatment modalities and clinical outcomes. MRI techniques may identify specific imaging biomarkers that will quantitatively monitor and evaluate response to the various therapies. One such technique is diffusion tensor imaging (DTI) which is multiparametric and directly measures microstructural features through the mapping of directional diffusion coefficients (DDCs), anisotropy indices (AIs) and mean diffusivity (MD). Previous preliminary studies revealed the ability of DTI to measure response to chemotherapy (2-4). Here we extended a 3T longitudinal DTI study of 54 patients testing their pre and post neoadjuvant systemic chemotherapy (NAST) and validating DTI results in reference to the pathology results.Purpose:
To evaluate the ability of DTI to monitor response to NAST in various breast cancer subtypes and determine residual tumor burden post-NAST, as well as search for DTI parameters that correlate with disease-free survival.Methods:
Fifty four females with 56 breast cancer index-lesions in 54 patients were scanned pre-NAST and post- NAST, before surgery. The treatment protocol of each patient was tailored according to the biological subtype. Images were acquired on a 3T scanner (Skyra-Fit, Siemens) with a 16-channels breast coil. The MRI protocol included axial T1 and T2-weighted images without and with fat suppression, DTI with a spin-echo EPI sequence TE/TR= 86ms/12600ms, b-values 0/700 s/mm2 and 30 diffusion-gradient directions), and a clinical dynamic contrast enhanced (DCE) protocol. DTI datasets were analyzed using a dedicated software (DDE MRI Solutions, Tel Aviv, Israel) described earlier yielding three eigenvectors and their corresponding eigenvalues (termed DDCs), λ1, λ2, λ3 their MD and maximal anistropy, λ1-λ3 and fractional anisotropy (FA) (4). Two trained breast radiologist (4 and 29 years) read the DTI parametric images blind to each other and to the clinical information. The identified index lesions on the λ1 maps were correlated to T1-w/T2-w images, and to the post-biopsy tissue-marker, and then region of interest (ROI) of the lesion boundary before and after NAST was delineated on each λ1 map by consensus yielding mean and median values of all DTI parameters within the ROI. Lesions’ size was measured by the longest diameter on λ1 maps and the residual size post-NAST was correlated with the histopathology cancer diameter in the surgical specimens. Histology and immunohistochemistry information were obtained for all patients using well established methods (5-6). Statistical tests (Kruskal-Wallis and Wilcoxon) were applied for λ1, as this is the most sensitive parameter of the DDCs with the highest CNR (4).Results and Discussion:
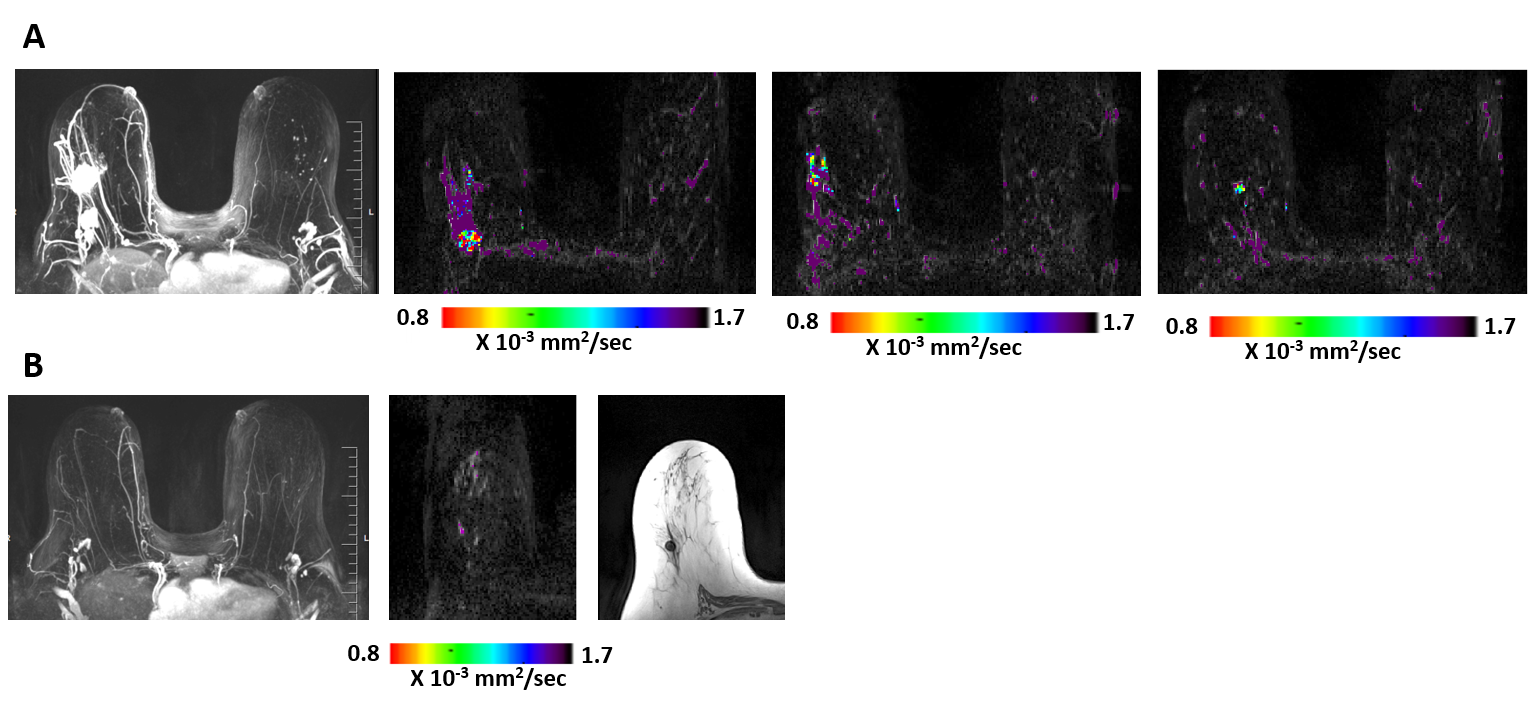
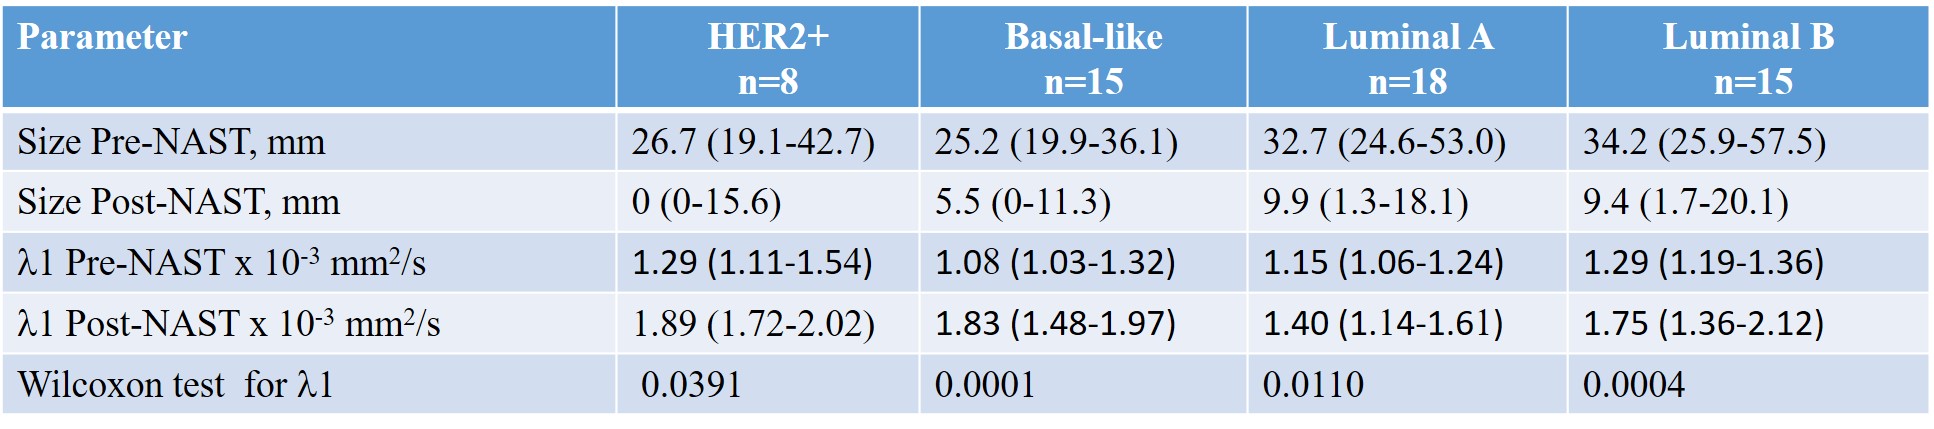
The distribution of biological subtypes were 18 Luminal A, 15 Luminal B, 8 HER2+ and 15 Basal like cancers. Complete pathological response (pCR) was found in 16 out of 56 cancers. Changes in the size in response to NAST were based on the analysis of the λ1 maps (Figure). Comparison of the residual DTI tumor size post-NAST with the histopathology size results of surgical specimens showed a significant Pearson correlation coefficient (r=0.62; p<0.0001). A Bland-Altman test indicated a similar distribution around the zero line with a small negative bias (-6.7 mm) and three outliers. All responding tumors in all subtypes showed a similar trend of increase in λ 1 post-NAST. A significant increase in λ1 (Wilcoxson test) was exhibited between pre and post-NAST of each subtype (Table). Kruskal-Wallis test showed that pre-treatment DTI lesion’s size and l1values were not significantly different betwenn subtypes. The residual DTI tumor size post-NAST between the subtypes was also not significantly different, however, the Kruskal-Wallis test of λ1 values post-NAST indicated significant differences between the subtypes (P=0.039) with Luminal A (Table) statistically different from the other subtypes (Post-hoc Conover analysis with P<0.5). DTI identified post-NAST 12 of the 16 pCR cancers (sensitivity = 75%) with 10 DTI false positive showing DTI complete response (specificity 75%). The pCR rate of the various subtypes followed the order HER2+ (6 out of 8) > Basal-like=Luminal B (4 out of 15)>Luminal A (2 out of 18). A similar order was found for DTI complete response, with DTI complete response in the HER2+ subtype of 5 out of the 6 pCR cancers. Interestingly, a similar order of pCR rate was previously found in a large study of 13,939 women (7).Conclusion:
DTI monitors breast cancer response to NAST through measuring size and diffusion tensor parameters. A correlation was demonstrated between DTI residual tumor size and pathology size. Response in the various breast cancer subtypes was revealed by increased λ1 values, validated by a correlation with pathological residual disease. DTI detected pCR in all breast subtypes with an overall sensitivity/specificity of 75%/75% Studies with a larger sample size are required to find whether NAST induced changes in DTI parameters can be used to evaluate prognosis and predict survival.Acknowledgements
Dr. E. Furman-Haran holds the Calin and Elaine Rovinescu Research Fellow Chair for Brain Research. We acknowledge the professional support of Professor Mordechai Sokolov.References
1. Slanetz PJ, et al. ACR Appropriateness Criteria® Monitoring Response to Neoadjuvant Systemic Therapy for Breast Cancer. J Am Coll Radiol. Nov; 14(11S):S462-S475 (2017)..
2. Furman-Haran E., et al. Quantitative evaluation of breast cancer response to neoadjuvant chemotherapy by diffusion tensor imaging: Initial results. J Magn Reson Imaging 47(4):1080-1090 (2018).
3. Wilmes LJ et al. Diffusion Tensor Imaging for Assessment of Response to Neoadjuvant Chemotherapy in Patients With Breast Cancer. Tomography. Dec;2(4):438-447 (2016).
4. Eyal E., et al. Parametric diffusion tensor imaging of the breast. Invest Radiol. May;47(5):284-91 (2012).
5. Amin MB, Edge S, Greene F, et al, eds; American Joint Committee on Cancer. AJCC cancer staging manual. 8th ed. New York, NY: Springer; 589–636. (2017).
6. Wolff AC et al. Human Epidermal Growth Factor Receptor 2 Testing in Breast Cancer: American Society of Clinical Oncology/College of American Pathologists Clinical Practice Guideline Focused Update. J Clin Oncol. Jul 10;36(20):2105-2122 (2018).
7. Waqar H et al. Response rates and pathologic complete response by breast cancer molecular subtype following neoadjuvant chemotherapy Breast Cancer Research and Treatment 170:559–567 (2018)
Figures