1139
Differential Sub sampling with Cartesian Ordering in Differentiating Benign and Malignant Lesions of the Breast1the Third Affiliated Hospital of Zhengzhou University, Zhengzhou, China, 2GE Healthcare, MR Research China, Beijing, China
Synopsis
Accurate characterization of clinically-indeterminate breast masses before surgery is crucial for proper disease management. While DCE-MRI has emerged as a problem-solving technique, traditional DCE-MRI still lacks a certain quantitative standard because of its technical defects. In this study, DISCO, as a new dynamic contrast enhanced technique, was used to scan breast lesions, and the effectiveness of its parameters in the diagnosis and differential diagnosis of benign and malignant lesions was analyzed.
Introduction
Dynamic contrast enhanced (DCE) MRI is an important basis to evaluate benign and malignant breast lesions, especially in reflecting the hemodynamics of lesions. However, due to the influence of time resolution, traditional DCE-MRI still lacks a certain quantitative standard for quantitative and semi quantitative diagnosis and analysis of diseases.[1-3]Differential sub sampling with cartesian ordering(DISCO) [4] imaging acquire the data with view sharing sampling and parallel imaging, which allows imaging of high spatial resolution, and improved temporal resolution in compare conventional DCE. In this study, DISCO was used to scan breast lesions, and the effectiveness of its parameters in the diagnosis and differential diagnosis of benign and malignant lesions was analyzed.
Purpose
This work aims to investigate the hemodynamic characteristics of multiple arterial phase imaging technique with differential sub sampling with cartesian ordering (DISCO) in the gadoxetate acid disodium enhanced breast MRI. Based on the hemodynamic parameters processed by DISCO, the significance of these hemodynamic parameters in differentiating benign and malignant breast lesions was discussed.Materials and Methods
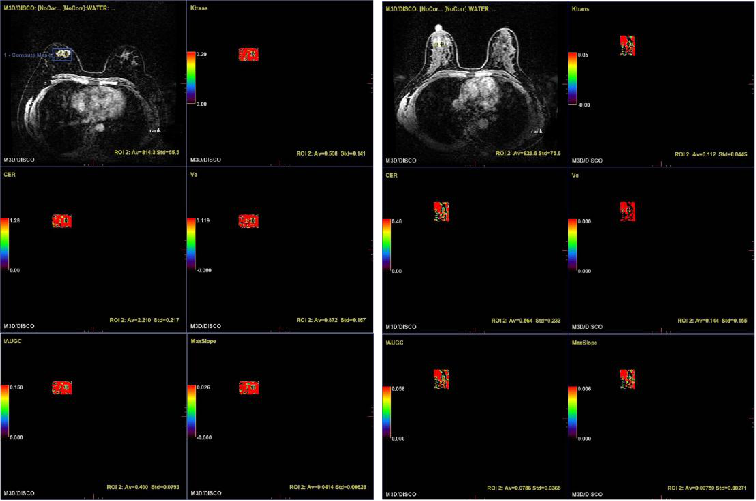
Seventy-two female cases( 35 benign lesions and 37 malignant lesions)aged from 21 to 64 years(45.7±10.9 years) were collected. All patients underwent conventional MRI and DISCO-MRI scan (SIGNA Pioneer 3.0T, GE Healthcare, USA). The T1-weighted DISCO sequence was acquired with TR/TE: 5.2ms/2.3ms, FOV: 360 mm×360 mm, matrix: 288×288. Gd-DTPA was injected 0.1 mmol / kg, following 15 ml normal saline injected through elbow vein at the flow rate of 3.0 ml / s.The collected and scanned data were processed with GenIQ in GE post-processing workstation (AW 4.6). By using the automatic input function (AIF) model, the quantitative parameters including Ktrans,Ve, Kep and semi quantitative parameters including initial area under the gadolinium curve(IAUGC), maximum slope of increase(MaxSlope), ontrast enhancement rate(CER), positive enhancement integral(PEI) of the lesions were calculated.
SPSS 20.0 software was used to analyze thequantifications. After the parameters were confirmed if is normal distribution by Kolmogorov Smirnov test, they were compared with student-t test or wilcoxon test. The receiver operating characteristic curves (ROC) analysis were done for parameters with significant differences, and the area under curve (AUC) and the sensitivity and specificity of diagnosis and differential diagnosis were compared. P value of < 0.05 was considered as the statistically significant difference.
Results
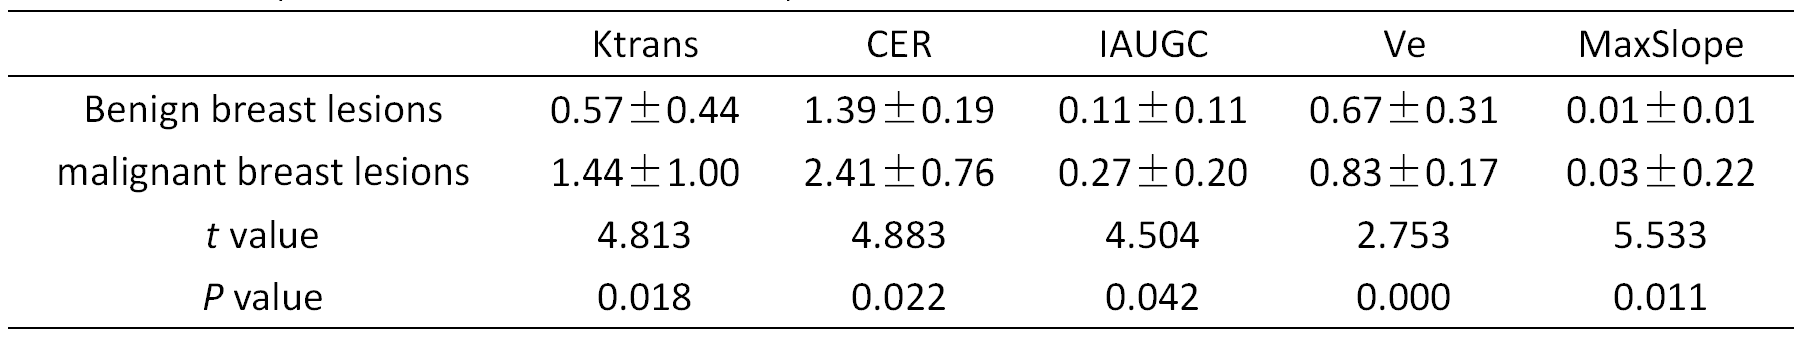
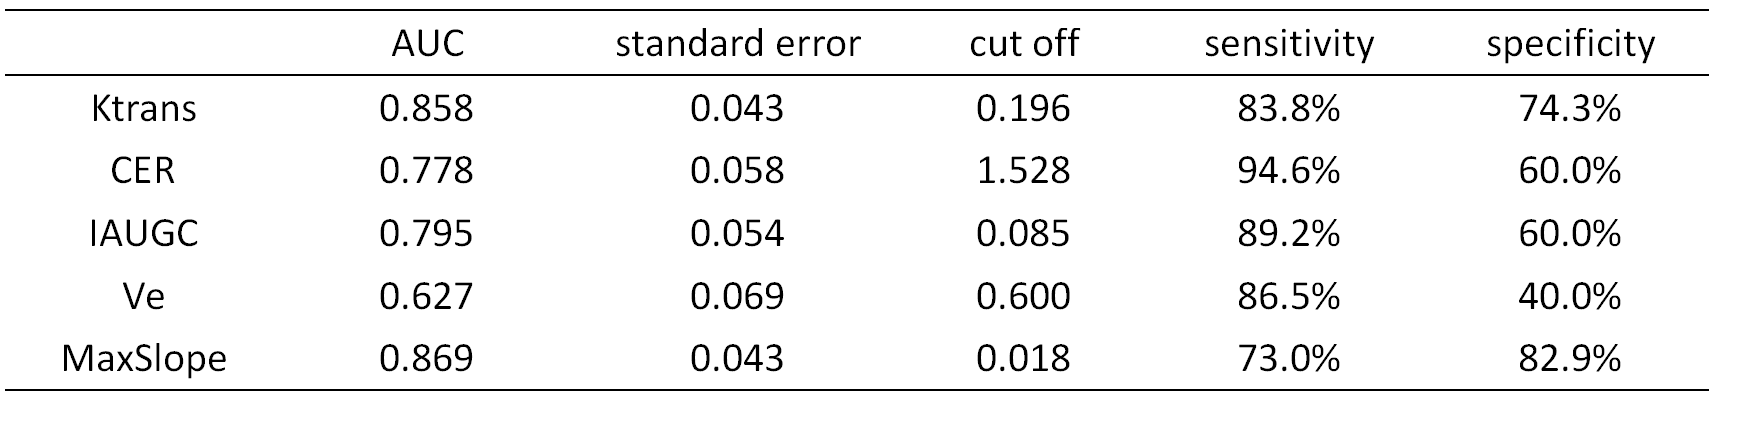
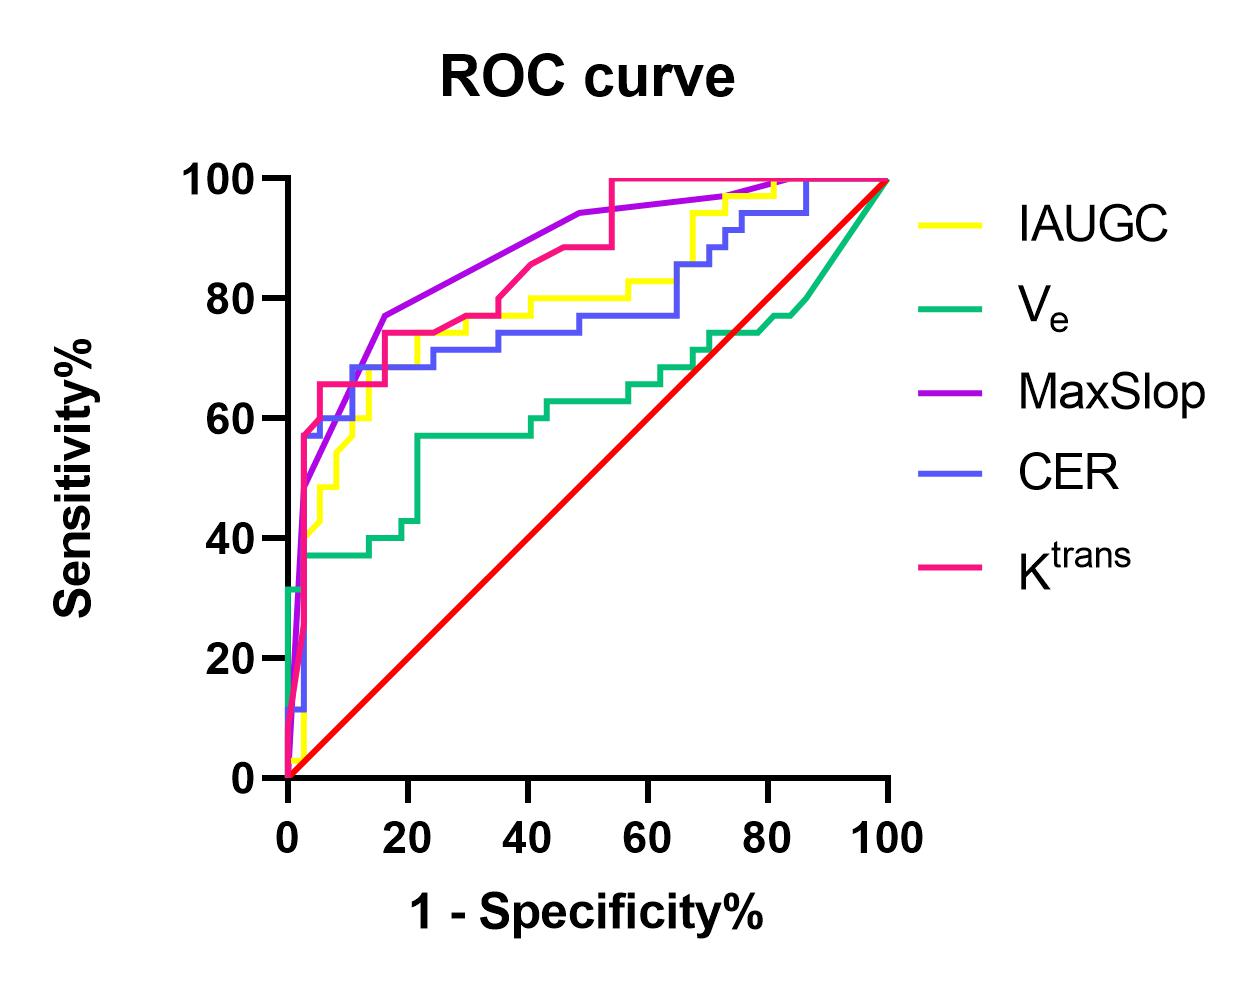
Thirty five cases (41.3±9.8 years old, range: 29-64 y ) of benign lesions and 37 cases (49.1±10.6 years old, range: 21-64 y) of malignant lesions were confirmed by postoperative pathology or puncture pathology. The Ktrans, CER, IAUGC, MaxSlope, Ve of benign lesions were significant lower than that of malignant lesions (P < 0.05)( Table 1). The cut-off of Ktrans, CER, IAUGC,Ve and MaxSlope for the benign and malignant breast lesions differentiation respectively were 0.196, 1.528, 0.085, 0.600, 0.018 in ROC analysis. The area under curve(AUC) of Ktrans, CER, IAUGC, Ve, MaxSlope was 0.858min-1, 0.778, 0.795, 0.627, 0.869mMol/s, respectively. By using the pathological results as gold standard, the sensitivity was 83.8%, 94.6%, 89.2%, 86.5%, 73.0% and the specificity was 74.3%, 60.0%, 60.0%, 40%, 82.9%, respectively (Table 2, Figure 2).Discussion
With the progress of technology, DISCO can also improve the time resolution without affecting the spatial resolution, so that more parameters (including quantitative and semi quantitative parameters of hemodynamics) can be obtained at the same time after sequence processing. In addition, the time resolution of DCE-MRI was more than 12s , which led to the distortion of hemodynamic parameters. [5-6]As breast cancer is a vascular dependent disease, it depends on the complex micro blood network to provide nutrition in the process of occurrence and development, and can produce a variety of tumor angiogenesis factors, leading to the increase and thickening of blood vessels around the lesion. In this study, Ktrans, CER, IAUGC, Ve, MaxSlope between the two groups were statistically significant, in line with the pathophysiological characteristics of the lesions, suggesting that these parameters are important in the diagnosis and differential diagnosis of benign and malignant breast lesions. AUC is mostlygreater than 0.7, so the sensitivity of differential diagnosis between the two All of these parameters were higher than 70%, which indicated that these parameters had high efficiency in the diagnosis and differential diagnosis of benign and malignant breast lesions. At the same time, the quantitative parameters Ktrans and Ve in this study are different in benign and malignant lesions, which are consistent with previous studies; semi quantitative parameters have higher AUC value than previous studies due to the higher requirements for time resolution in previous studies, which may be related to the higher time resolution of DISCO sequence in this study.
Conclusion
We identified the statistically significant difference of hemodynamic parameters processed by DISCO between benign and malignant breast lesions. It can provide important reference information for the selection of treatment plan and the formulation of surgical plan for breast lesions.Acknowledgements
No acknowledgement found.References
[1] Kinkel K, Helbich TH, Esserman LJ, et al. Dynamic high-spatialresolution MR imaging of suspicious breast lesions: diagnostic criteria and interobserver variability. AJR Am J Roentgenol 2000;175:35–43.
[2] Kim JY, Kim SH, Kim YJ, et al. Enhancement parameters on dynamic contrast enhanced breast MRI: do they correlate with prognostic factors and subtypes of breast cancers? Magn Reson Imaging 2015;33:72–80.
[3] Kelm BM, Menze BH, Nix O, et,al. Estimating kinetic parameter maps from dynamic contrast-enhanced MRI using spatial prior knowledge. IEEE Trans Med Imaging 2009;28:1534–1547.
[4] Saranathan M, Rettmann DW, Hargreaves BA, et al. Variable spatiotemporal resolution three-dimensional Dixon sequence for rapid dynamic contrast-enhanced breast MRI. J Magn Reson Imaging. 2014;40:1392–1399.
[5]Kinkel K, Helbich TH, Esserman LJ, et al. Dynamic high-spatial resolution MR imaging of suspicious breast lesions: diagnostic criteria and interobserver variability. AJR Am J Roentgenol 2000;175:35–43.[6]Li Z, Ai T, Hu Y,et al. Application of whole-lesion histogram analysis of pharmacokinetic parameters in dynamic contrast-enhanced MRI of breast lesions with the CAIPIRINHA-Dixon-TWIST-VIBE technique. J Magn Reson Imaging. 2018 Jan;47(1):91-96.
Figures