1134
Quantitative transport mapping for classifying malignant breast lesion: Comparison with kinetic modeling and enhancement characteristics1Weill Cornell Medical College, New York, NY, United States, 2Cornell University, New York, NY, United States
Synopsis
We evaluate quantitative transport mapping (QTM) based on the inversion of transport equation without any arterial input function (AIF) for automatically postprocessing dynamic contrast enhanced MRI (DCE-MRI) to differentiate malignant and benign breast tumors using biopsy pathology as reference and comparing with traditional Kety’s method and enhancement curve characteristics (ECC). Automated QTM velocity was found to be the most accurate, then ECC enhancement amplitude with manual ROI, and lastly Kety’s Ktrans with a manual AIF for differentiating malignant from benign breast tumor.
Introduction
Perfusion quantification is based on modeling kinetics of a tracer transport through tissue captured in time-resolved imaging, such as dynamic contrast enhanced (DCE) MRI. Currently, Kety’s equation1with Tofts’ generalization2 is used to processing DCE-MRI with a global arterial input function (AIF) that is known to be problematic3. To address the AIF problem in the traditional Kety’s modeling of tracer kinetics, recently a new method has been proposed to model the contrast agent concentration change in space and time by a transport equation of spatial and temporal derivatives without the requirement of AIF in traditional kinetic model (16). A blood flow velocity can be calculated by inverting the transport equation4,5, which is termed as quantitative transport mapping (QTM)6,7, in a fully automated manner without any AIF input. In this work, we investigate the use of QTM for postprocessing time-resolved 3D dynamic contrast enhanced (DCE) MRI of breast tumors and compare QTM with traditional Kety’s method and enhancement curve characterization (ECC). Breast biopsy pathology in characterizing tumor malignancy is used to evaluate the performances of various quantitative perfusion postprocessing methods in differentiating benign from malignant breast tumors.Methods
In vivo DCE MRI. The study included twenty six female patients who had 1) undergone MRI of the mammary glands for suspicious lesions on mammography/ultrasound, 2) DCE-MRI as part of their routine clinical MRI protocol on a 3T MRI system (Magnetom Skyra, Siemens), and 3) biopsy (30 lesions). The DCE-MRI acquisition parameters were: TR/TE=3.95/1.7 msec, flip angle = 10°, in-plane spatial resolution = 0.71 mm, thickness = 1.8 mm, time per phase or temporal resolution =15.4 sec, axial orientation.DCE-MRI was processed using quantitative susceptibility mapping (QTM), Kety with voxel-delay fitting, and enhancement curve characteristics (ECC). For QTM, we fit DCE-MRI data $$$c(\xi,t)$$$ to the transport equation4:
$$\boldsymbol{u}=argmin_{\boldsymbol{u}}\sum_{t=1}^{N_t-1}||\partial_tc+\nabla\cdot c\boldsymbol{u}||^2_2+\lambda||\nabla\boldsymbol{u}||_1 \qquad (1) $$
where $$$ \partial_t, \nabla $$$ are difference operator for temporal, spatial gradient, $$$\boldsymbol{u}$$$ convention velocity. For Kety, DCE-MRI fitting is the extended Tofts’ model:
$$ K^{trans},k_{ep},\tau=argmin_{K^{trans},k_{ep},\tau}\sum_{t=1}^{N_t-1}||\partial_tc-K^{trans}c_a(t-\tau)+k_{ep}c||^2_2+\lambda||\nabla K^{trans}||_1+\lambda||\nabla k_{ep}||_1 \qquad (2) $$
where $$$c_a(t)$$$ was the global arterial input function (AIF).$$$k_{ep}=\frac{K^{trans}}{V_e}$$$, where $$$K^{trans}$$$tracer exchange rate and $$$V_e$$$ volume of extravascular space. For ECC, a Levenberg–Marquardt algorithm is used to perform the following nonlinear curve fitting:
$$ A,\alpha,\beta =argmin_{A,\alpha,\beta}\sum_{t=1}^{N_t-1} |\Delta S(t)-A(1-e^{-at})e^{-\beta t} |_2^2 \qquad (3) $$
Results:
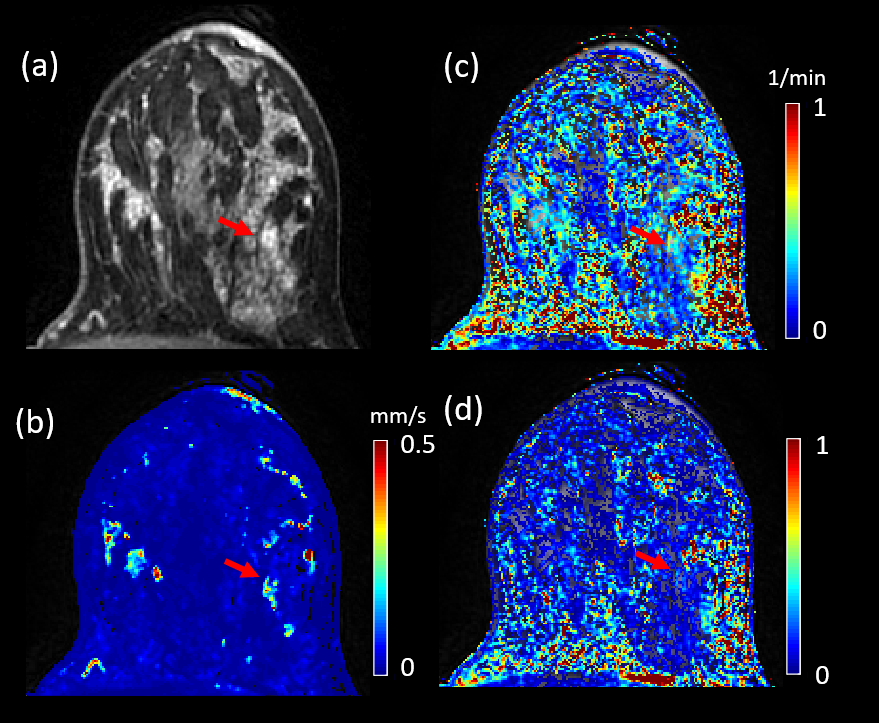
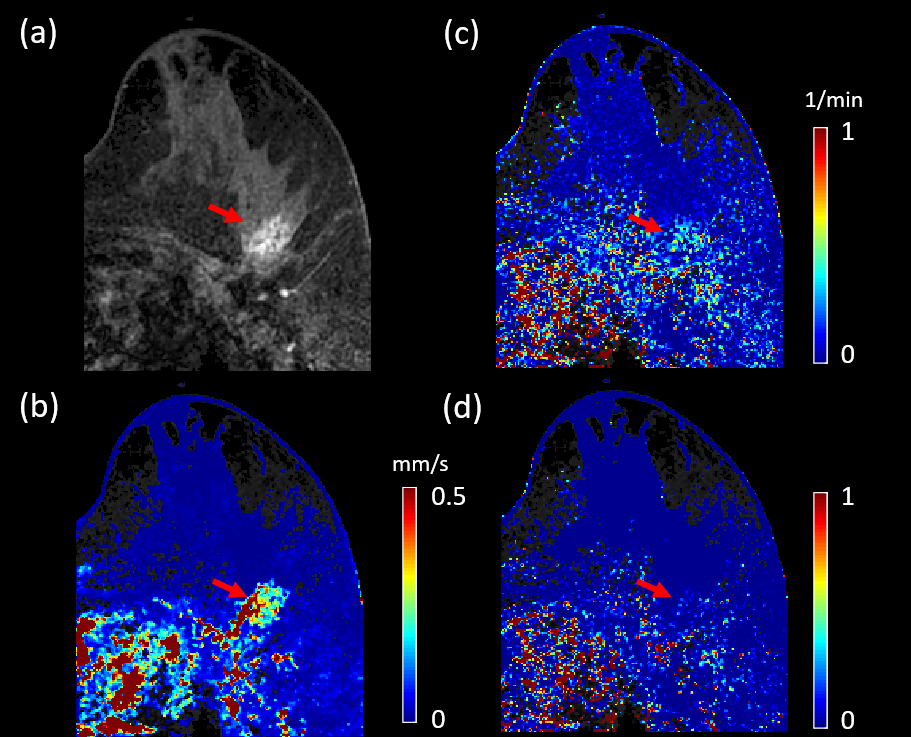
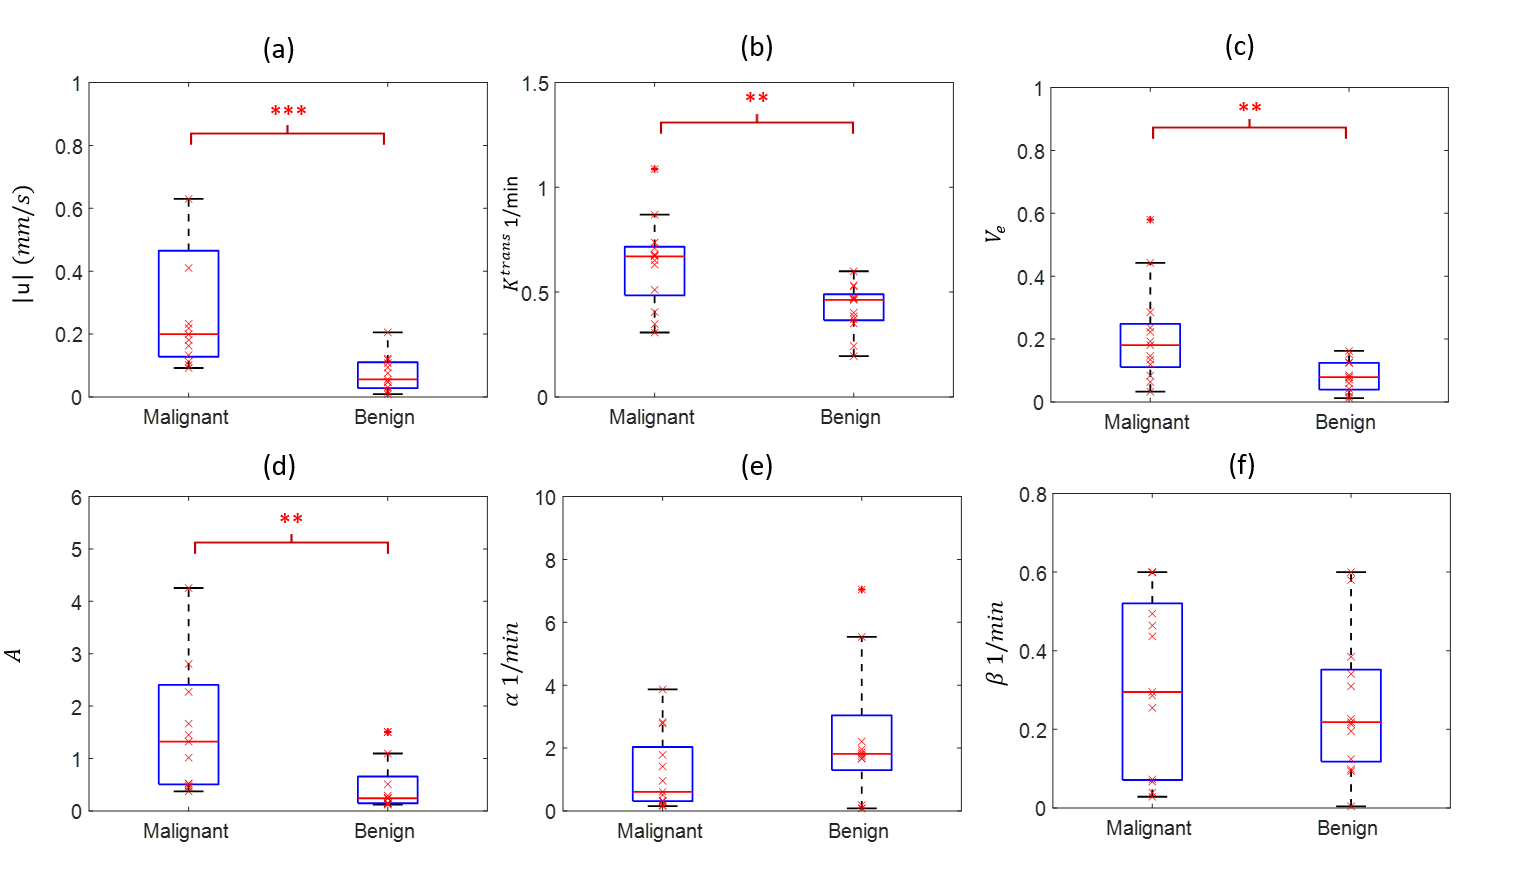
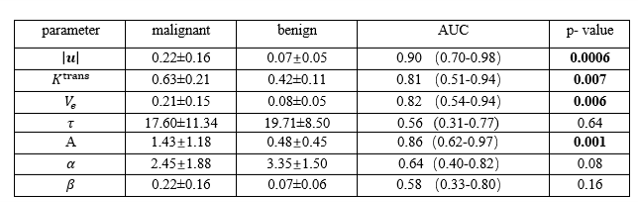
Figures 1 and 2 illustrate example maps of QTM velocity $$$|u|$$$,$$$K^{trans}$$$ and $$$V_e$$$ for malignant and benign lesions. The two lesions showed similar enhancement on T1 weighted images of DCE MRI (Figures 1a & 2a). The benign lesion showed a lower QTM velocity (Figure 1b) compared to the malignant lesion (Figure 2b). The diagnostic performances of various parameters from QTM, Kety’s method and ECC are summarized illustrated in Figure 3 and 4. A statistically significant difference between malignant and benign lesions was found only for QTM velocity $$$|u|$$$ (0.22±0.16 vs 0.07±0.05 mm/s, p=0.0006), $$$K^{trans}$$$ (0.63±0.21 vs 0.42±0.11/min, p=0.007), $$$V_e$$$ (0.21±0.15 vs 0.08±0.05, p=0.006), and semi-quantitative ECC parameter A (1.43±1.18 vs 0.48±0.45, p=0.002). Among all these parameters (Figure 4), the highest AUC value was achieved with QTM velocity (0.90, 95% confidence level 0.70-0.98) followed by enhancement parameter A (0.86, 0.62-0.97), $$$V_e$$$(0.82, 0.54-0.94) and $$$K^{trans}$$$ (0.81, 0.51-0.94).Discussion and Conclusion:
Our results demonstrate that the inversion of the transport equation or quantitative transport mapping (QTM) is feasible for automatically processing DCE-MRI as applied in breast cancer diagnosis. For performance in differentiating benign from malignant tumors, QTM was compared with two traditional methods of breast DCE-MRI postprocessing, Kety’s method and enhancement curve characteristics (ECC). Using biopsy pathology as reference standard, QTM was found to has the highest accuracy (AUC=0.90), followed by ECC (AUC=0.86) and then Kety’s method (AUC=0.82). The accuracy and automation of QTM suggest that QTM has the potential to improve quantitative perfusion postprocessing of DEC-MRI in clinical practice.QTM with spacetime deconvolution is feasible for determining a velocity from time resolved imaging of tracer transport in tissue. The QTM method automatically generates a velocity vector map from DCE-MRI data, eliminating the need for an AIF. Compared to traditional Kety’s method and enhancement curve characteristics, QTM velocity had higher diagnostic accuracy in distinguishing benign from malignant breast lesions.
Acknowledgements
We don't have any acknowledgements.References
1. Kety SS. The theory and applications of the exchange of inert gas at the lungs and tissues. Pharmacol Rev 1951;3(1):1-41.
2. Tofts PS, Brix G, Buckley DL, Evelhoch JL, Henderson E, Knopp MV, Larsson HB, Lee TY, Mayr NA, Parker GJ, Port RE, Taylor J, Weisskoff RM. Estimating kinetic parameters from dynamic contrast-enhanced T(1)-weighted MRI of a diffusable tracer: standardized quantities and symbols. J Magn Reson Imaging 1999;10(3):223-232.
3. Calamante F. Arterial input function in perfusion MRI: a comprehensive review. Prog Nucl Magn Reson Spectrosc 2013;74:1-32
4. Spincemaille P, Zhang Q, Nguyen TD, Wang Y. Vector field perfusion imaging. 2017; Hawaii. p 3793.
5. Zhou L, Spincemaille P, Zhang Q, Nguyen T, Doyeux V, Lorthois S, Wang Y. Vector Field Perfusion Imaging: A Validation Study by Using Multiphysics Model. 2018; Paris, France. p 1870.
6. Zhou L, Zhang Q, Spincemaille P, Nguyen T, Wang Y. Quantitative Transport Mapping (QTM) of the Kidney using a Microvascular Network Approximation. 2019 4/26/2019; Montreal. p 703.
7. Zhou L, Zhang Q, Spincemaille P, Nguyen TD, Morgan J, Dai W, Li Y, Gupta A, Prince MR, Wang Y. Quantitative transport mapping (QTM) of the kidney with an approximate microvascular network. Magn Reson Med 2020.
Figures