1131
Differentiating breast adenosis and breast cancer lesions: Value of Synthetic MRI1Department of Radiology, The Third Affiliated Hospital of Zhengzhou University, Zhengzhou, China, zhengzhou, China, 2GE Healthcare, MR Research China, Beijing, China, zhengzhou, China
Synopsis
Synthetic MRI is able to obtain various image comtrasts and quantitative parameters.These parameters( T1, T2, and PD values) directly reflect the composition of the tissue.The objective of this study was to assess Synthetic magnetic resonance imaging (MRI) ability for differentiation between breast adenosis and breast cancer.Our results show that show that Synthetic MRI is a useful tool that can be utilised to discriminate between breast adenosis and breast cancer.
Introduction
Breast lesions exhibits heterogeneous characteristics with variable patterns of morphology. These characteristics make clinical management very challenging. As the use of breast imaging examination has increased, the identification of benign breast disease has become more common [1]. Furthermore, breast adenosis comprise a group of benign proliferative disorders of the breast that may mimic the features of malignancy on imaging [2]. As we all know, pathological evaluation still remains the gold standard for breast disease diagnosis, but this method has limitations related to the invasive nature of biopsy, limited field of view. Increasing evidence suggests a role for imaging parameters for predicting tumour malignancy and treatment response [3]. Breast imaging technology, especially magnetic resonance imaging, has increasingly been used preoperatively during the past several years because of its high sensitivity for detecting lesions and its negative predictive value, improvement in the diagnostic sensitivity of radiological techniques will reduce the indications for follow-up surgical excision [4-7].Synthetic MRI enables quantitative analysis of T1 relaxation time,T2 relaxation time,and PD [8]. Previous studies have shown that T1 value could predict the response of locally advanced breast cancer to neoadjuvant therapy [9]. The different in T2 relaxation time between benign and malignant breast lesions was statistically significant [10]. At present, there are few research reports on synthetic MRI diagnostic value of breast diseases. The purpose of this study was to explore the synthetic MRI diagnostic value for differentiating between breast cancer and breast adenosis.Material and Methods
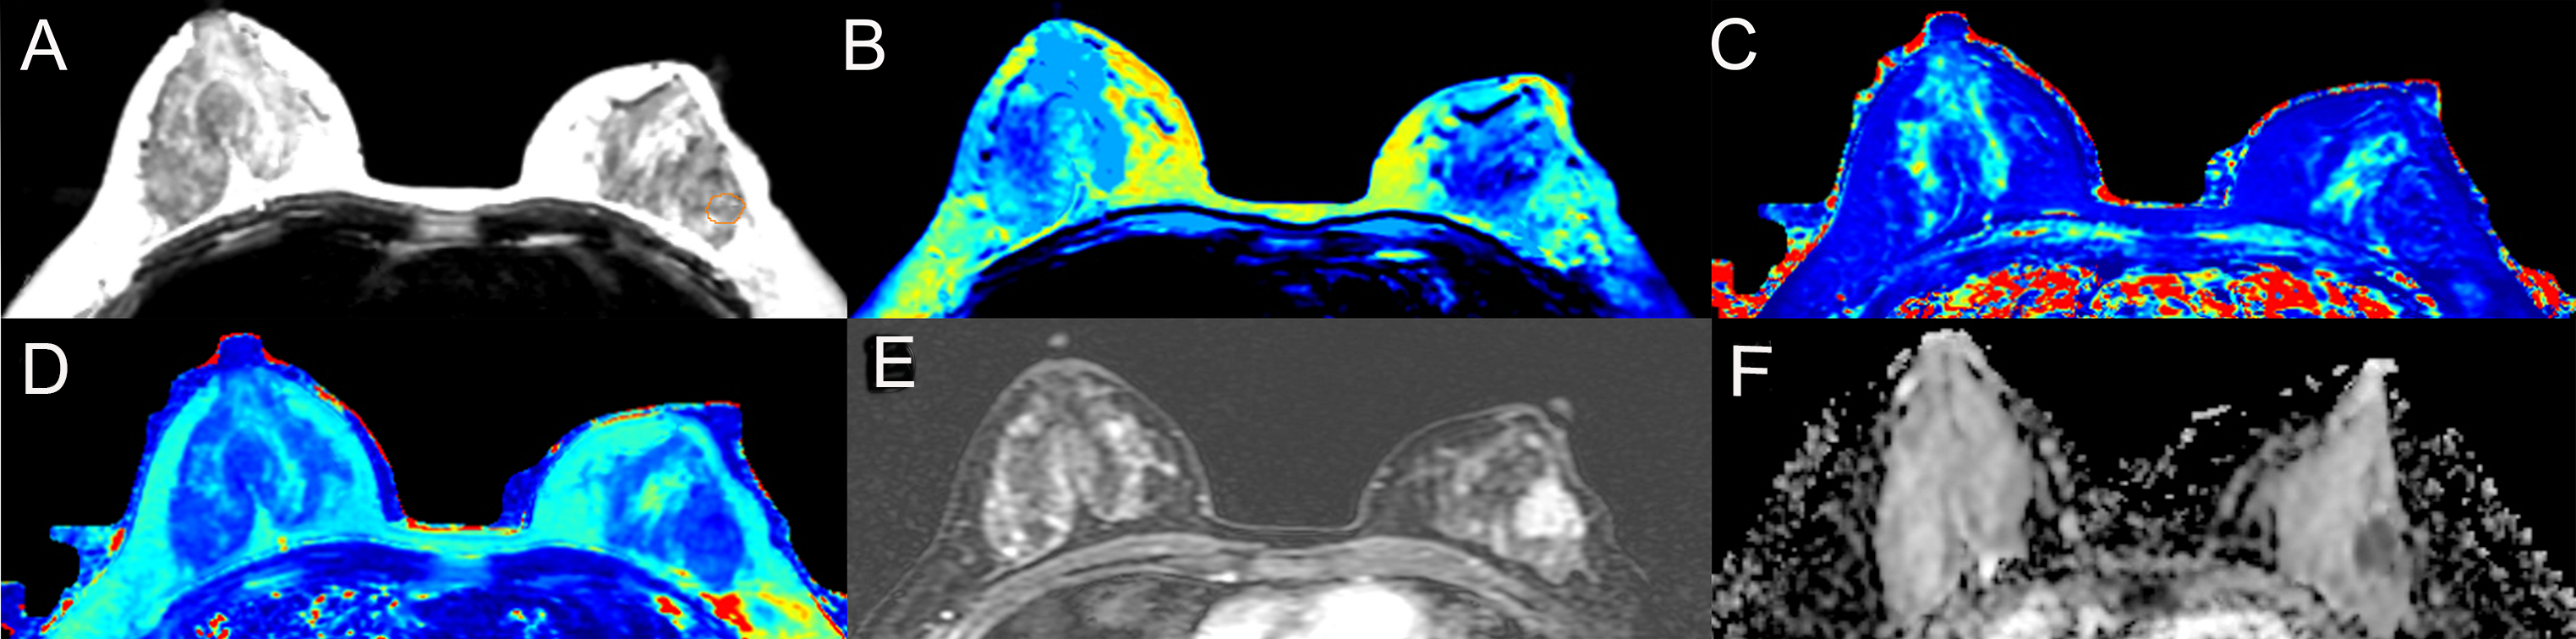
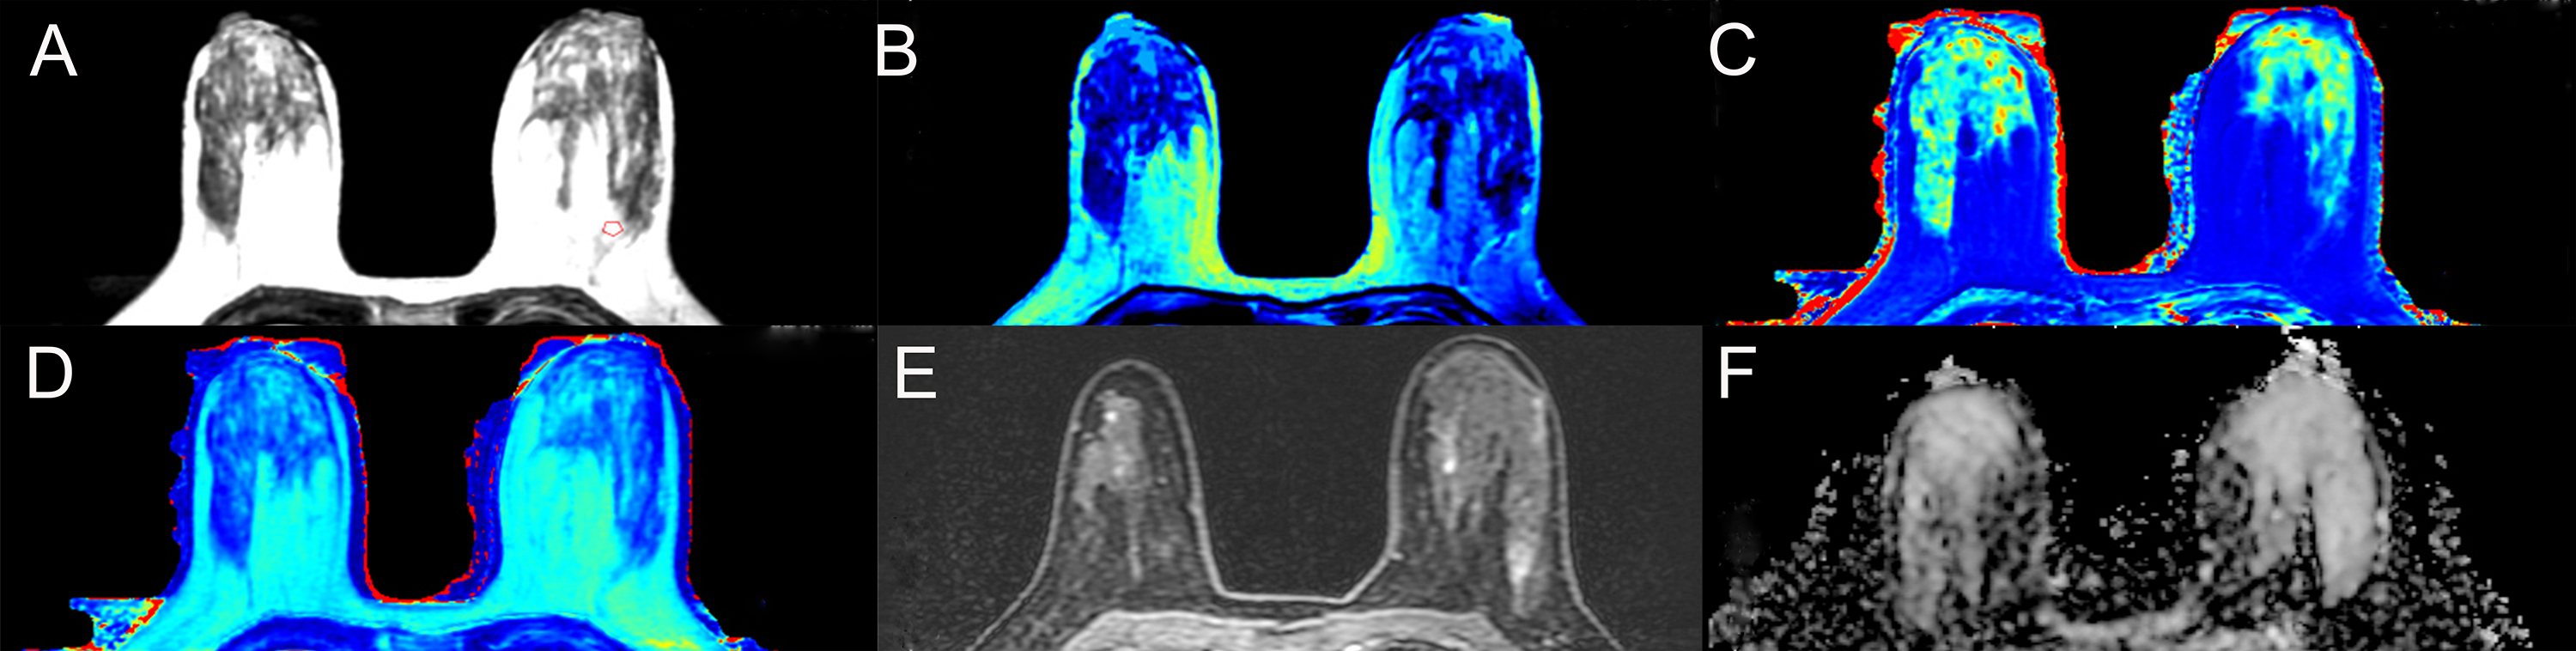
30 breast adenosis patients and 30 breast cancer patients at diagnosis underwent synthetic MRI before pharmacological and surgical treatment.Breast MRI was performed using a 3-T MRI system (SIGNA Pioneer, GE Healthcare, USA). The parameters of MAGiC sequence were as follows: TR= 10645.0ms, TE= 23.0ms, Inversion time=NA, FOV= 360X360 mm2, matrix=320x224, slice thickness=5 mm, intersection gap= 0 mm, number of sections= 40, echo train length=16, acceleration factor=3.0. In the synthetic T2 weighted images, two radiologists drew the region of interest (ROI) manually to encompass as much of the abnormality as possible and stay within the border of the lesion (Figure 1, Figure 2). For each primary lesion, the following date were extracted: Synthetic MRI date including T1 relaxation time,T2 relaxation time and proton density (PD) ,before and after the contrast; and perfusion-related parameters including Ktrans, Kep, Ve, CER, BAT, IAUGC, MaxSlpoe. We also calculated the synthetic MRI parameters difference between before and after contrast agent injection (T1-Pre-T1-Gd, T2-Pre-T2-Gd, PD-Pre-PD-Gd).Final diagnosis (breast cancer or breast adenosis) of breast lesions was determined after surgical or biopsy pathology. SPSS 23.0 statistical software was used for data analysis. The T test and c2 test was respectively used to compare the age and Menopausal status between breast adenosis group and breast cancer group. Mann-Whitney U-text were used to compare TIC type, BI-RADS category and imaging parameters. The diagnostic ability of the imaging parameters was evaluated by receiver operating characteristics (ROC). Imaging parameters, which significantly were different between the two group, were selected to perform ROC curve analysis to determine their performance to discriminate between breast adenosis and breast cancer. Binary logistic regression was applied to calculate the predictive probability of combined Ktrans and T1-pre for differentiating between breast cancer and breast adenosis.Result
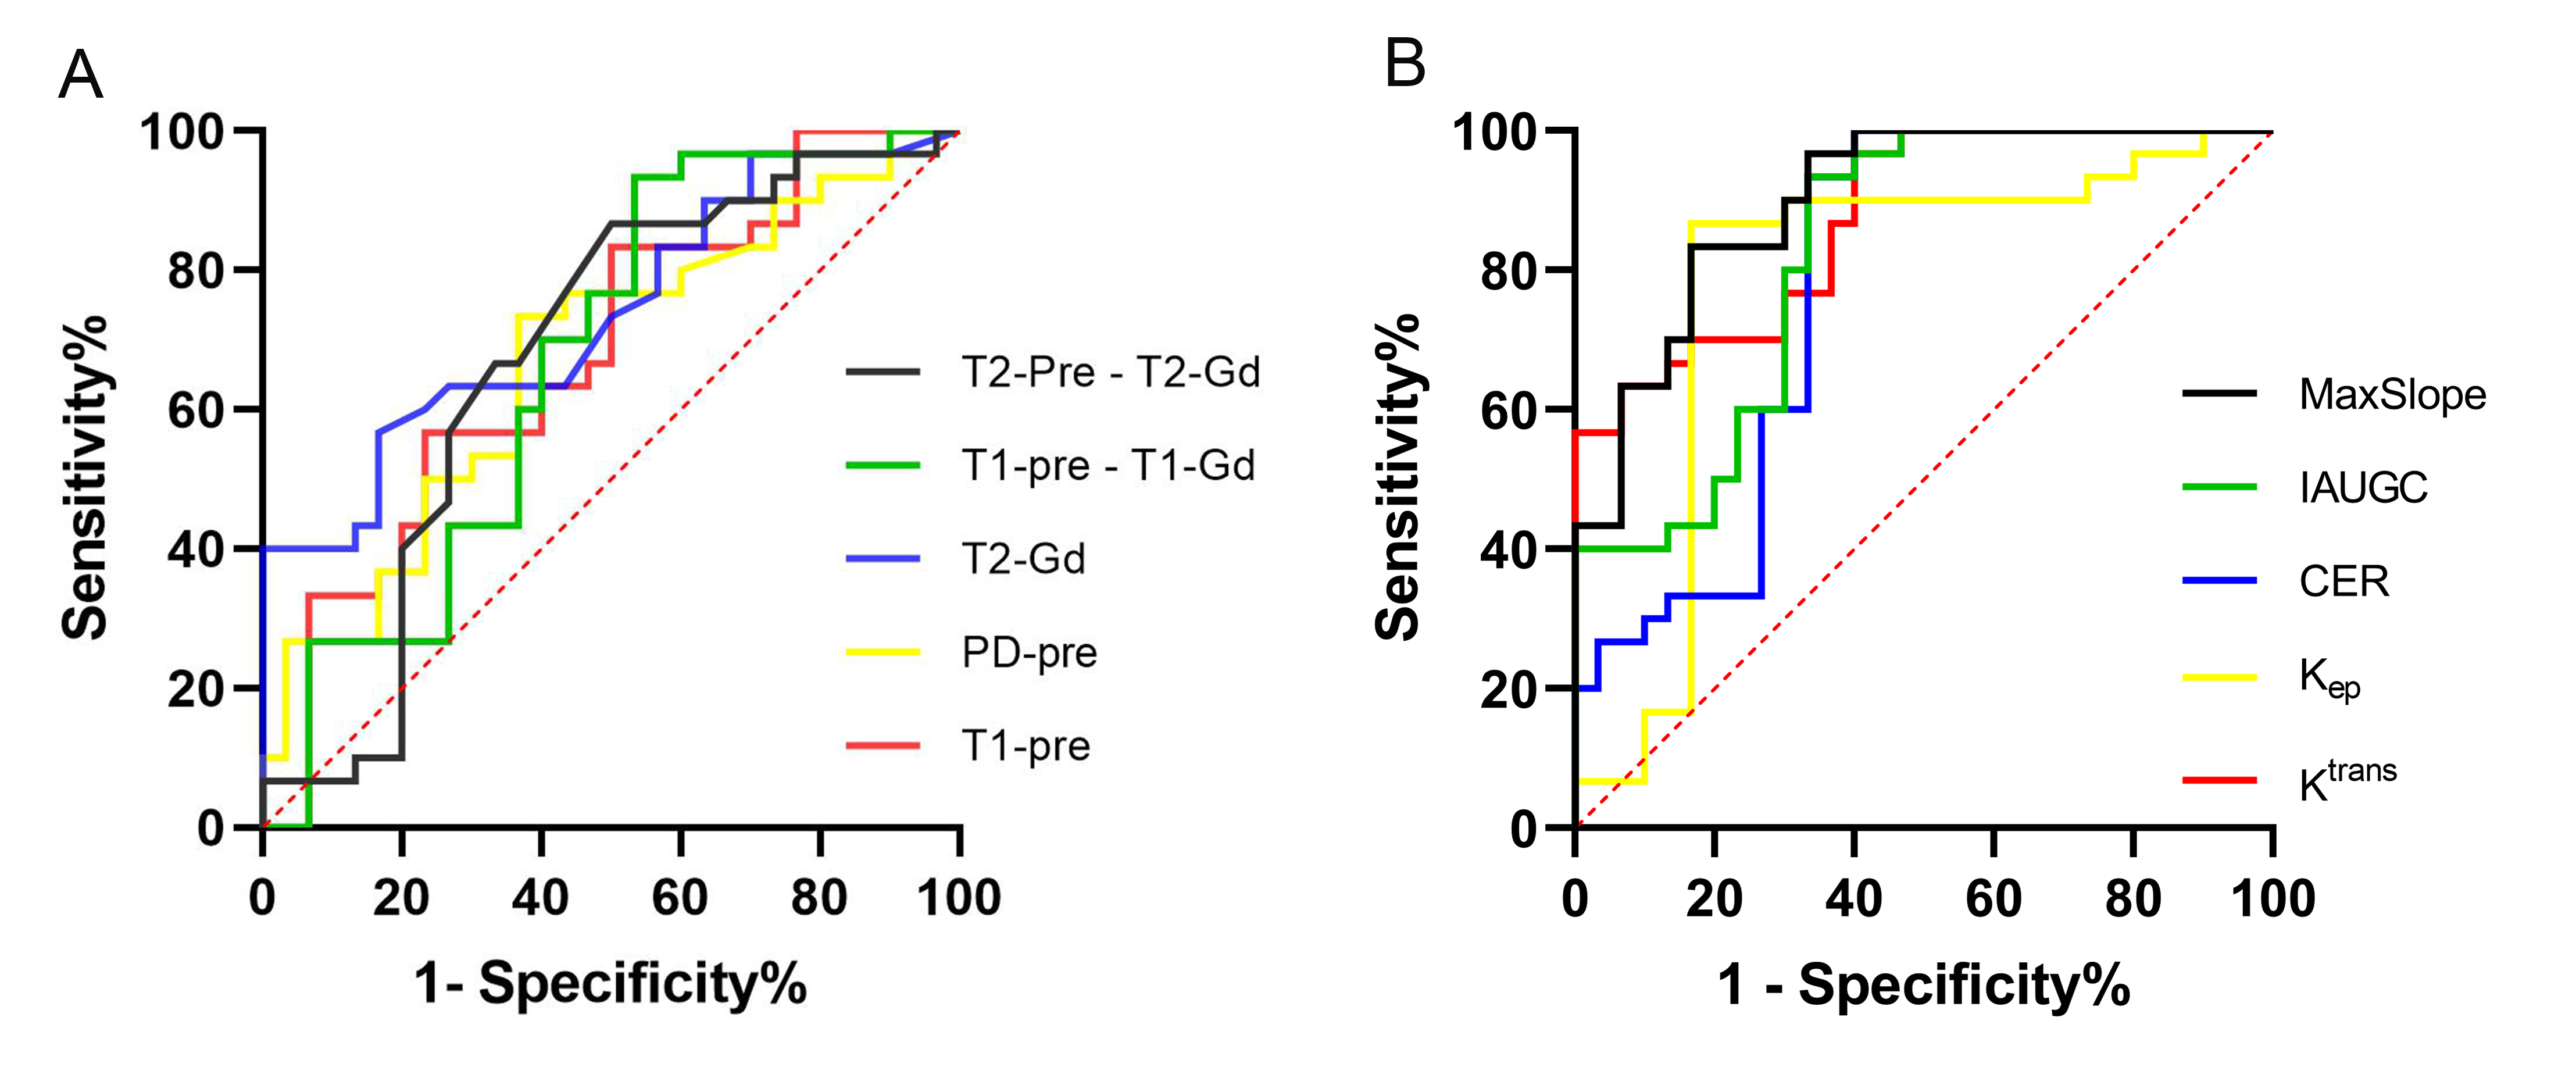
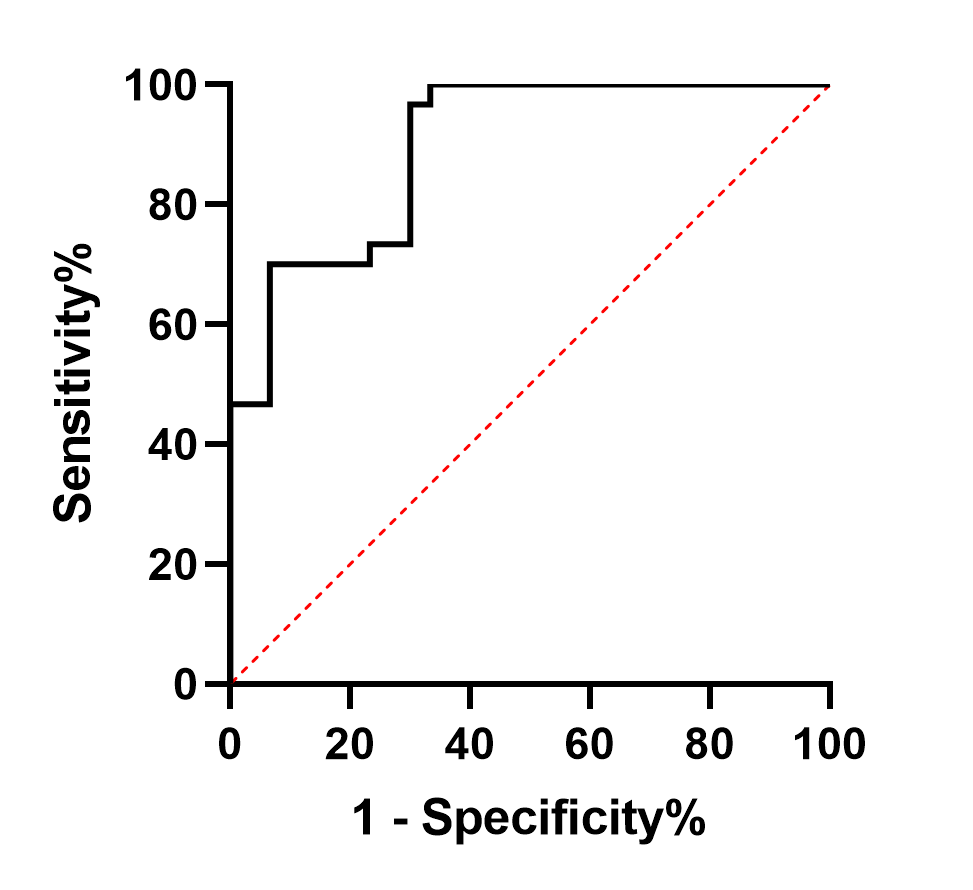
T1-Pre (p=0.019),PD-Pre(p=0.022), T2-Gd (p=0.002), T1-Pre -T1-Gd (p=0.027), T2-pre - T2-Gd (p=0.021), ADC (p<0.001), Ktrans (p<0.001), Kep (p<0.001), CER (p<0.001), IAUGC (p<0.001) and MaxSlope (p<0.001) were differently distributed between the two groups. (Table 1) The breast cancer group showed higher values of T1-Pre, PD-Pre, T1-Pre -T1-Gd, T2-pre - T2-Gd, Ktrans, Kep, CER, IAUGC, MaxSlope than the breast adenosis group. The breast adenosis group showed higher values of T2-Gd than the Breast cancer group.T1-Pre(AUC=0.677), PD-Pre(AUC=0.672), T2-Gd(AUC=0.736),T1-Pre -T1-Gd (AUC =0.667), T2-pre - T2-Gd (AUC =0.673), Ktrans(AUC=0.873), Kep(AUC=0.782), CER (AUC=0.781), IAUGC (AUC=0.826) , MaxSlope (AUC=0.900) parameters and combination of Ktrans and T1-Pre(AUC=0.896) were able to discriminate between breast adenosis and breast cancer(Figure 3, Figure 4). Binary logistic regression was applied to calculate the predictive probability of combined Ktrans and T1-pre for differentiating between breast cancer and breast adenosis (Table 2).Disscussion
Our study focused on assessing the ability of imaging parameters that distinguish breast cancer from breast adenosis. ROC curve analysis showed that synthenic MRI parameters were able to significantly discriminate between breast cancer and breast adenosis. The performance of these synthenic MRI parameters in the present study is evidently lower than that of perfusion-related parameters. However, the combination of Ktrans and T1-pre found that the AUC reached 0.893, which was higher than the AUC of these single parameters(except for MaxSlope)and similar with the AUC of MaxSlope value, indicating that the accuracy of the combined identification of the two parameters was better. The previous study found that the background parenchymal enhancement might produce a high false positive rate with breast DCE imaging [11]. The specificity of using synthenic MRI parameters alone for the differentiation of benign from malignant lesions was not high, but it could constitute a new adjunct in the MRI diagnosis of breast cancer.Conclusion
Synthetic MRI parameters was able to discriminate between breast adenosis and breast cancer.Acknowledgements
No acknowledgement found.References
[1] Hartmann LC, Sellers TA, Frost MH, et al. Benign breast disease and the risk of breast cancer. N Engl J Med. 2005;353(3):229-237.
[2] Gity M, Arabkheradmand A, Taheri E, et al. Magnetic Resonance Imaging Features of Adenosis in the Breast. J Breast Cancer. 2015;18(2):187-194.
[3] Provenzano E, Bossuyt V, Viale G, et al. Standardization of pathologic evaluation and reporting of postneoadjuvant specimens in clinical trials of breast cancer: recommendations from an international working group. Mod Pathol. 2015;28(9):1185-1201.
[4] Rahbar H, Lehman CD. Rethinking Preoperative Breast Magnetic Resonance Imaging. JAMA Oncol. 2015;1(9):1226-1227.
[5] Bakker MF, de Lange SV, Pijnappel RM, et al. Supplemental MRI Screening for Women with Extremely Dense Breast Tissue. N Engl J Med. 2019;381(22):2091-2102.
[6] Saslow D, Boetes C, Burke W, et al. American Cancer Society guidelines for breast screening with MRI as an adjunct to mammography [published correction appears in CA Cancer J Clin. 2007 May-Jun;57(3):185]. CA Cancer J Clin. 2007;57(2):75-89.
[7] Thomas PS. Diagnosis and Management of High-Risk Breast Lesions. J Natl Compr Canc Netw. 2018;16(11):1391-1396.
[8] Tanenbaum LN, Tsiouris AJ, Johnson AN, et al. Synthetic MRI for Clinical Neuroimaging: Results of the Magnetic Resonance Image Compilation (MAGiC) Prospective, Multicenter, Multireader Trial. AJNR Am J Neuroradiol. 2017;38(6):1103-1110.
[9] Sorace AG, Wu C, Barnes SL, et al. Repeatability, reproducibility, and accuracy of quantitative mri of the breast in the community radiology setting . J Magn Reson Imaging. 2018.
[10] Liu L, Yin B, Shek K, et al. Role of quantitative analysis of T2 relaxation time in differentiating benign from malignant breast lesions. J Int Med Res. 2018;46(5):1928-1935.
[11] Sardanelli F, Boetes C, Borisch B, et al. Magnetic resonance imaging of the breast: recommendations from the EUSOMA working group. Eur J Cancer. 2010;46(8):1296-1316.
Figures