1127
Accuracy and Precision of a Breast Diffusion Phantom Across 3T Scanners1Radiology, University of California San Diego, La Jolla, CA, United States, 2National Institute of Standards and Technology, Boulder, CO, United States
Synopsis
Diffusion-weighted imaging (DWI) has shown potential to diagnose and monitor breast cancer by differentiating benign and malignant lesions. Malignancy-specific cutoff values for DWI estimates have been difficult to establish due to variability across scanners and imaging sites. Thus, understanding the accuracy and precision of these quantitative methods may inform clinical implementation of DW-MRI. Here, we investigated the accuracy and precision of ADC values within a breast phantom across four 3T MRI scanners by the same vendor.
Introduction
Multiparametric breast MRI is a valuable imaging technique for the screening, staging, and treatment response evaluation of breast cancer, the most commonly diagnosed cancer and leading cause of cancer death among U.S. women.1,2 Diffusion weighted imaging (DWI) has been incorporated into breast MRI protocols because of its potential to distinguish benign from malignant breast lesions3 and monitor response to neoadjuvant chemotherapy.4 However, apparent diffusion coefficient (ADC) cutoff values have been difficult to establish due to variability across scanners, vendors, and lesions.5 Towards this goal, a breast phantom was designed by the University of California San Francisco (UCSF) and the National Institute of Standards and Technology (NIST) containing tubes of materials mimicking breast diffusion properties.6 Additionally, some materials have multiple tubes, allowing for assessment of accuracy and precision spatially within the phantom. The goals of this study were to establish the accuracy and precision of ADC measures across 3T scanners, and determine whether ADC measures are affected by location within the breast phantom.Methods
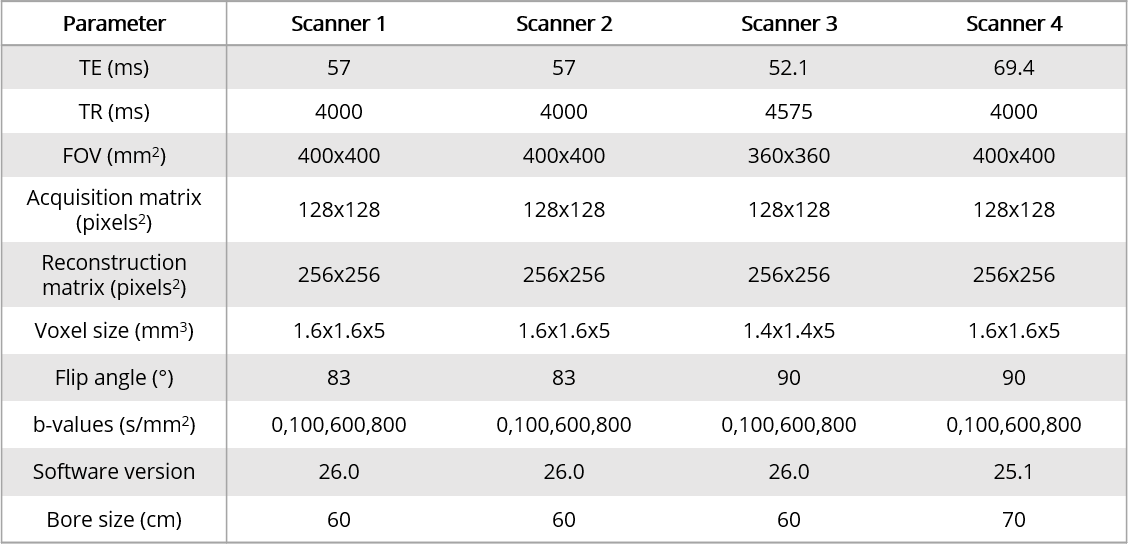
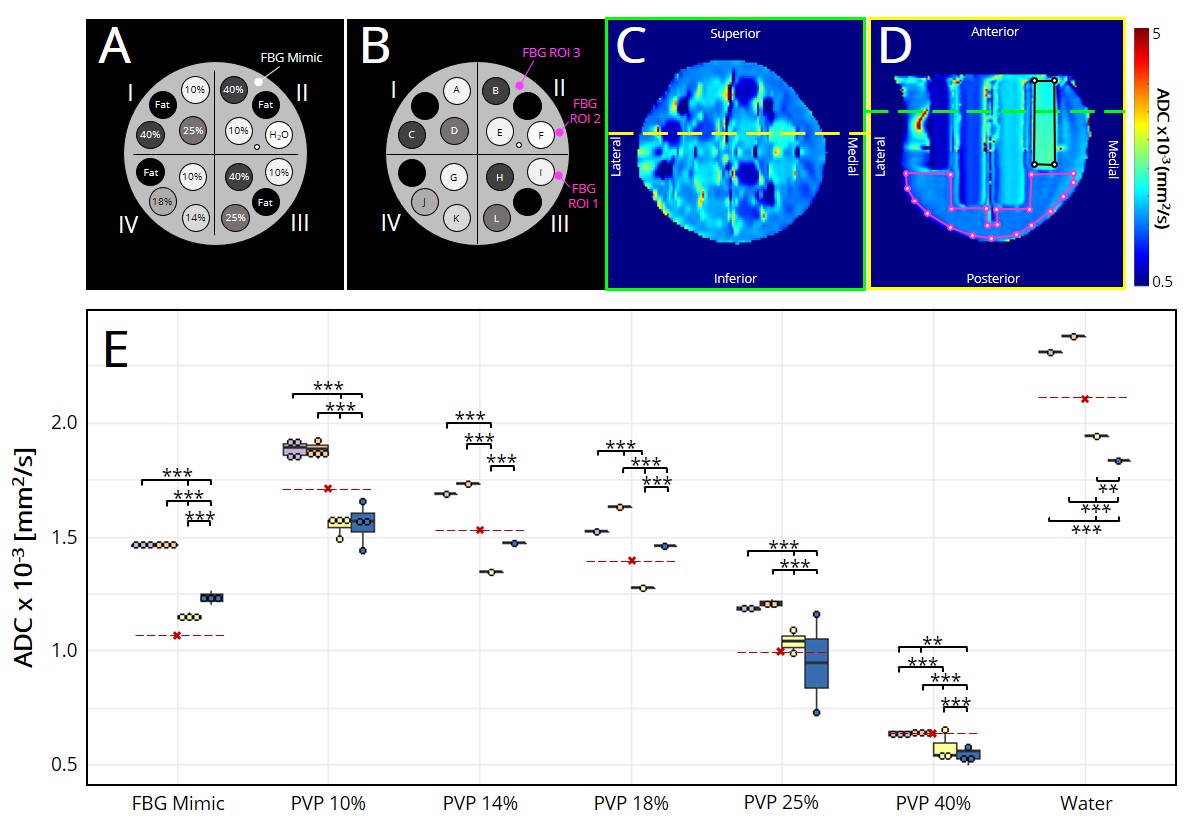
The breast phantom6 was scanned using a breast array coil in four different 3T MRI scanners (MR750, GE Healthcare, Milwaukee, Wisconsin, USA). Importantly, scanner 4 was a wide-bore scanner. Pulse sequence parameters are indicated in Table 1.All data were collected with spectral attenuated inversion recovery (SPAIR) fat suppression and array coil spatial sensitivity encoding (ASSET) with parallel imaging. Positive and negative phase encoding trajectories were acquired at b=0s/mm2 to correct for distortions using the reverse polarity gradient method.7 After distortion correction, ADC maps were estimated. Regions of interest (ROIs) were manually drawn on the centermost slice of each tube containing either water or varying concentrations (10-40%) of polyvinylpyrrolidone (PVP) using MATLAB (R2019b, MathWorks, Natick, Massachusetts, USA) to assess ADC values (Fig. 1A-D). Each material’s ADC values were also normalized by the estimated ADC of water to account for temperature variation. Three additional ROIs were drawn on the interstitial fluid with properties mimicking fibroglandular (FBG) tissue. The phantom was divided into quadrants and tubes were labeled as shown in Fig. 1B.
Coefficients of variation (CV) were calculated for each scanner averaging across tubes and each tube location averaging across scanners. Statistical analysis was performed using R statistical programming (R Foundation for Statistical Computing, Vienna, Austria). All results are reported as mean and standard deviation. Two-way repeated measures analysis of variance (ANOVA) tests were used to evaluate main effects of scanners and tube locations (repeats), followed by Tukey’s pairwise comparisons. Significance was set at p<0.05.
Results
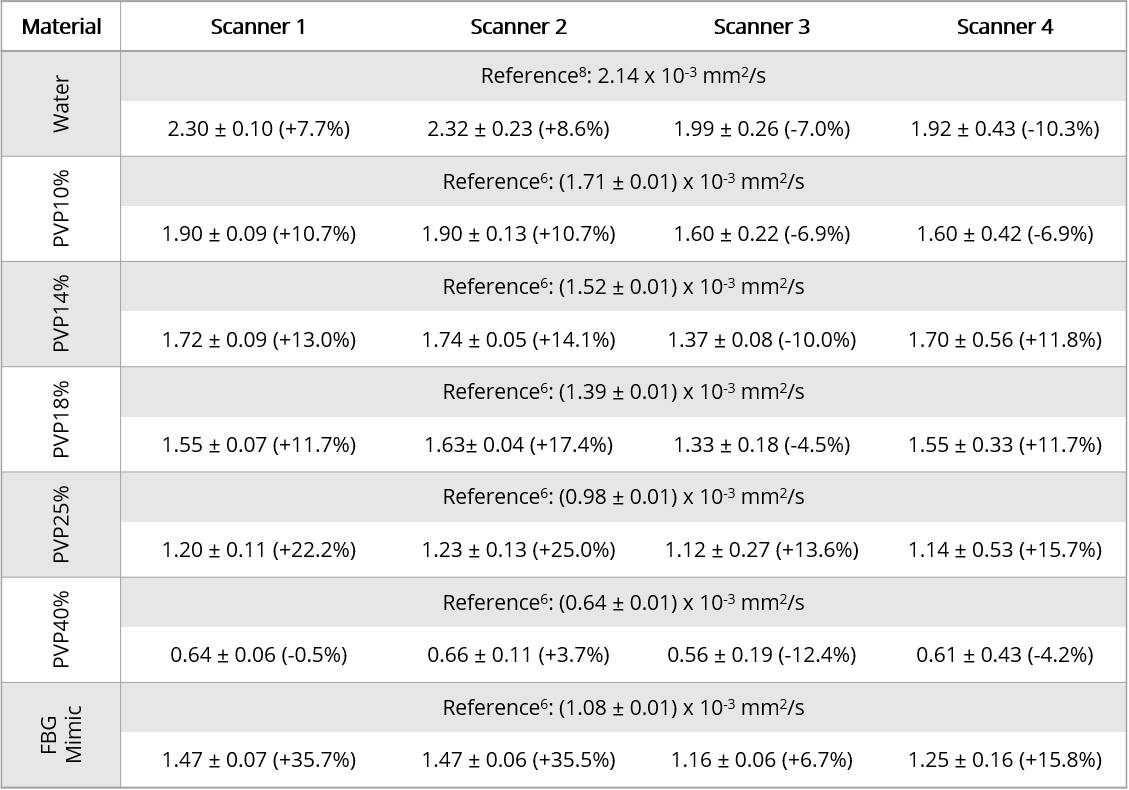
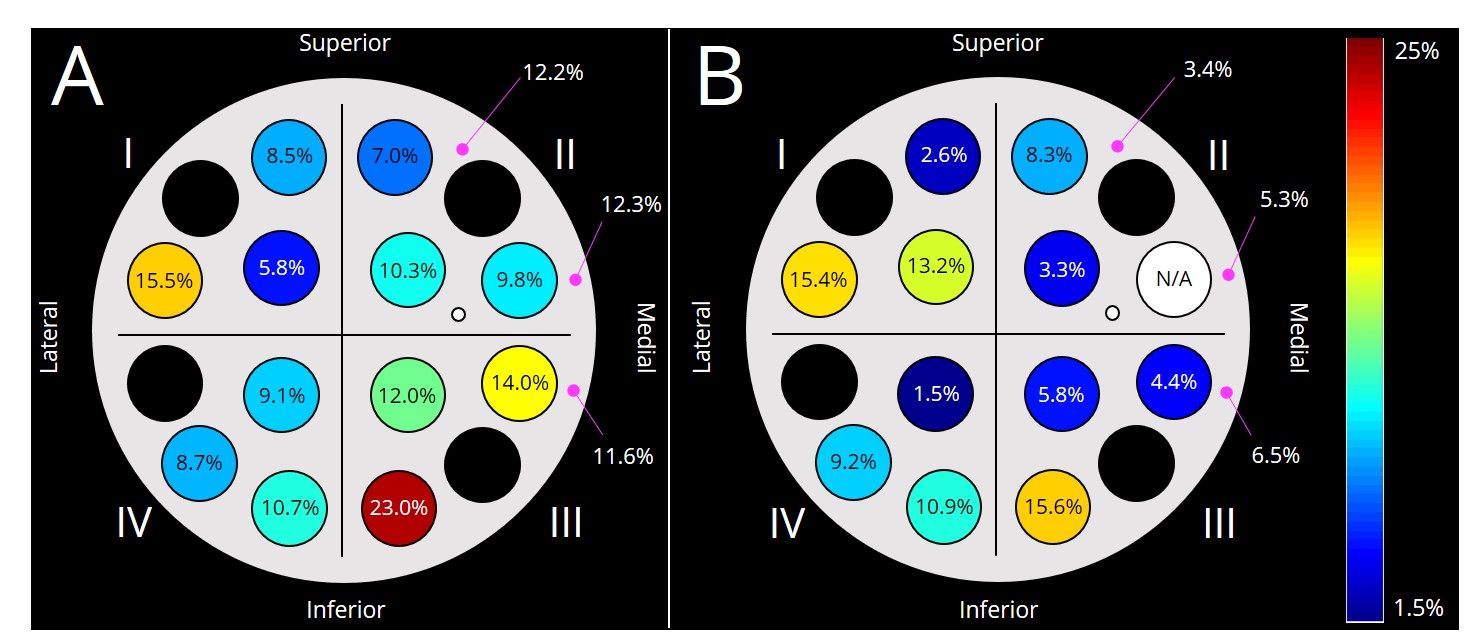
Generally, scanners 1 and 2 had higher (p<0.05) ADC values for each material compared to scanners 3 and 4 (Fig. 1E, Table 2). Further, ADC values from scanners 3 and 4 were also different (p<0.05) from each other. Data from scanner 3 yielded the smallest (p<0.05) ADC values compared to all other scanners. The percent difference between our ADC measurements and reference values was <20% for most tubes and scanners, while PVP 25% and fibroglandular mimic had the highest errors (13.6-25.0% and 6.7-35.7%, respectively) across all scanners (Table 2).Normalization of ADCs to water reduced overall variation across scanners, but not significantly (p=0.16). The CV of absolute ADC values (Fig. 2A) and CV of ADCs normalized to water for each scanner (Fig. 2B) ranged from 5.8%-23.0% and 1.5-15.6%, respectively. Overall, Quadrant III and Quadrant I had the highest variability for absolute and normalized ADCs, respectively. Within scanners, fibroglandular mimic and PVP 25% had the lowest and highest variability, respectively (Table 3). For each material, the wide-bore scanner (#4) had the highest CV.
Discussion and Conclusions
The median percent difference between estimated and reference ADC values was 11.2% (range 0.5-35.7%). A potential source of variation may be the use of clinical scanners in the present study, while reference values6 were estimated from images collected with a small-bore pre-clinical MRI system. Median inter-scanner variation was 10.0% (range 5.8-23.0%), and was further improved after normalization by the mean ADC for water for each scanner (median 8.3%, range 1.5-15.6%). The largest variation was observed in Quadrant III (medial/inferior) prior to normalization, but was then highest in Quadrant I (lateral/superior) after normalization. Importantly, the wide-bore scanner 4 resulted in the largest variability in ADC values for a given material overall, possibly due to the presence of greater distortion artifacts. Data collection strategies that reduce the magnitude of the initial distortion artifact may contribute to improving quantitative DWI accuracy and precision.In conclusion, the overall accuracy and precision of DWI estimates was >88%. Precision was further improved when normalized by an internal reference, suggesting that using an external water phantom in breast MRI protocols may benefit clinical practice. Future work is needed to investigate the utility of including a reference phantom to improve DWI accuracy in-vivo. Spatially dependent ADC heterogeneity has been previously demonstrated in other phantom studies.9,10 Together with our results, these data highlight the necessity to investigate the potential effects of tumor location on quantitative breast MRI.
Acknowledgements
GE Healthcare and the California Breast Cancer Research Program.References
1. DeSantis CE, Ma J, Gaudet MM, et al. Breast cancer statistics, 2019. CA A Cancer J Clin. 2019; 69: 438-51.
2. Mann RM, Cho N, Moy L. Breast MRI: State of the Art. Radiology. 2019; 292:520-36.
3. Kim SH, Cha ES, Kim HS, et al. Diffusion-weighted imaging of breast cancer: correlation of the apparent diffusion coefficient value with prognostic factors. J Magn Reson Imaging. 2009; 30:615-20.
4. Partridge SC, Zhang Z, Newitt DC, et al. Diffusion-weighted MRI Findings Predict Pathologic Response in Neoadjuvant Treatment of Breast Cancer: The ACRIN 6698 Multicenter Trial. Radiology. 2018; 289:618-27.
5. Shi R-y, Yao Q-y, Wu L-m, Xu J-r. Breast lesions: Diagnosis using diffusion weighted imaging at 1.5T and 3.0T—Systematic review and meta-analysis. Clin Breast Cancer. 2018;18:e305–e320.
6. Keenan KE, Wilmes LJ, Aliu SO, et al. Design of a breast phantom for quantitative MRI. J Magn Reson Imaging. 2016; 44:610-619.
7. Holland D, Kuperman JM, Dale AM. Efficient correction of inhomogeneous static magnetic field-induced distortion in Echo Planar Imaging. Neuroimage. 2010; 50:175-83.
8. Tofts PS, Lloyd D, Clark CA, et al. Test liquids for quantitative MRI measurements of self-diffusion coefficient in vivo. Magn Reson Med. 2000; 43:368-74.
9. Keenan KE, Peskin AP, Wilmes LJ, et al. Variability and bias assessment in breast ADC measurement across multiple systems. J Magn Reson Imaging. 2016 44:846-55.
10. Malyarenko D, Galbán CJ, Londy FJ, et al. Multi-system repeatability and reproducibility of apparent diffusion coefficient measurement using an ice-water phantom. J Magn Reson Imaging. 2013; 37:1238-46.
Figures