1121
A Parsimonious Assessment of Breast Density Classes from Quantitative, AI-based FGT Volume Segmentations1Radiology and Biomedical Imaging, University of California San Francisco, San Francisco, CA, United States, 2Center for Intelligent Imaging, University of California San Francisco, San Francisco, CA, United States
Synopsis
Given its potential importance as a biomarker of breast cancer risk, a reliable and objective quantitative measurement of Fibroglandular tissue (FGT) with limited intra or inter-rater variability will be invaluable in clinical practice. Currently, the amount of FGT in breast MRIs is reported via a 4-level qualitative system. We investigate the relationship between these classes and the amount of FGT, obtained via deep-learning segmentations. We find that the distribution of FGT in these classes deviates significantly from quartiles, but more uniform distributions can be achieved by emulating the radiologist’s workflow during clinical reporting.
Introduction
Mammographic breast density is a well-known risk factor for the development of breast cancer and it correlates with the amount of Fibroglandular tissue (FGT) on breast MRI1. The American College of Radiology suggests a four-level gradient for breast density reporting, going from almost entirely fat to extreme fibroglandular. Thus far, the lack of robust volume-based breast density data has precluded associating these classes with exact percentage density ranges2, resulting in widespread inter and intra-observer disagreements during the classification process3. The advent of deep learning (DL) has led to fast, autonomous, and often times interpretable inference models that accurately measure whole breast, fibroglandular tissue and background parenchymal enhancement (BPE) volumes4–8, opening the door for the establishment of such a relationship.In this work we analyze perspective data from 401 patients to investigate how quantitative FGT amounts, evaluated via DL segmentation models, relate to the qualitative FGT categories assigned by a radiologist at time of examination. We show that the four qualitative classes deviate considerably from the anticipated quartile density ranges and that, for each class, the distribution of densities overlaps significantly with that of other classes. We provide possible mechanisms explaining this behavior and suggest alternatives to ameliorate it.
Methods
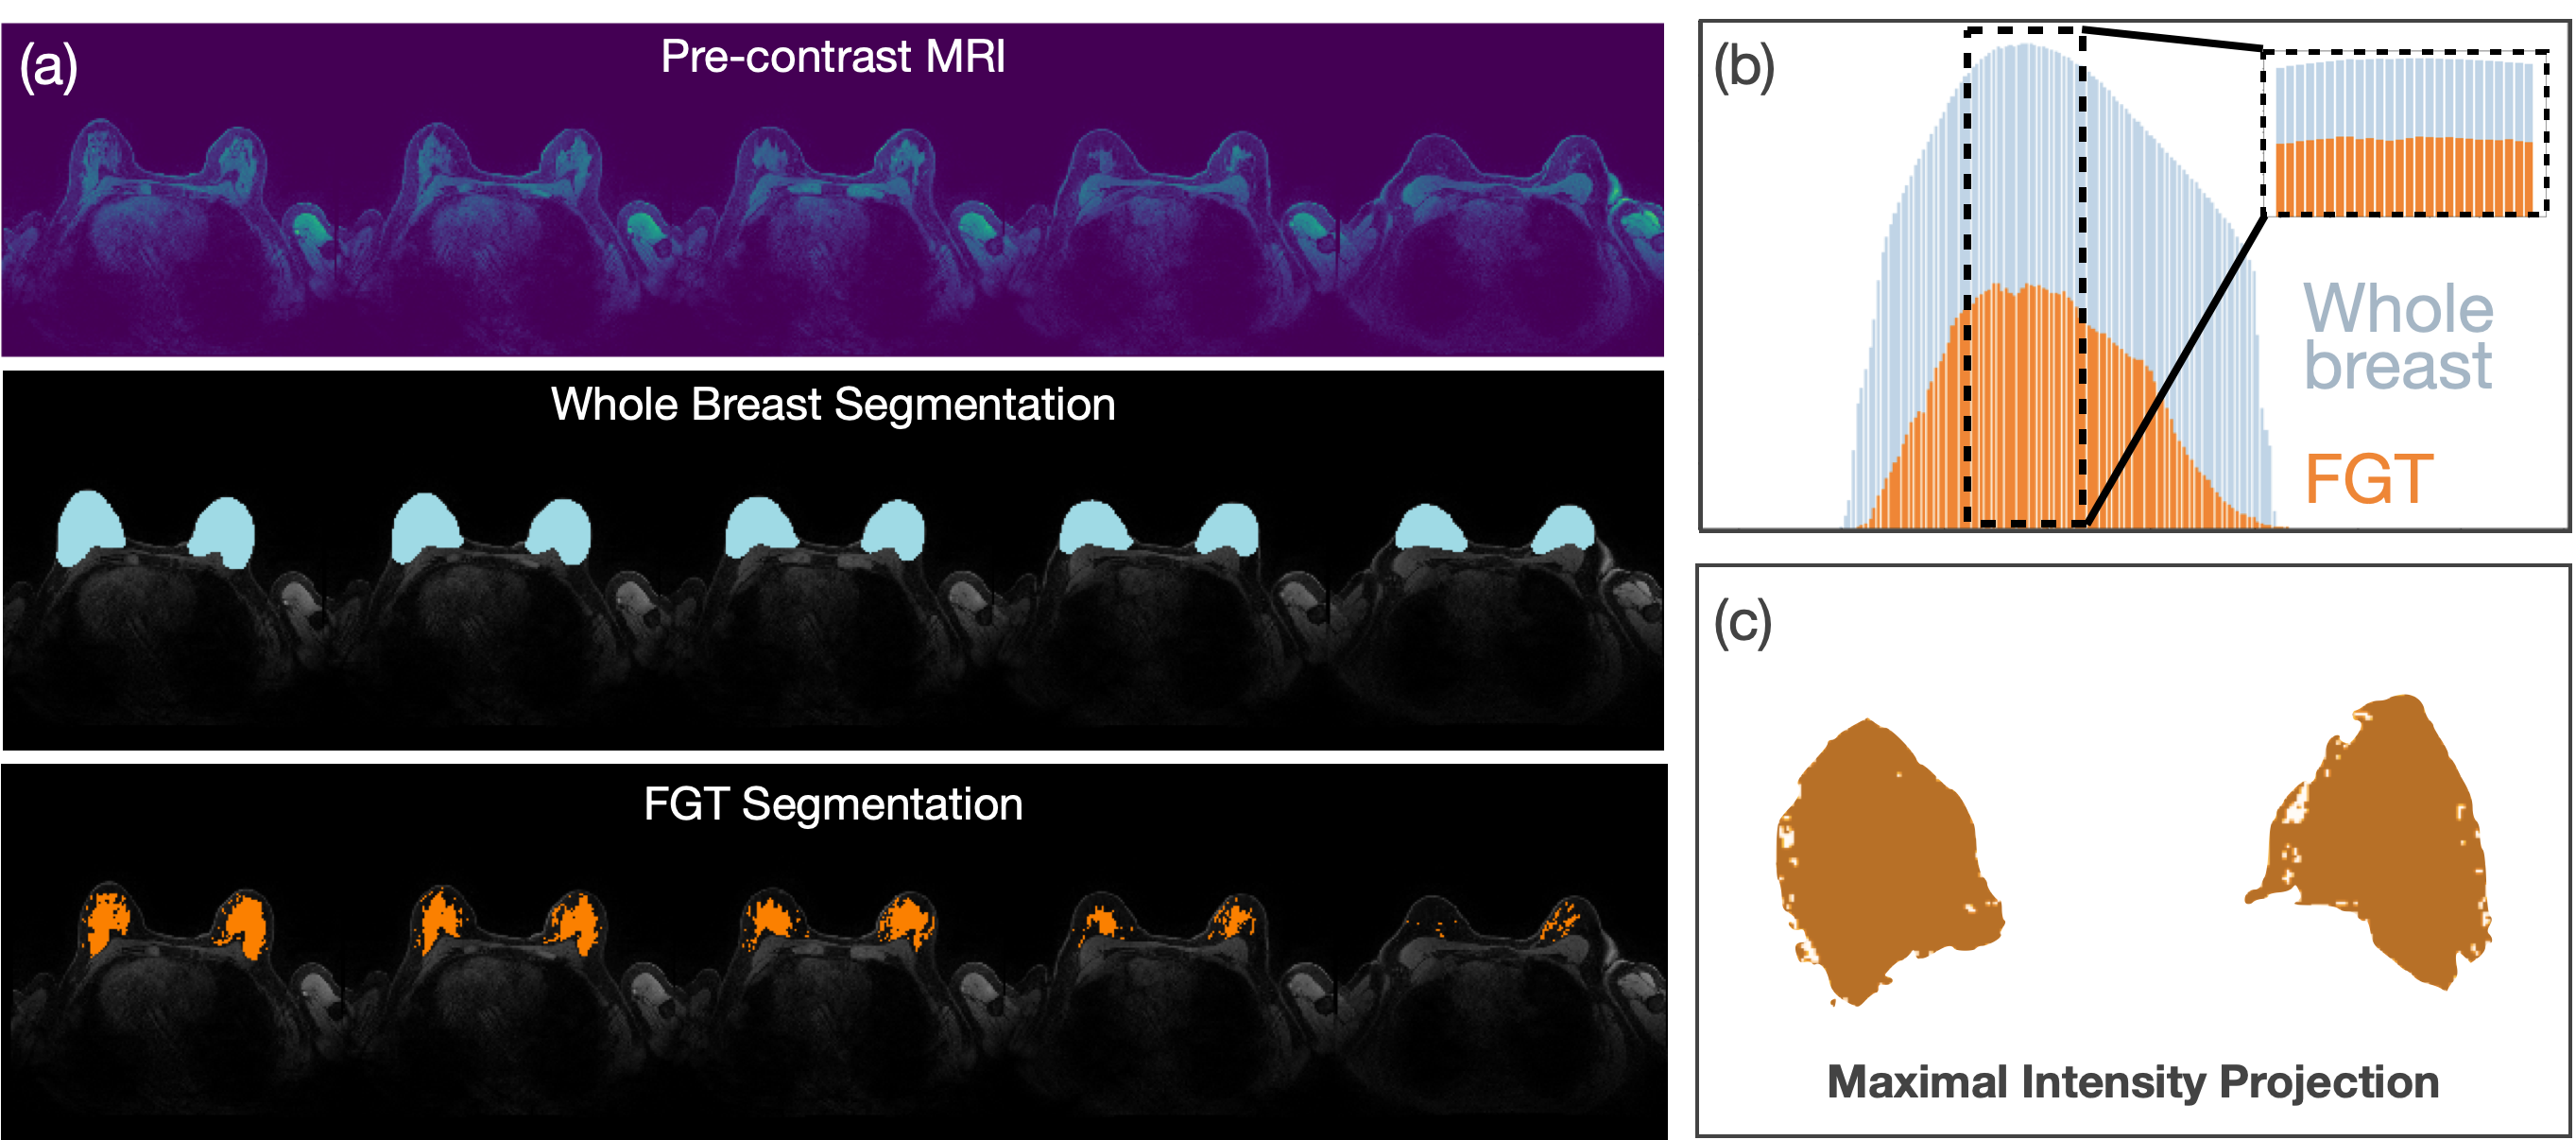
AI segmentations via U-Net. FGT and whole breast segmentations were performed using standard Encoder-Decoder architecture, available from NVIDIA’s Clara-Train platform9. 157 3D pre-contrast MRI input and corresponding ground truth segmentation masks were pre-processed to have uniform resolution (1x1x1mm3), normalized to have zero mean and unit standard deviation and split into training (80%) and validation (20%) sets. Training data was augmented by random flips and cropping. Ground truth for training the FGT segmentation model was derived from a previously established, semi-automated fuzzy c-means clustering algorithm10, whereas whole breast segmentations were performed manually. Both models were trained using DICE coefficients. Training was performed on 4 GPUs (Tesla V100). FGT ratio methods. Once FGT and whole breast volumes were computed, three methods of volume ratio calculations were compared: 1) simple density, where a ratio of total FGT to whole breast volume was computed over all slices; 2) threshold-based density, where – in an attempt to mimic the radiologist’s visual ROIs assessment – only slices whose FGT segmentation exceeded 90% of the largest FGT slice were considered; and 3) maximum intensity projection density, where segmentations across all slices were projected onto a 2-dimensional array prior to the density calculation. Class extraction from radiology reports. Each MRI exam was assigned to one of four FGT amount classes based on the presence of the ACR classification term in the patient’s radiology report. Density-to-class correspondence. We computed histograms corresponding to the range of densities observed in each FGT amount class. The amount of histogram overlap between classes was used to establish which FGT method yielded the greatest class separability.Results
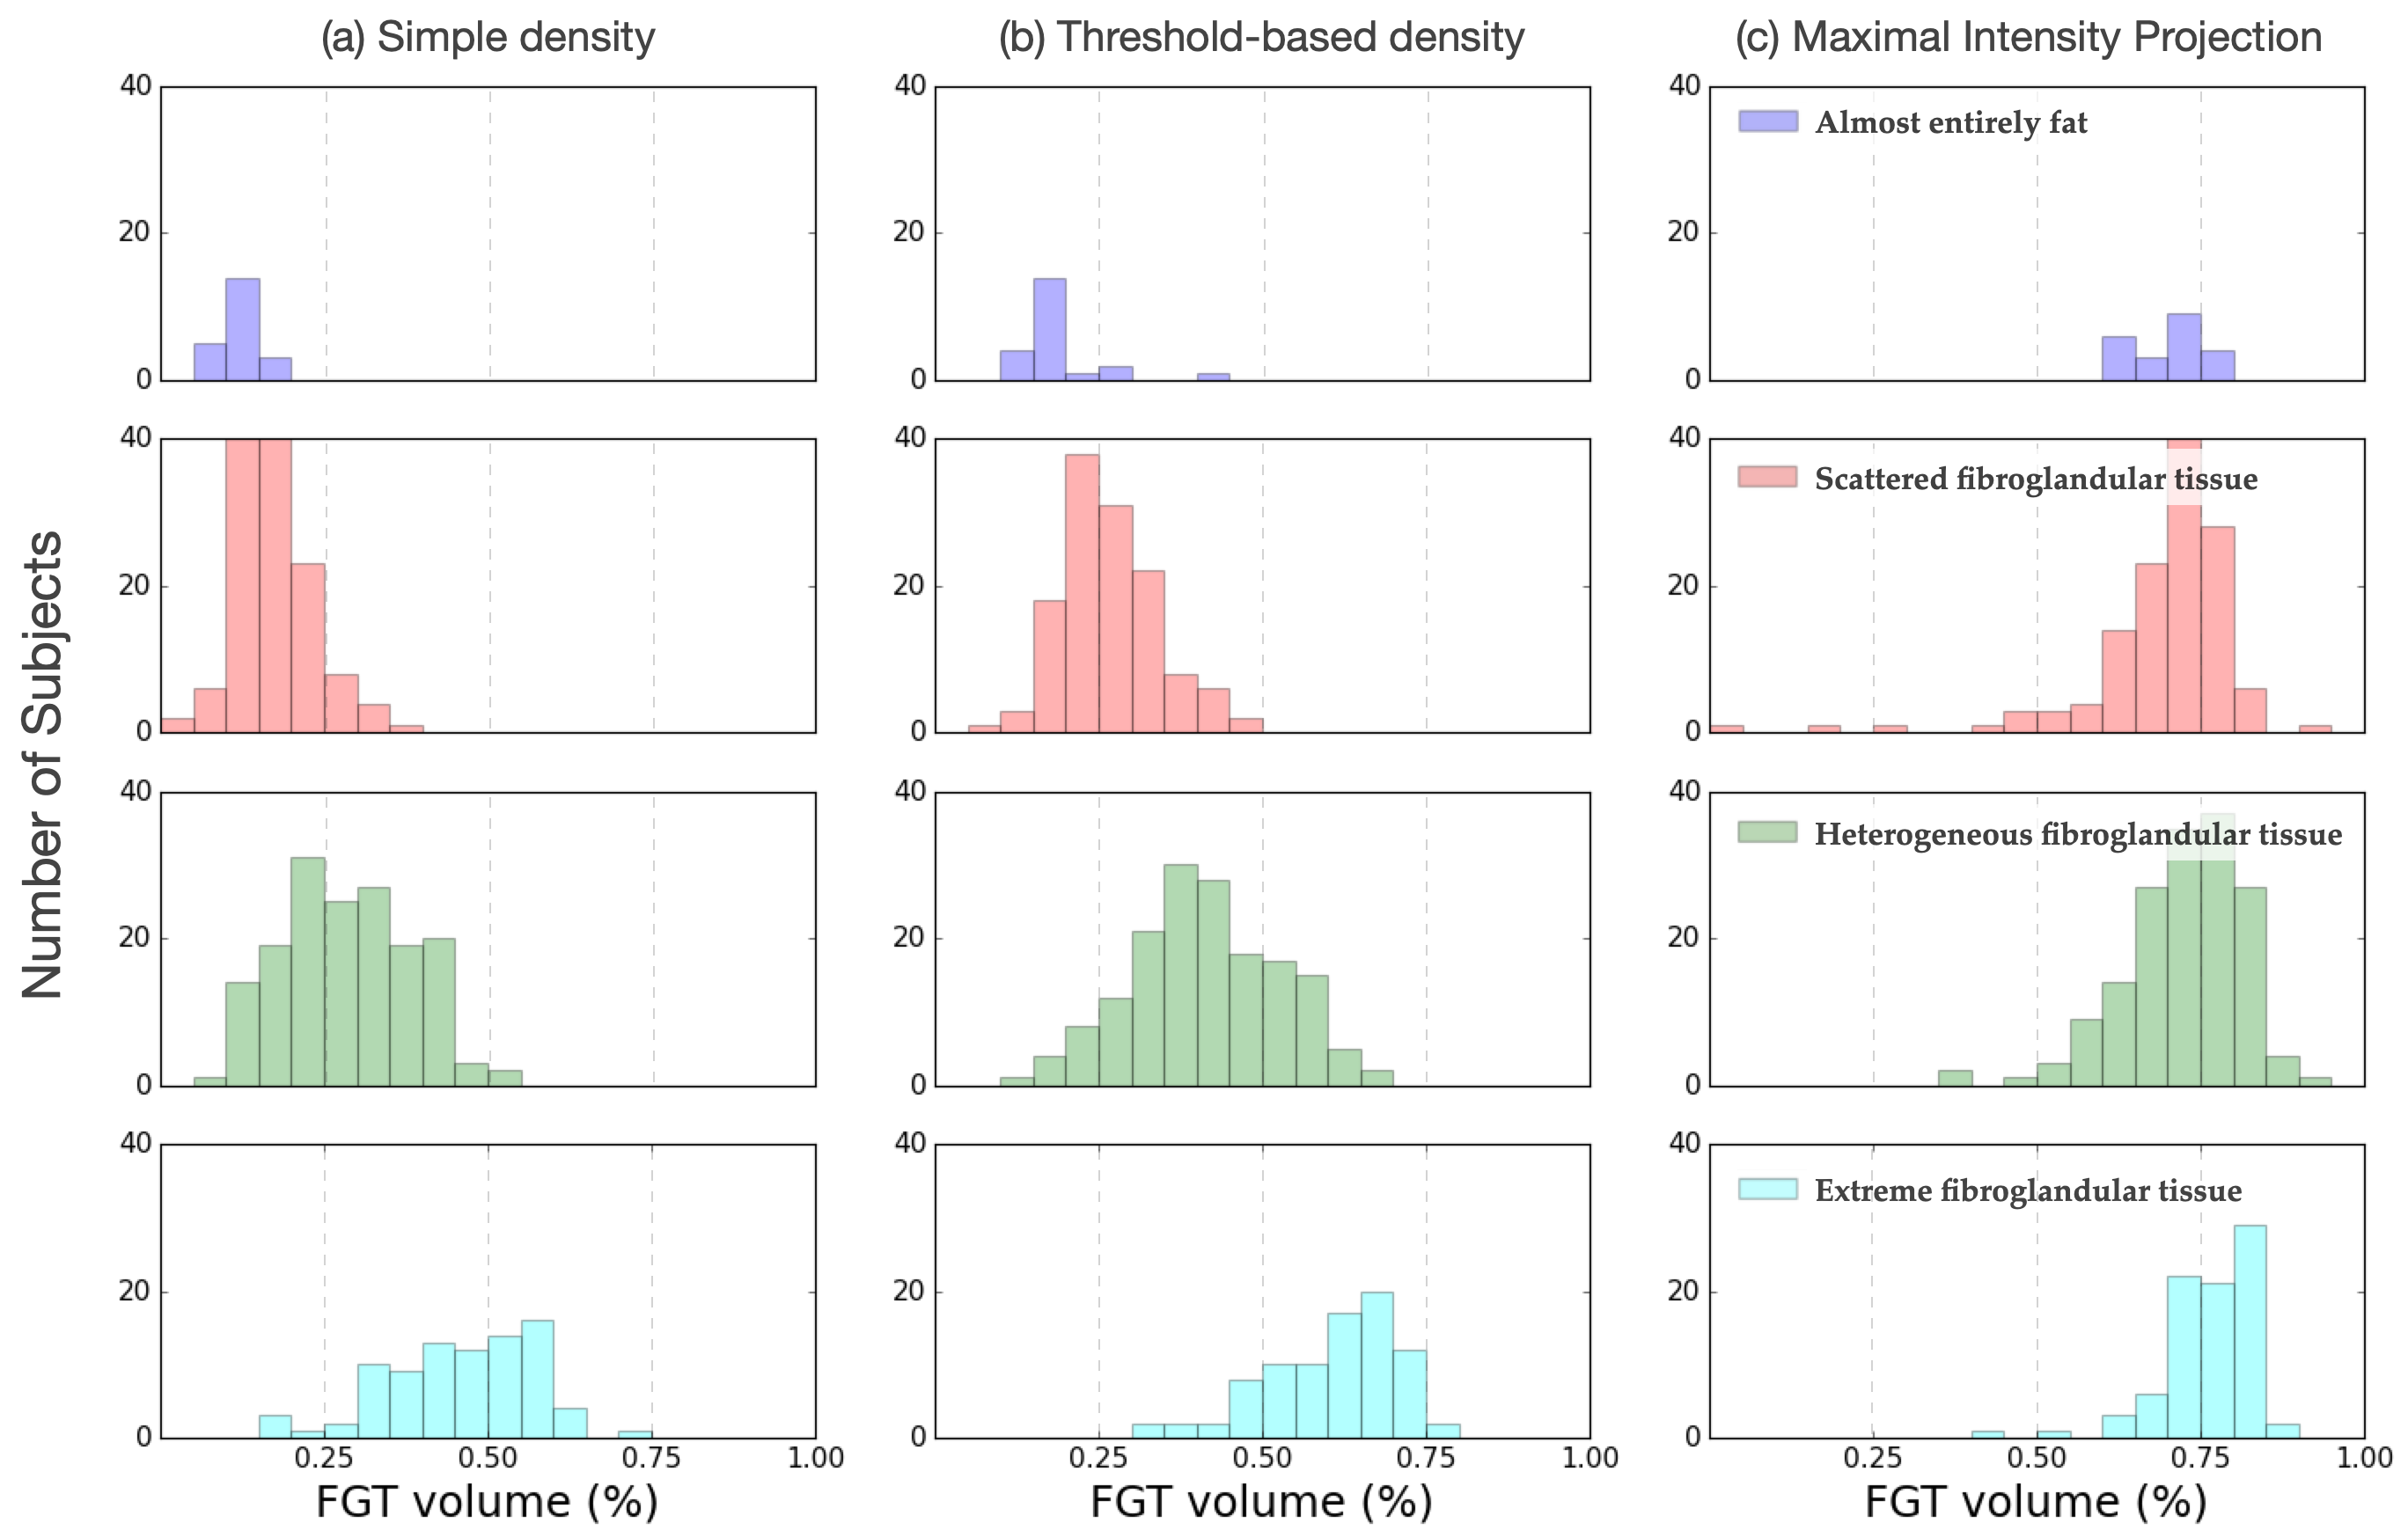
U-Net shows good Whole Breast and FGT segmentation quality. U-Net trained on 125 images to segment whole breast and FGT volumes achieved validation DICE mean (standard deviation) scores of 0.62(0.05) and 0.82(0.13), respectively. Visual inspection of the validation results revealed that a majority of the images had an excellent agreement with ground truth for both whole breast and FGT segmentations. Maximal observed density is lower than 75%. Using the simple density measurement, the largest FGT density observed in this cohort was 71% (See Fig. 2a). This result suggests that the naïve assignment of four identical density quartiles to the qualitative-defined classes might not be practical, since most of the range assigned for the last class will remain unused. Threshold-based density yields the best class segregation. The simple density measurement yielded a significant overlap between FGT distributions for different classes with the “extreme fibroglandular tissue” class showing the highest variance, with density values sometimes achieving surprising values as low as 17%. Visual inspection of these cases revealed that, despite a significant amount of FGT being contained in the center slices, slices away from the center were mostly free of FGT, quickly skewing the FGT ratio towards small values. To mitigate this issue, we recalculated the density via a threshold-based approach, only considering slices whose FGT area exceeded the highest FGT slice by 90% (Fig. 1b). When using this method, histograms for each of the four classes showed visibly higher separability (Fig. 2b). When a maximal intensity projection method was used, the FGT amounts for all classes shifted towards high values, decreasing their dynamic range and essentially eliminating the separability between FGT amount categories (Fig. 2c).Discussions & Conclusions
Given its potential importance as a biomarker of breast cancer risk, a reliable and objective quantitative measurement of FGT will be invaluable in clinical practice. This work shows that deep learning can be used for FGT quantification in breast MRIs and that a parsimonious relationship between these quantitative values and qualitative FGT classes is possible, although unlike to involve simple quartile splits or volume ratio calculations.Acknowledgements
We thank Alex Anh-Tu Nguyen, David C. Newitt, Dr Bonnie N. Joe and Dr. Nola M. Hylton at UCSF for providing data used for the FGT and whole breast segmentation training.References
(1) Boyd, N. F.; Martin, L. J.; Bronskill, M.; Yaffe, M. J.; Duric, N.; Minkin, S. Breast Tissue Composition and Susceptibility to Breast Cancer. JNCI Journal of the National Cancer Institute 2010, 102 (16), 1224–1237. https://doi.org/10.1093/jnci/djq239.
(2) Edwards, S. D.; Lipson, J. A.; Ikeda, D. M.; Lee, J. M. Updates and Revisions to the BI-RADS Magnetic Resonance Imaging Lexicon. Magnetic Resonance Imaging Clinics of North America 2013, 21 (3), 483–493. https://doi.org/10.1016/j.mric.2013.02.005.
(3) Sprague, B. L.; Conant, E. F.; Onega, T.; Garcia, M. P.; Beaber, E. F.; Herschorn, S. D.; Lehman, C. D.; Tosteson, A. N. A.; Lacson, R.; Schnall, M. D.; Kontos, D.; Haas, J. S.; Weaver, D. L.; Barlow, W. E.; on behalf of the PROSPR Consortium. Variation in Mammographic Breast Density Assessments Among Radiologists in Clinical Practice: A Multicenter Observational Study. Annals of Internal Medicine 2016, 165 (7), 457. https://doi.org/10.7326/M15-2934.
(4) Ivanovska, T.; Jentschke, T. G.; Daboul, A.; Hegenscheid, K.; Völzke, H.; Wörgötter, F. A Deep Learning Framework for Efficient Analysis of Breast Volume and Fibroglandular Tissue Using MR Data with Strong Artifacts. International Journal of Computer Assisted Radiology and Surgery 2019, 14 (10), 1627–1633. https://doi.org/10.1007/s11548-019-01928-y.
(5) Zhang, Y.; Chen, J.-H.; Chang, K.-T.; Park, V. Y.; Kim, M. J.; Chan, S.; Chang, P.; Chow, D.; Luk, A.; Kwong, T.; Su, M.-Y. Automatic Breast and Fibroglandular Tissue Segmentation in Breast MRI Using Deep Learning by a Fully-Convolutional Residual Neural Network U-Net. Academic Radiology 2019, 26 (11), 1526–1535. https://doi.org/10.1016/j.acra.2019.01.012.
(6) Ha, R.; Chang, P.; Mema, E.; Mutasa, S.; Karcich, J.; Wynn, R. T.; Liu, M. Z.; Jambawalikar, S. Fully Automated Convolutional Neural Network Method for Quantification of Breast MRI Fibroglandular Tissue and Background Parenchymal Enhancement. Journal of Digital Imaging 2019, 32 (1), 141–147. https://doi.org/10.1007/s10278-018-0114-7.
(7) Lehman, C. D.; Yala, A.; Schuster, T.; Dontchos, B.; Bahl, M.; Swanson, K.; Barzilay, R. Mammographic Breast Density Assessment Using Deep Learning: Clinical Implementation. Radiology 2019, 290 (1), 52–58. https://doi.org/10.1148/radiol.2018180694.
(8) van der Velden, B. H. M.; Janse, M. H. A.; Ragusi, M. A. A.; Loo, C. E.; Gilhuijs, K. G. A. Volumetric Breast Density Estimation on MRI Using Explainable Deep Learning Regression. Scientific Reports 2020, 10 (1). https://doi.org/10.1038/s41598-020-75167-6.
(9) Myronenko, A. 3D MRI Brain Tumor Segmentation Using Autoencoder Regularization. arXiv:1810.11654 [cs, q-bio] 2018.
(10) Comparison of Segmentation Methods in Assessing Background Parenchymal Enhancement as a Biomarker for Response to Neoadjuvant Therapy. Tomography 2020, 6 (2), 101–110. https://doi.org/10.18383/j.tom.2020.00009.
Figures