1119
Early prediction of pathologic complete response to neoadjuvant systemic therapy for triple-negative breast cancer using deep learning1Imaging Physics, The University of Texas MD Anderson Cancer Center, Houston, TX, United States, 2Breast Imaging, The University of Texas MD Anderson Cancer Center, Houston, TX, United States, 3Breast Medical Oncology, The University of Texas MD Anderson Cancer Center, Houston, TX, United States, 4Cancer Systems Imaging, The University of Texas MD Anderson Cancer Center, Houston, TX, United States
Synopsis
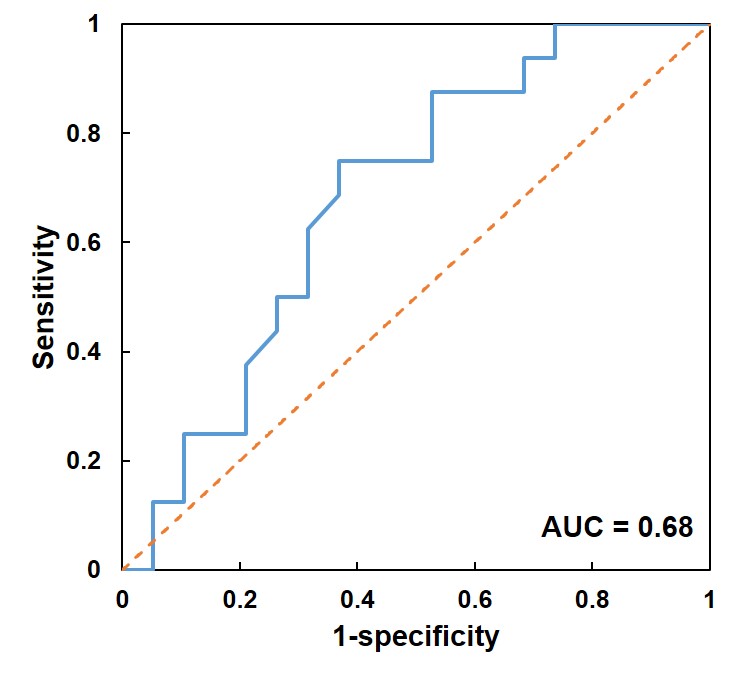
Prediction of response to neoadjuvant systemic therapy for triple-negative breast cancer is important for patient management. Here we constructed a deep learning convolutional and recursive neural network ensemble for early prediction of pathologic complete response utilizing pre-treatment DCE and DWI breast MRIs. Images from 135 patients were partitioned into training/validation/testing groups with the ratio of 80/20/35. For the testing group, the network achieved an accuracy of 69%, with the sensitivity of 75% and specificity of 63%. The area under the receiver operating characteristic curve was 0.68.
Introduction
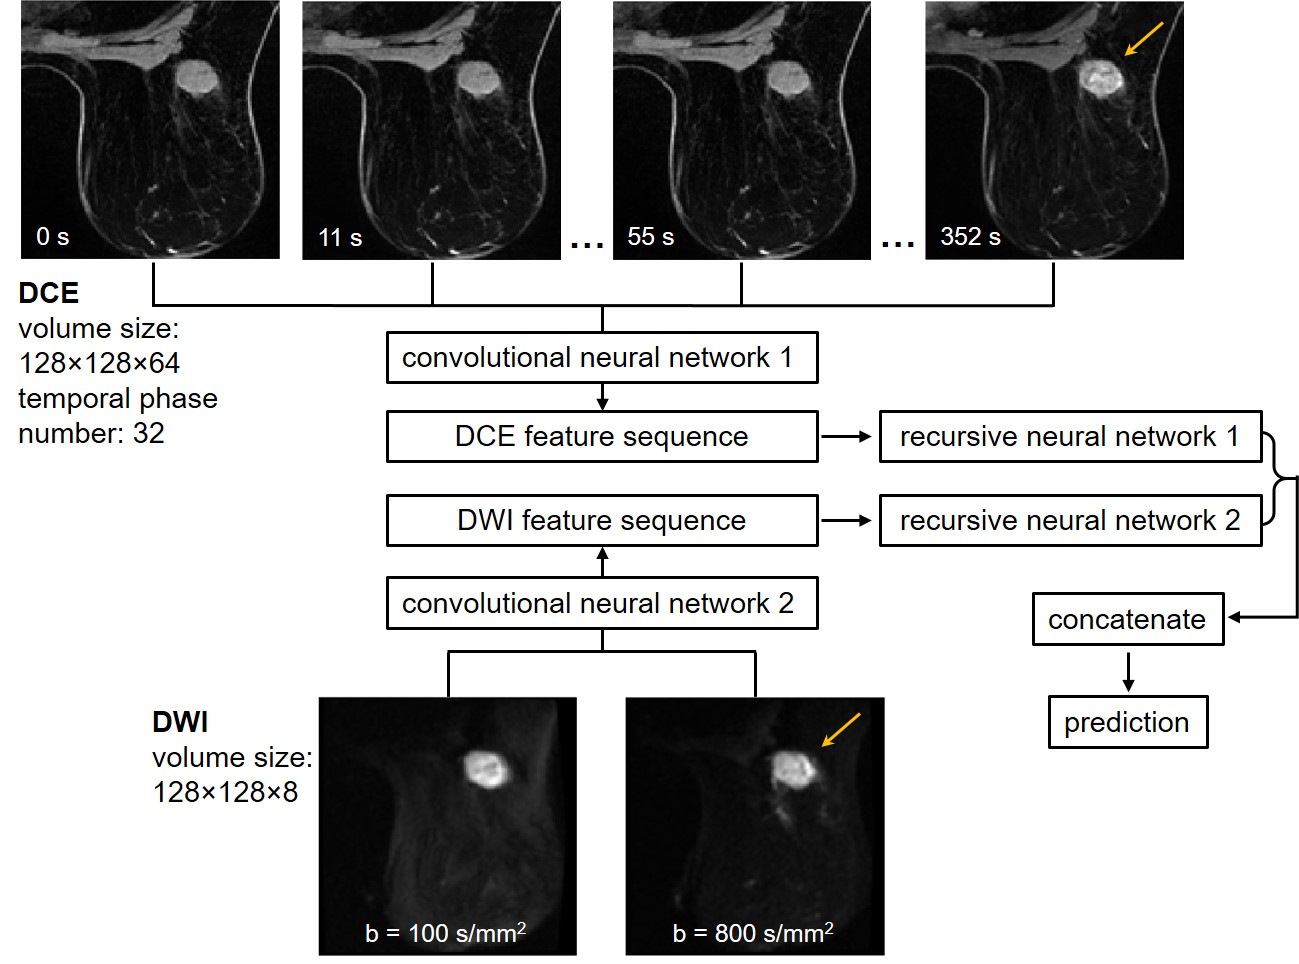
Triple-negative breast cancers (TNBCs) accounts for approximately 12-17% of breast cancers.1 It is characterized by the lack of expression of estrogen receptor, progesterone receptor, and human epidermal growth factor receptor type 2 and has relatively poor outcomes.2 Neoadjuvant systemic therapy (NAST) administered before surgery is effective for a subgroup of TNBC patients: around 40-50% can achieve pathologic complete response (pCR) and have excellent outcome.3 There is an unmet need to develop imaging predictors of pCR after NAST in TNBCs early in the course of therapy, which may identify a group of patients where additional toxic chemotherapy is unnecessary.4,5 Here, we constructed a deep learning ensemble to predict pCR for a TNBC cohort using DCE and DWI breast MRIs acquired before the initiation of the treatment. In the ensemble, convolution neural networks (CNNs) first extracted features from the DCE and DWI, respectively; then the features were input to the recursive neural networks (RNNs) for pCR prediction (Figure 1). Using both the spatial and sequential features of the quantitative MRIs, we hypothesized that the ensemble can potentially improve pCR prediction for TNBC patients.Methods
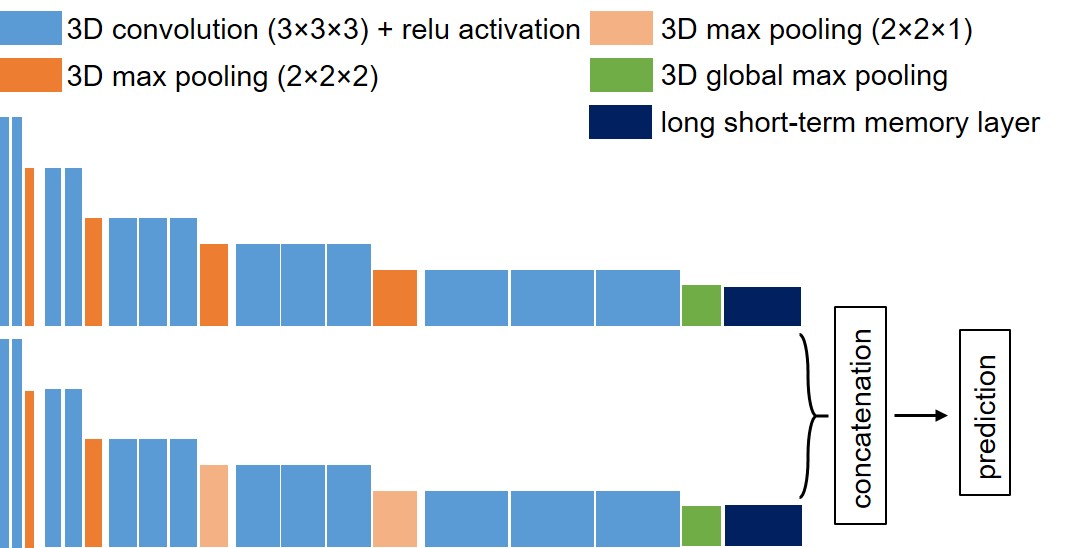
Baseline ultrafast DCE and DWI of 135 women with biopsy-confirmed TNBC enrolled in the ongoing prospective ARTEMIS clinical trial (NCT02276443) were collected. The patients underwent NAST at our institution from May 2018 to March 2020 and their pCR status was assessed by surgeical pathology: 65 had pCR and 70 had non-pCR. The patients were partitioned into three groups with the ratio of 80/20/35 for the ensemble training, internal validation, and external testing. The pCR to non-pCR ratio was controlled at around 1:1 across the three groups during patient partition to maintain a balanced weight. For the ultrafast DCE, the temporal resolution ranged from 10 to 14 s, and the number of temporal phases ranged from 32 to 61. For the DWI, the selected b-values were 100 and 800 s/mm2. All images were acquired on a GE Discovery 750w scanner using an 8-channel bilateral breast coil. Because the DWI was focused on the breast with the lesion, the DCE was aligned with the DWI and cropped to have the same field of view. The cropped imaging volumes were resized to 128×128×64 for the DCE, and to 128×128×8 for the DWI. To keep the DCEs having the same number of phases, only the first 32 phases from each patient were used. Finally, images of each temporal phase and diffusion b-value were individually normalized to the range of [0, 1].The CNNs were constructed based on the VGG16 network structure and had similar configurations for the DCE and DWI volumes.6 Three-dimensional convolution was used with a kernel size of 3×3×3. Because of the large datasets in our study and to accommodate the computing memory, we significantly decreased the numbers of output filters to 8, 16, 24, 32, and 64 for the five convolutional blocks, respectively. MaxPooling layers with the pooling size of 2×2×2 was used between each convolutional block. However, it was set to 2×2×1 between the last three convolutional blocks for the CNN processing DWI because it had fewer image slices.
The sequences of features extracted by the CNNs from the DCE and DWI were then input to the RNNs. By iterating over the sequences, RNNs can encode the information from each step of the sequence into hidden states and output a vector of features containing the sequential characters. We set the number of the output dimension to 8 for the RNNs, which we found to have the optimal performance. The RNN outputs were then concatenated for pCR prediction after a fully connected layer and softmax activation. For the binary pCR or non-pCR prediction, cross-entropy was used as the loss function, and the loss was regressed using an Adam optimizer with a learning rate of 0.0001. Detailed structures of the networks were shown in Figure 2.
Performance of the network was evaluated on the testing group using prediction accuracy. Sensitivity and specificity were also calculated. Finally, the receiver operating characteristic (ROC) curve was plotted and the area under the curve (AUC) was calculated.
Results
The TNBC cohort had a median age of 49 years (range: 26 - 79 years-old). For the testing group, the deep learning ensemble achieved an accuracy of 69%, with a sensitivity of 75% for the pCR patients and a specificity of 63% for the non-pCR patients. The ROC curve of pCR prediction was shown in Figure 3, and the AUC was 0.68.Discussion and conclusion
Using the DCE and DWI acquired prior to the initiation of the treatment, our deep learning ensemble was able to achieve a 69% accuracy for response prediction. Because of the sequential nature of DCE and DWI, RNN provides a powerful tool to model such data, after CNN feature extraction from each step’s imaging volume. Interestingly, we found that the accuracy decreased to 52% when only the DCE was used, suggesting that the DWI provided complementary information for prediction. Future work includes optimizing the network structures and collecting more patient images for network training. Additionally, mid-treatment scans will be included and it may further improve the prediction performance.Acknowledgements
No acknowledgement found.References
[1] Foulkes WD, Smith IE, and Reis-Filho JS. Triple-negative breast cancer. N Engl J Med. 2010;363:1938-1948.
[2] Dent R, Trudeau M, Pritchard KI, et al. Triple-negative breast cancer: clinical features and patterns of recurrence. Clin Cancer Res. 2007;13(15):4429-4434.
[3] Sikov WM, Berry DA, Perou CM, et al. Impact of the addition of carboplatin and/or bevacizumab to neoadjuvant once-per-week paclitaxel followed by dose-dense doxorubicin and cyclophosphamide on pathologic complete response rates in stage II to III triple-negative breast cancer: CALGB 40603 (Alliance). J Clin Oncol. 2014;33:13-21.
[4] Hylton NM, Gatsonis CA, Rosen MA, et al. Neoadjuvant chemotherapy for breast cancer: functional tumor volume by MR imaging predicts recurrence-free survival – results from the ACRIN 6657/CALGB 150007 I-SPY 1 trial. Radiology. 2016;279:44-55.
[5] El Adoui M, Drisis S, and Benjelloun M. Multi-input deep learning architecture for predicting breast tumor response to chemotherapy using quantitative MR images. Int J Comput Assist Radiol Surg. 2020;15:1491-1500.
[6] Simonyan K and Zisserman A. Very deep convolutional networks for large-scale image recognition. arXiv:1409.1556.
Figures