1116
Classification of Breast Cancer Molecular Subtypes on DCE-MRI Using Radiomics Analysis with Various Machine Learning Algorithm1Department of Radiological Sciences, University of California, Irvine, CA, United States, 2Department of Radiation Oncology, Rutgers-Cancer Institute of New Jersey, Robert Wood Johnson Medical School, New Brunswick, NJ, United States, 3Department of Radiology, E-Da Hospital and I-Shou University, Kaohsiung, Taiwan, 4Department of Medical Imaging, Taichung Tzu-Chi Hospital, Taichung, Taiwan, 5Department of Radiology, The First Affiliate Hospital of Wenzhou Medical University, Wenzhou, China
Synopsis
Two datasets were used, 107 cases for training and 94 cases for testing. Patients were classified into three subtypes: TN, HER2+, and (HR+/HER2-). Three heuristic DCE parametric maps were generated from DCE-MRI. PyRadiomics was applied to extract features. Five machine learning algorithms were implemented to build models. The classification accuracy in training dataset was 84.3%, 77.2%, 75.5%, 74.3%, 69.1% for SVM, Decision tree, LDA, KNN, Naïve Bayes, respectively. In binary classification for TN vs. Non-TN, accuracy was 91.0% in training and 88.2% in testing datasets. For HER2+ vs. HER2-, accuracy was 90.4% in training and 86.2% in testing datasets.
Introduction
Determining the molecular subtype of breast cancer is very important for choosing the appropriate treatment for each patient. As neoadjuvant chemotherapy becomes a popular treatment modality, the subtype needs to be evaluated in biopsy samples before starting therapy, which may be affected by the sampling problem and the specimen quality. The prognosis of breast cancer is different in different molecular subtypes, which needs to be considered in choosing the treatment strategy. Patients with triple-negative (TN) subtype have higher recurrence and lower survival rates, and they need more aggressive chemotherapy regardless of the tumor size [1]. Patients with HER2+ cancer need to receive targeting drugs in the regimen, including trastuzumab and pertuzumab [2]. DCE-MRI is usually performed for each patient, either for diagnosis or for pre-treatment staging. There is a lot of information contained in the images that can be used to predict the molecular subtypes, by establishing their relationship with texture, morphology, and statistics properties [3]. This study aims to differentiate three different molecular subtypes of the breast cancer: TN, HER2+, Hormonal receptor positive and HER2 negative (HR+/HER2-), using radiomics analysis with different machine learning algorithms.Introduction
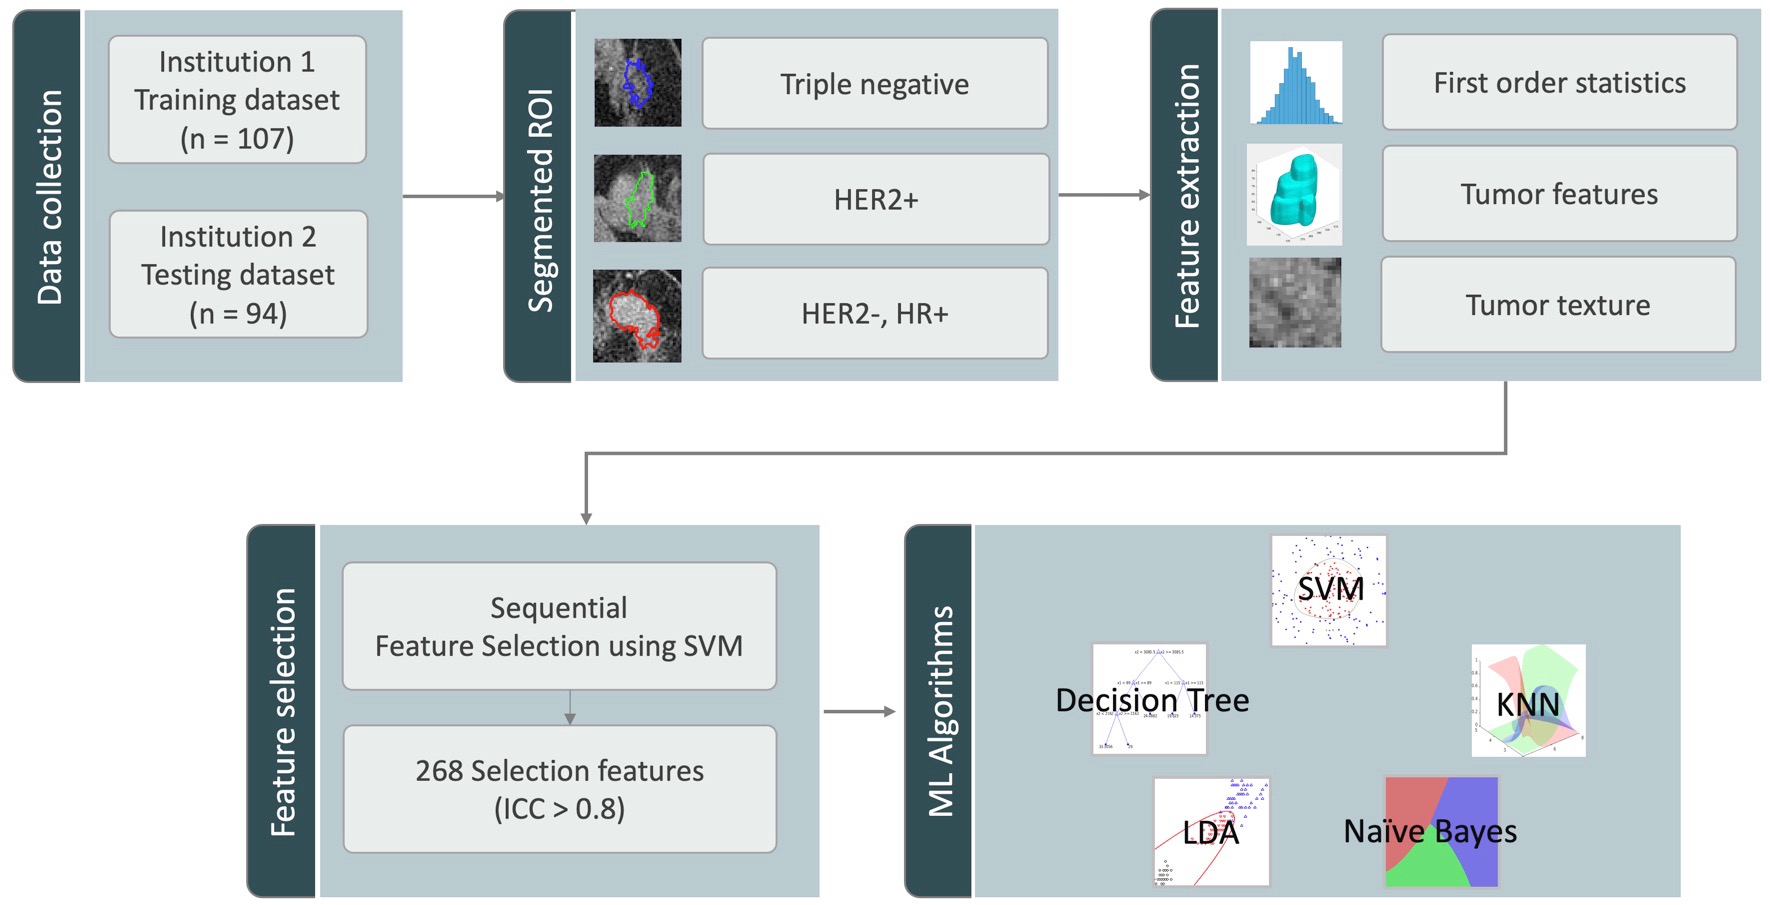
The DCE-MRI datasets acquired using two different MRI scanners (1.5T/3T) were used to train and test the radiomics model. The training dataset consisted of 67/107 (63%) HR+/HER2-, 26/107 (24%) HER2+, and 14/107(13%) TN. The testing dataset consisted of 61/94 (65%) HR+/HER2-, 23/94 (24%) HER2+, and 10/94 (11%) TN. All lesions were segmented by Fuzzy-C-means clustering algorithm [4]. Three heuristic DCE parametric maps were generated, which included Wash-in Signal Enhancement Map, Maximum Signal Enhancement Map, and Wash-out Slope Map. The 32 first order features and 75 textural features were extracted using PyRadiomics on each map, and a total of 321 parameters were obtained for each case. Only 268 features that showed intraclass correlation coefficient ³ 0.8 in two separate ROI drawing were included in the final analysis. The feature selection was performed using support vector machine (SVM). Then, five machine-learning algorithms were applied for classification: SVM with gaussian kernel, Decision Tree, K-Nearest Neighbor (KNN), Linear Discriminant Analysis (LDA), Naïve Bayes. Figure 1 shows the process of radiomics analysis. In the training dataset, the performance was evaluated using 10-fold cross-validation, and then the developed models were applied to the testing dataset to evaluate the accuracy. In addition to three-way classification, binary classification to differentiate TN vs. Non-TN and HER2+ vs. HER2- were also evaluated.Results
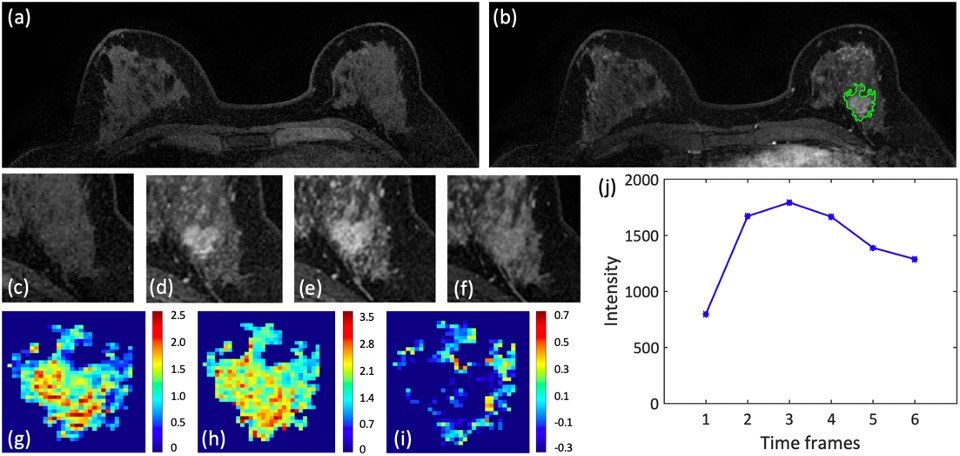
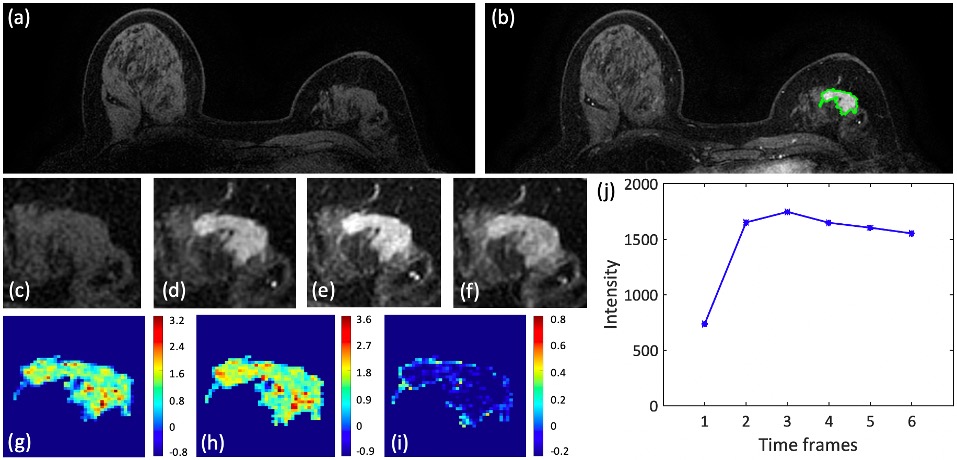
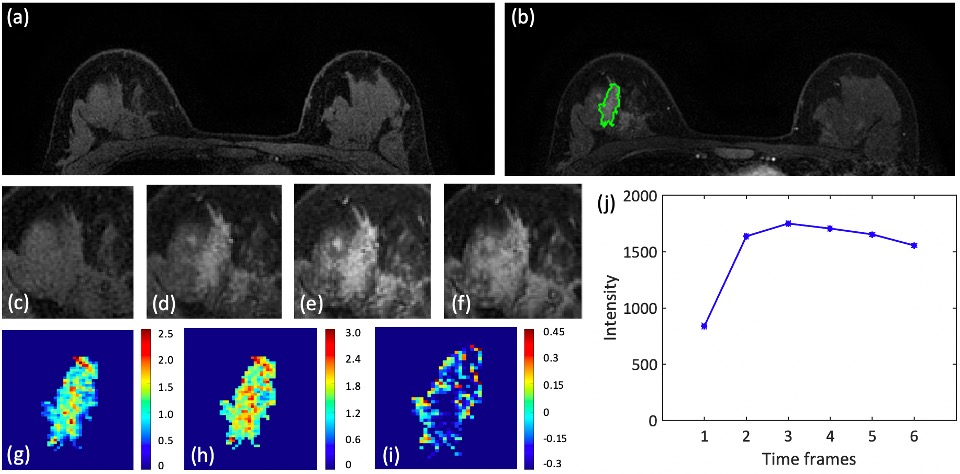
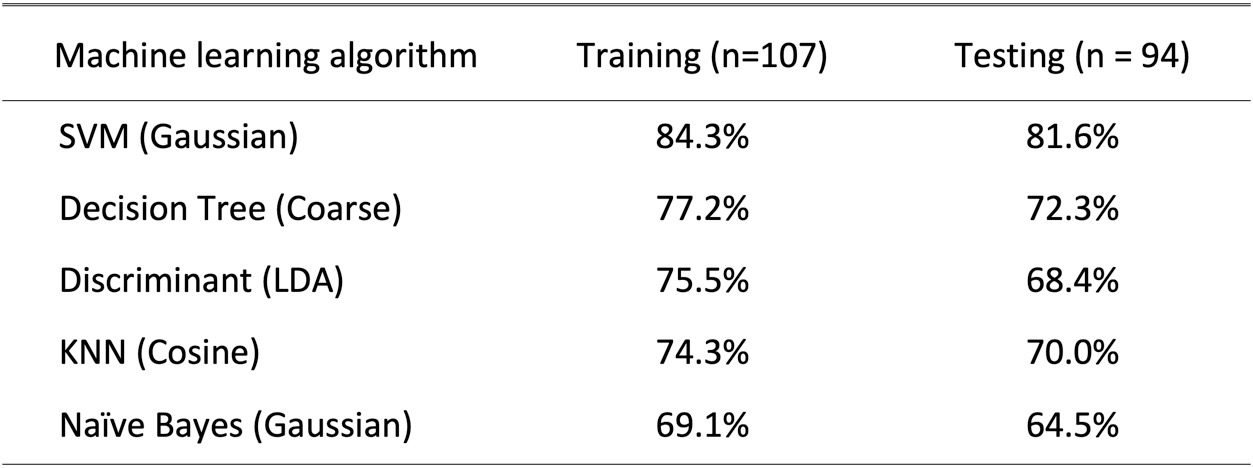
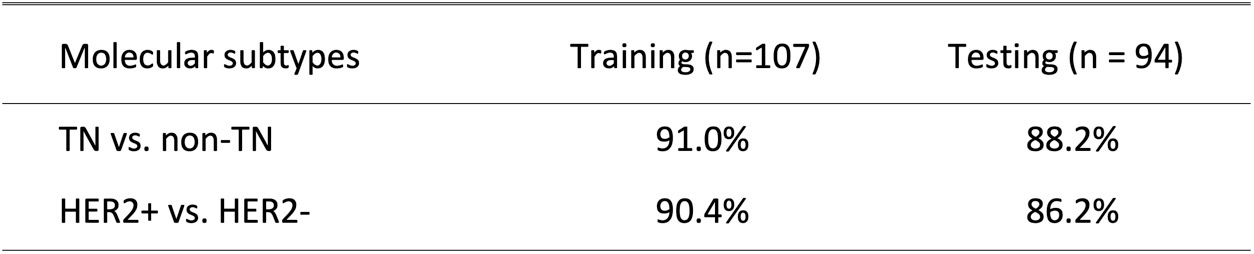
Figures 2-4 show DCE-MR images and DCE parametric maps of three case examples with TN, HER2+, and HR+/HER2- cancer with outlined tumor bounding box. Table 1 lists the classification accuracy for the Training dataset and Testing dataset with various machine learning classifiers. In the training dataset, the accuracy was 84.3%, 77.2%, 75.5%, 74.3%, and 69.1% for SVM, Decision tree, LDA, KNN and Naïve Bayes, respectively. The SVM classifier had higher accuracy than other classifiers. When the developed models were applied to the testing dataset, the classification accuracy was 81.6%, 72.3%, 68.4%, 70.0%, and 64.5% for SVM, Decision tree, LDA, KNN and Naïve Bayes, respectively. Table 2 shows the binary classification accuracy using SVM for TN vs. Non-TN and HER2+ vs. HER2-. For TN vs. Non-TN, accuracy was 91.0% in training and 88.2% in testing datasets. For HER2+ vs. HER2-, accuracy was 90.4% in training and 86.2% in testing datasets.Discussion
Radiomics analysis with machine learning algorithms are powerful methods to extract the high-dimensional tumor features that are unnoticeable to the human eyes to build classification models [5]. In this study the extracted features from DCE-MRI were used to predict molecular subtypes, because they might reflect tumor biological characteristics [6]. The classification accuracy was evaluated by using five different machine learning algorithms. SVM had the best performance, which was consistent with the reports of other studies [7]. The developed models were tested in an independent testing dataset collected using a different scanner from a different hospital. The results showed that the accuracy in the testing dataset was only slightly lower compared to the accuracy achieved in the training dataset, which is very encouraging and suggesting the robustness and applicability of the developed model. One limitation was the relatively small number of TN cancer, but this was an inherent problem for most molecular subtype differentiation studies, since TN cancer only accounted for about 10-15% of all breast cancers [8].Acknowledgements
No acknowledgement found.References
[1] Park S, Koo JS, Kim MS, Park HS, Lee JS, Kim SI, et al. Characteristics and outcomes according to molecular subtypes of breast cancer as classified by a panel of four biomarkers using immunohistochemistry. Breast. 2012;21(1): 50–7.
[2] Yoo C, Ahn JH, Jung KH, Kim SB, Kim HH, Shin HJ, et al. Impact of immunohistochemistry-based molecular subtype on chemosensitivity and survival in patients with breast cancer following neoadjuvant chemotherapy. J Breast Cancer. 2012;15(2): 203–10.
[3] Li W, Yu K, Feng C, Zhao D. Molecular Subtypes Recognition of Breast Cancer in Dynamic Contrast-Enhanced Breast Magnetic Resonance Imaging Phenotypes from Radiomics Data. Comput Math Methods Med. 2019;2019: 6978650.
[4] Nie K, Chen J-H, Yu HJ, Chu Y, Nalcioglu O, Su M-Y. Quantitative analysis of lesion morphology and texture features for diagnostic prediction in breast MRI. Acad Radiol. 2008;15: 1513–1525.
[5] Xie T, Wang Z, Zhao Q, Bai Q, Zhou X, Gu Y, et al. Machine Learning-Based Analysis of MR Multiparametric Radiomics for the Subtype Classification of Breast Cancer. Front Oncol. 2019;9: 505.
[6] Marino MA, Leithner D, Sung J, Avendano D, Morris EA, Pinker K, et al. Radiomics for Tumor Characterization in Breast Cancer Patients: A Feasibility Study Comparing Contrast-Enhanced Mammography and Magnetic Resonance Imaging. Diagnostics (Basel). 2020;10. doi:10.3390/diagnostics10070492
[7] Song L, Lu H, Yin J. Preliminary study on discriminating HER2 2+ amplification status of breast cancers based on texture features semi-automatically derived from pre-, post-contrast, and subtraction images of DCE-MRI. PLoS One. 2020;15: e0234800.
[8] Anders C, Carey LA. Understanding and treating triple-negative breast cancer. Oncology. 2008;22: 1233–9; discussion 1239–40, 1243.
Figures