1115
Combination of pharmacokinetic parameters and texture features of DCE-MRI for predicting preoperative classification of breast cancer1Paul C. Lauterbur Research Center for Biomedical Imaging, Shenzhen Institutes of Advanced Technology, Chinese Academy of Sciences Synopsis, ShenZhen, China, 2Key Laboratory for Magnetic Resonance and Multimodality Imaging of Guangdong Province, Shenzhen Institutes of Advanced Technology, Chinese Academy of Sciences, ShenZhen, China, 3CAS key laboratory of health informatics, Shenzhen Institutes of Advanced Technology, Chinese Academy of Sciences, ShenZhen, China, 4Department of Radiology, National Cancer Center/Cancer Hospital and Shenzhen Hospital, Chinese Academy of Medical Sciences and Peking Union Medical College, ShenZhen, China
Synopsis
We have achieved preoperative classification of breast cancer by combination of pharmacokinetic parameters and texture features using machine learning. Using the information available in each feature space, an appropriate feature fusion method using information from the two feature spaces can help the classification process and improve diagnosis accuracy. Among them, SVM and KNN have better performance.
Introduction
Preoperative grading of breast cancer is critical for the decision of breast cancer surgery and has been shown one of the best-established prognostic factors. In recent years, with the widespread application of artificial intelligence in the field of medical image processing, texture features analysis based on machine learning has achieved groundbreaking results in tumor classification tasks, such as breast cancer grading [1-3]. However, most of the studies used spatial or temporal features to achieve the best classification effect [4-5]. Considering pharmacokinetic parameters of dynamic contrast-enhanced magnetic resonance imaging (DCE-MRI) have been adopted to explore the permeability and perfusion changes inside the tumors and be used to the classification of tumors [6]. This study investigated and evaluated the combination of pharmacokinetic parameters and texture features derived from DCE-MRI, using machine learning techniques, to predict preoperative grades of breast cancer.Materials and Methods
Data Acquisition: Thirty patients with histopathological diagnosed grade I-III breast cancer were enrolled in the study. All participants underwent DCE-MRI with the following imaging parameters: TR/ TE = 4.5/2.1ms, field of view = 360mm×360mm, image matrix =320×256, slice thickness = 1.4mm with no gap, flip angle=12°. Scan time=35-55s per period, a total of 10 periods with one pre-contrast and nine post-contrast dynamic periods. Feature Extraction and Prediction: A total of 489 slices with breast cancer lesions (171 Grade Ⅰ, 140 Grade Ⅱ and 178 Grade Ⅲ) were used for analysis. All lesions were manually segmented by two radiologists in consensus. For each slice, 78 texture features were extracted using the first-order histogram (18 features), Gray Level Co-occurrence Matrix (GLCM; 23 features), Neighborhood Gray-Tone Difference Matrix (NGTDM; 5 features), Gray Level Run Length Matrix (GLRLM; 13 features), Gray Level Size Zone Matrix (GLSZM; 13 features), and 6 shape features. A total of 390 texture features after wavelet decomposition were finally extracted for each slice. Fives pharmacokinetic parameters such as the volume transfer constant of contrast agent leaked into extravascular extracellular space (EES) from plasma (Ktrans), the rate constant of contrast agent reflux to the plasma (Kep), the fractional EES volume (Ve), and the fractional plasma volume(Vp), and area under the curve (AUC) were calculated using the modified Tofts model. 113 new features were carried out using principal component analysis of the pharmacokinetic parameters and texture features,. and used for training and testing set for the three different types of classifiers (random forest, SVM and KNN).Result
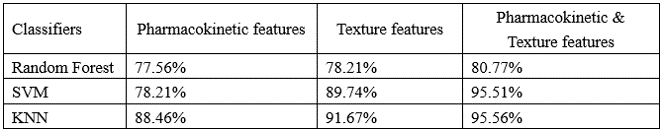
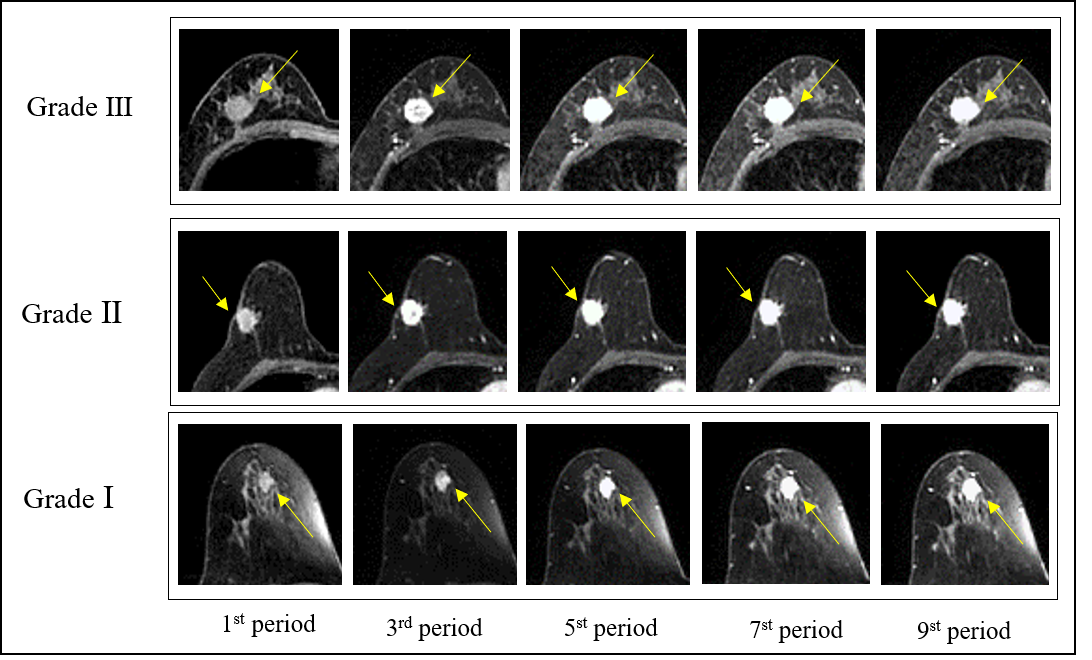
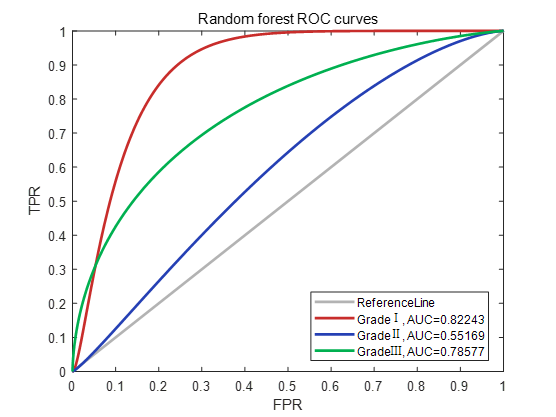
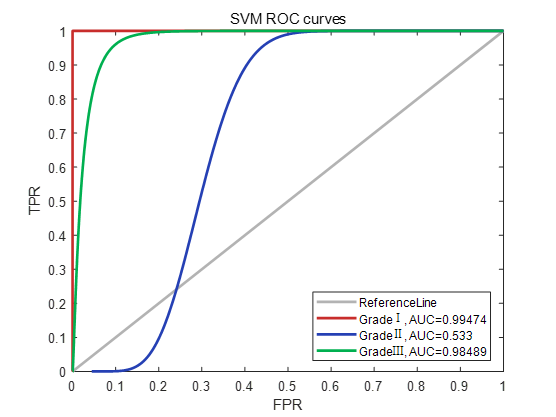
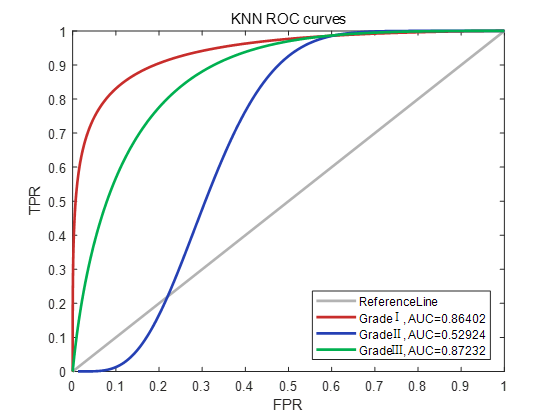
Figure 1 show representative images of the 1st, 3rd, 5th, 7th, and 9th periods acquired in consequent acquisition times for grade I-III breast cancer. The accuracy of using the three different types of classifiers (random forest, SVM and KNN) according to different feature sets were summarized in Table 1. Among them, the correct rate of random forest reached 80.77%, SVM reached 95.51%, and KNN reached 95.56%. Classification accuracy with area under the receiving operating characteristic curve (AUC) of random forest, SVM and KNN using combination of the texture features and pharmacokinetic parameters for breast cancer grading were plotted in Figure 2-4. Machine learning with DCE-MRI achieved stable performance is shown by mean classification accuracies for the prediction of grade Ⅰ (AUC, 0.99), grade Ⅱ (AUC, 0.53), grade Ⅲ (AUC, 0.98) based on SVM and for the prediction of grade Ⅰ (AUC, 0.86), grade Ⅱ (AUC, 0.53), grade Ⅲ (AUC, 0.87) based on KNN.Discussion
Previous studies have suggested that texture analysis is a promising tool in the diagnosis, characterization, and assessment of treatment response in various cancer types [7]. As shown in the Table1, From the results, the correct rate of the classifier has been improved when combination of the texture features and pharmacokinetic parameters [8]. Texture features have been developed for static images. These features include different mathematical descriptors for the borders and shapes of the suspected lesions. More, pharmacokinetic parameters such as Ktrans, Kep, Ve, and Vp derived from DCE-MRI can evaluate not only tumor angiogenesis but also permeability of microcirculation. Further work will investigate the addition of clinicopathological features (such as age, BIRADS), as this has been shown to increase the performance of models predicting histopathological grade.Conclusion
Combination of texture features and pharmacokinetic parameters for a classifier can improve the accuracy of classification. Compared to random forest classifier, the SVM and KNN classifiers achieved the most stable performance with better grading accuracy.Acknowledgements
No acknowledgement found.References
(1) Turkki R, Byckhov D, Lundin M, et al. Breast cancer outcome prediction with tumour tissue images and machine learning. Breast Cancer Res Treat. 2019;177(1):41-52.
(2) Tahmassebi A, Wengert GJ, Helbich TH, et al. Impact of Machine Learning With Multiparametric Magnetic Resonance Imaging of the Breast for Early Prediction of Response to Neoadjuvant Chemotherapy and Survival Outcomes in Breast Cancer Patients. Invest Radiol. 2019;54(2):110-117.
(3) Wu T, Sultan LR, Tian J, Cary TW, Sehgal CM. Machine learning for diagnostic ultrasound of triple-negative breast cancer. Breast Cancer Res Treat. 2019;173(2):365-373.
(4) Chitalia RD, Kontos D. Role of texture analysis in breast MRI as a cancer biomarker: A review. J Magn Reson Imaging 2019;49(4):927–938.
(5) Interim heterogeneity changes measured using entropy texture features on T2-weighted MRI at 3.0 T are associated with pathological response to neoadjuvant chemotherapy in primary breast cancer. Eur Radiol 2017;27(11):4602–4611.
(6) Machireddy A, Thibault G, Tudorica A et al. Early prediction of breast cancer therapy response using multiresolution fractal analysis of DCE-MRI parametric maps. Tomography 2019;5(1):90–98.
(7) Eun, Na Lae et al. “Texture Analysis with 3.0-T MRI for Association of Response to Neoadjuvant Chemotherapy in Breast Cancer.” Radiology vol. 294,1 (2020): 31-41.
(8) Banaie M, Soltanian-Zadeh H, Saligheh-Rad HR, Gity M. Spatiotemporal features of DCE-MRI for breast cancer diagnosis. Comput Methods Programs Biomed. 2018 Mar; 155:153-164.
Figures