1113
Diagnosis of Breast Cancer Using Radiomics Models Built Based on DCE-MRI and Mammography Compared to BI-RADS Reading
Zhongwei Chen1, Yang Zhang2, Jiejie Zhou1, Youfan Zhao1, Haiwei Miao1, Huiru Liu1, Shuxin Ye1, Nina Xu1, Meihao Wang1, and Min-Ying Su2
1Department of Radiology, The First Affiliated Hospital of Wenzhou Medical University, wenzhou, China, 2Department of Radiological Sciences, University of California, Irvine, CA, United States
1Department of Radiology, The First Affiliated Hospital of Wenzhou Medical University, wenzhou, China, 2Department of Radiological Sciences, University of California, Irvine, CA, United States
Synopsis
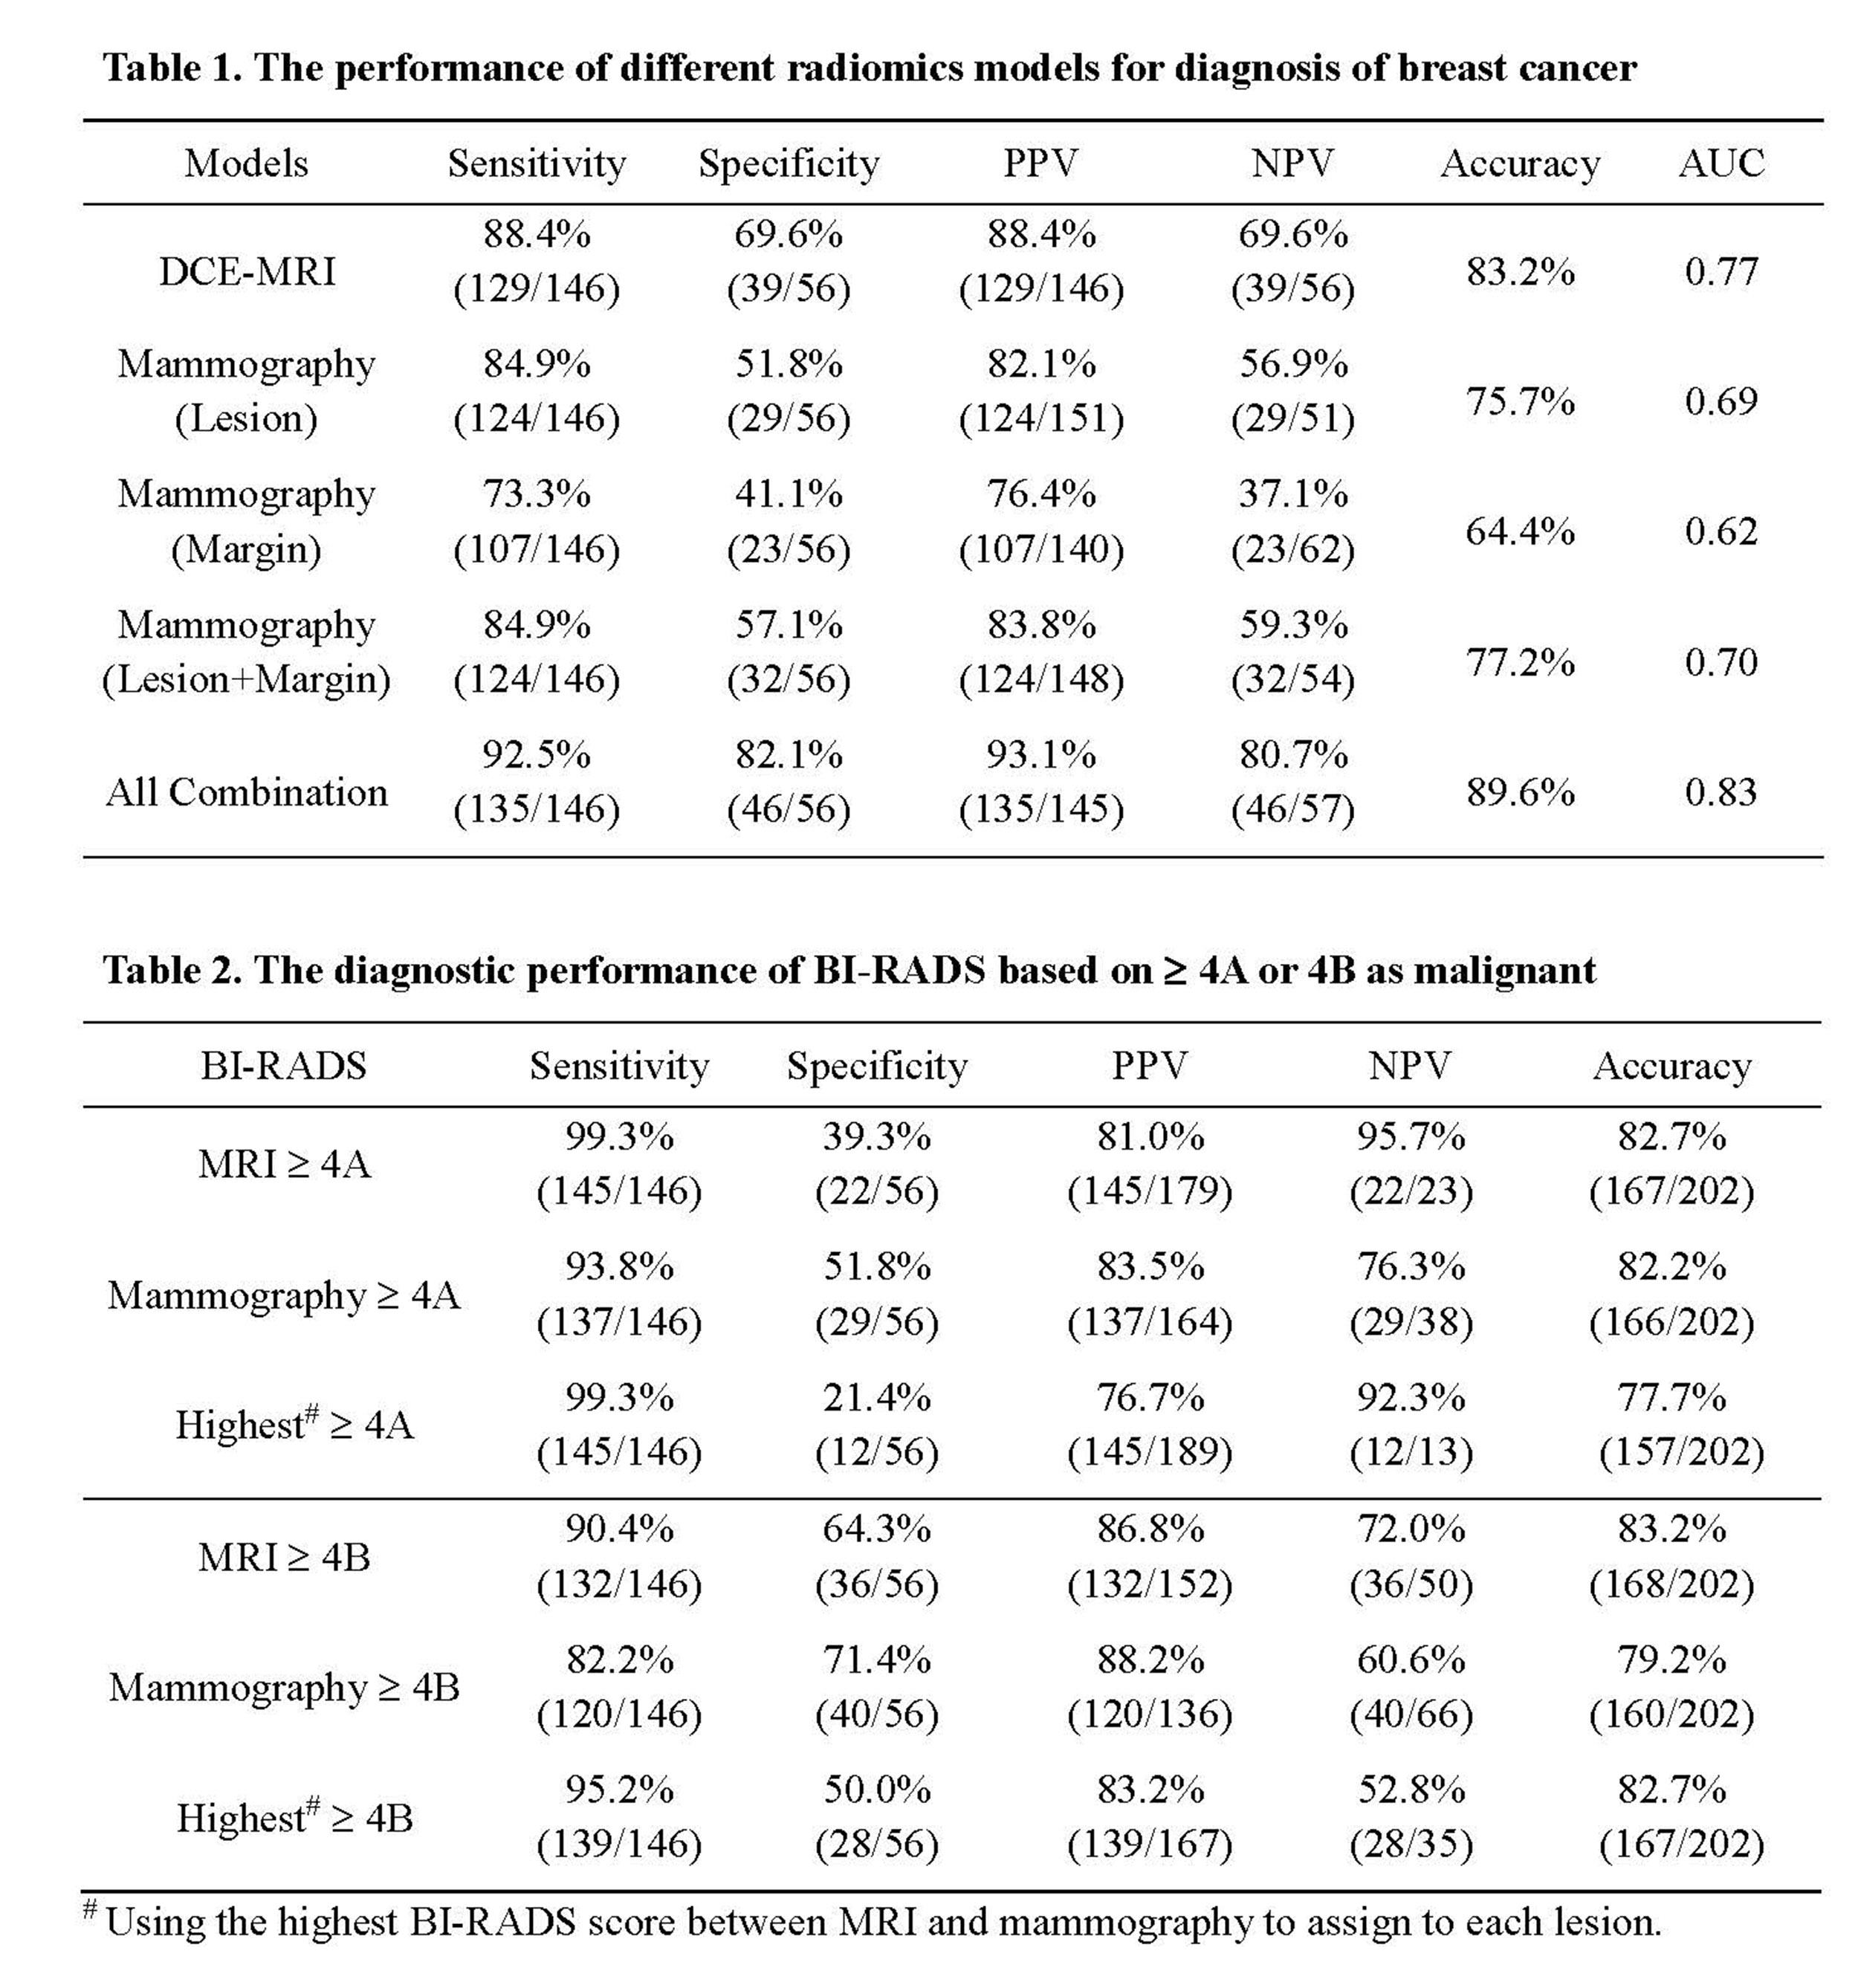
A total of 200 patients receiving both DCE-MRI and mammography were analyzed, including 146 malignant and 56 benign lesions. For each lesion, 3D tumor mask was done using fuzzy-C-means clustering algorithm. Three DCE parametric maps were generated, and the radiomics features were extracted from these maps by PyRadiomics. Five models were built based on DCE-MRI, mammography, and the combination. The BI-RADS score was obtained from the radiology reports for comparison. The model built based on all MRI and mammography features yielded the highest accuracy of 89.6%, and had significantly better diagnostic performance than BI-RADS using threshold of 4A or 4B.
Introduction
Mammography and dynamic contrast-enhanced magnetic resonance imaging (DCE-MRI) are commonly used clinical imaging modalities for diagnosis of breast lesions, which are known to reveal different aspects and provide complementary information for improved accuracy [1, 2]. However, they are limited by high false positive rate and low sensitivity, respectively. Since different imaging examination methods can evaluate different pathological characteristics of the abnormal tissue, combining them may improve the diagnostic accuracy [1]. Breast Imaging Reporting and Data System (BI-RADS) [3] is used to indicate the level of suspicion in detected abnormality. However, subjective reading using the BI-RADS lexicon only achieved moderate levels of inter-reader agreement [4]. To circumvent this problem, computer-aided diagnosis systems have been proposed to develop quantitative models that are not subject to high variations as potential diagnostic tools [5, 6]. Radiomics allows high-throughput extraction of numerous quantitative features from radiographic images [7]. It has become a very popular machine learning-based method for medical applications. Artificial intelligence (AI) based radiomics study has been applied for diagnosis of breast cancer and proven as a feasible approach for mammography [8] and MRI [9, 10]; however, combined radiomics models using both was rarely reported. Therefore, the purpose of this study was to evaluate the performance of radiomics models built based on DCE-MRI and mammography for diagnosis of breast cancer, compared to results determined by BI-RADS reading.Methods
A total of 202 patients who had both DCE-MRI and mammography for diagnosis were retrospectively reviewed, including 146 malignant and 56 benign lesions, all confirmed by histopathology. DCE scan was acquired using the volume imaging for breast assessment sequence, consisted of 6 frames: one pre-contrast (F1) and 5 post-contrast (F2-F6). BI-RADS score was obtained from the radiology reports, classified into 2, 3, 4A, 4B, 4C, and 5. Lesions were segmented based on contrast-enhanced maps using FCM clustering algorithm on each DCE slice containing the lesion. Then, the ROIs from all slices were combined, and 3D connected-component labeling and the hole-filling algorithms were applied to generate the final 3D mask [11, 12]. For corresponding mammography, two experienced radiologists manually outlined the lesion on cranio-caudal or medio-lateral oblique view by consensus, with the guidance of the lesion shown on the maximal intensity projection of MRI, projected from different angles. Three heuristic DCE parametric maps were generated according to: the early wash-in signal enhancement (SE) ratio [(F2-F1)/F1]; the maximum SE ratio = [(F3-F1)/F1]; the wash-out slope [(F6-F3)/F3] [9]. Four cases are illustrated in Figures 1 to 4. The radiomics analysis was performed using the PyRadiomics on heuristic DCE parametric maps and mammography. A sequential forward feature selection method based on support vector machine was used for optimal feature subset selection. After feature selection, five models were built based on the selected features from: 1) DCE-MRI; 2) mammography lesion; 3) mammography margin; 4) mammography lesion+margin; and 5) all combined. The diagnostic performances were tested using 10-fold cross-validation. The accuracy predicted by different models was compared by using the Chi-square test.Results
For individual models, 8 DCE-MRI, 4 mammography-lesion, and 3 mammography-margin features were selected, respectively. In the combined model, a total of 9 features including 7 DCE-MRI and 2 mammography-lesion were selected. The achieved accuracy using 10-fold cross-validation was 83.2%, 75.7%, 64.4%, 77.2%, 89.6% for the model built based on DCE-MRI, mammography lesion, mammography margin, combination of mammography lesion and margin, all features combined, respectively (Table 1). For BI-RADS, The final diagnostic results evaluated using the cut-off of BI-RADS 4A or 4B are shown in Table 2, showing higher sensitivity and lower specificity based on 4A than 4B, but the overall accuracy was comparable, 82-83% for MRI, and 79-82% for Mammography. The combination model based on all features (89.6% accuracy) performed significantly better than the BI-RADS reading using 4A or 4B as threshold on MRI (82.7% p=0.044, 83.2% p=0.059) and mammography (82.2% p=0.032, 79.2% p=0.004).Discussion
Although BI-RADS is a well-established scoring system for assessment of breast lesions, it is limited by moderate inter-reader agreement, and also that the accuracy depends on the experience level of the reader. In this study, MRI was found to have a higher sensitivity and lower specificity compared to mammography, which was consistent with their clinical role. When using the highest BI-RADS score between MRI and mammography to assign to each lesion, the specificity was further decreased, lowing overall accuracy. Since both imaging modalities are commonly performed for diagnosis, there is a wealth of data that can be explored using the AI based image analysis methods. We built 5 different radiomics models to investigate the features extracted from MRI, lesion and margin of Mammography, and all of them combined. The model based on all features yielded an accuracy of 89.6%, which was higher than all other models based on DCE-MRI or mammography alone, suggesting their complementary role. The results demonstrated the feasibility and effectiveness of the AI analysis using multimodal imaging to improve the diagnostic accuracy for breast cancer.Acknowledgements
This work was supported in part by Foundation of Wenzhou Science & Technology Bureau (No. Y20180187 and Y20180144), Medical Health Science and Technology Project of Zhejiang Province Health Commission (No. 2019KY102), and NIH/NCI R01 CA127927 and R21 CA208938.References
[1] S.N. Yang, F.J. Li, Y.H. Liao, Y.S. Chen, W.C. Shen, T.C. Huang, Identification of Breast Cancer Using Integrated Information from MRI and Mammography, PloS one 10(6) (2015) e0128404.
[2] W. Tang, F.X. Hu, H. Zhu, Q.F. Wang, Y.J. Gu, W.J. Peng, Digital breast tomosynthesis plus mammography, magnetic resonance imaging plus mammography and mammography alone: A comparison of diagnostic performance in symptomatic women, Clin Hemorheol Microcirc 66(2) (2017) 105-116.
[3] D’Orsi, C.J., Sickles, E.A., Mendelson, E.B., Morris E.A., et al. (2013) ACR BI-RADS Atlas, Breast Imaging Reporting and Data System. American College of Radiology, Reston, VA.
[4] M. Rawashdeh, S. Lewis, M. Zaitoun, P. Brennan, Breast lesion shape and margin evaluation: BI-RADS based metrics understate radiologists' actual levels of agreement, Comput Biol Med 96 (2018) 294-298.
[5] L.J. Grimm, A.L. Anderson, J.A. Baker, K.S. Johnson, R. Walsh, S.C. Yoon, S.V. Ghate, Interobserver Variability Between Breast Imagers Using the Fifth Edition of the BI-RADS MRI Lexicon, AJR. American journal of roentgenology 204(5) (2015) 1120-4.
[6] M. Lunkiewicz, S. Forte, B. Freiwald, G. Singer, C. Leo, R.A. Kubik-Huch, Interobserver variability and likelihood of malignancy for fifth edition BI-RADS MRI descriptors in non-mass breast lesions, European radiology 30(1) (2020) 77-86.
[7] P. Lambin, E. Rios-Velazquez, R. Leijenaar, S. Carvalho, R.G. van Stiphout, P. Granton, C.M. Zegers, R. Gillies, R. Boellard, A. Dekker, H.J. Aerts, Radiomics: extracting more information from medical images using advanced feature analysis, European journal of cancer (Oxford, England : 1990) 48(4) (2012) 441-6.
[8] N. Mao, P. Yin, Q. Wang, M. Liu, J. Dong, X. Zhang, H. Xie, N. Hong, Added Value of Radiomics on Mammography for Breast Cancer Diagnosis: A Feasibility Study, Journal of the American College of Radiology : JACR 16(4 Pt A) (2019) 485-491.
[9] J. Zhou, Y. Zhang, K.T. Chang, K.E. Lee, O. Wang, J. Li, Y. Lin, Z. Pan, P. Chang, D. Chow, M. Wang, M.Y. Su, Diagnosis of Benign and Malignant Breast Lesions on DCE-MRI by Using Radiomics and Deep Learning With Consideration of Peritumor Tissue, Journal of magnetic resonance imaging : JMRI 51(3) (2020) 798-809.
[10] Q. Zhang, Y. Peng, W. Liu, J. Bai, J. Zheng, X. Yang, L. Zhou, Radiomics Based on Multimodal MRI for the Differential Diagnosis of Benign and Malignant Breast Lesions, Journal of magnetic resonance imaging : JMRI 52(2) (2020) 596-607.
[11] K. Nie, J.H. Chen, H.J. Yu, Y. Chu, O. Nalcioglu, M.Y. Su, Quantitative analysis of lesion morphology and texture features for diagnostic prediction in breast MRI, Acad Radiol 15(12) (2008) 1513-25.
[12] D. Newell, K. Nie, J.H. Chen, C.C. Hsu, H.J. Yu, O. Nalcioglu, M.Y. Su, Selection of diagnostic features on breast MRI to differentiate between malignant and benign lesions using computer-aided diagnosis: differences in lesions presenting as mass and non-mass-like enhancement, European radiology 20(4) (2010) 771-81.
Figures
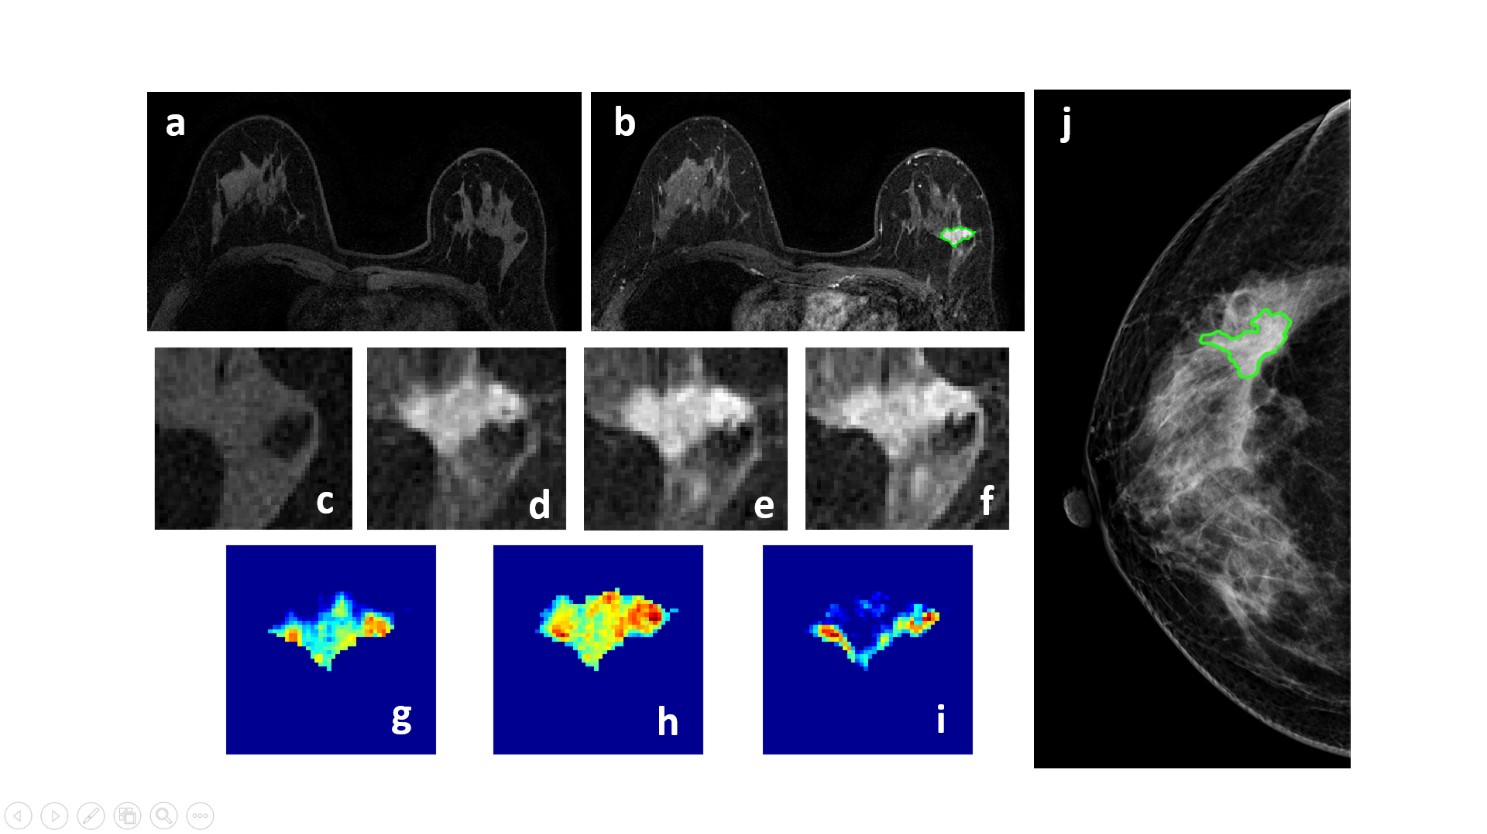
Figure 1: A 50-year-old patient with a malignant cancer showing smooth boundary. (a) F1 Precontrast image. (b) The F2 postcontrast image. (c) The F1 precontrast image. (d) The F2 postcontrast image. (e) The F3 postcontrast image. (f) The last F6 postcontrast image,showing persistent enhancement with increased intensity over time. (g) The washin signal enhancement map F2-F1. (h) The F3-F1 signal enhancement map. (i) The washout F6-F3 map. (j) The corresponding CC view mammography, the lesion mass was outlined by green line.
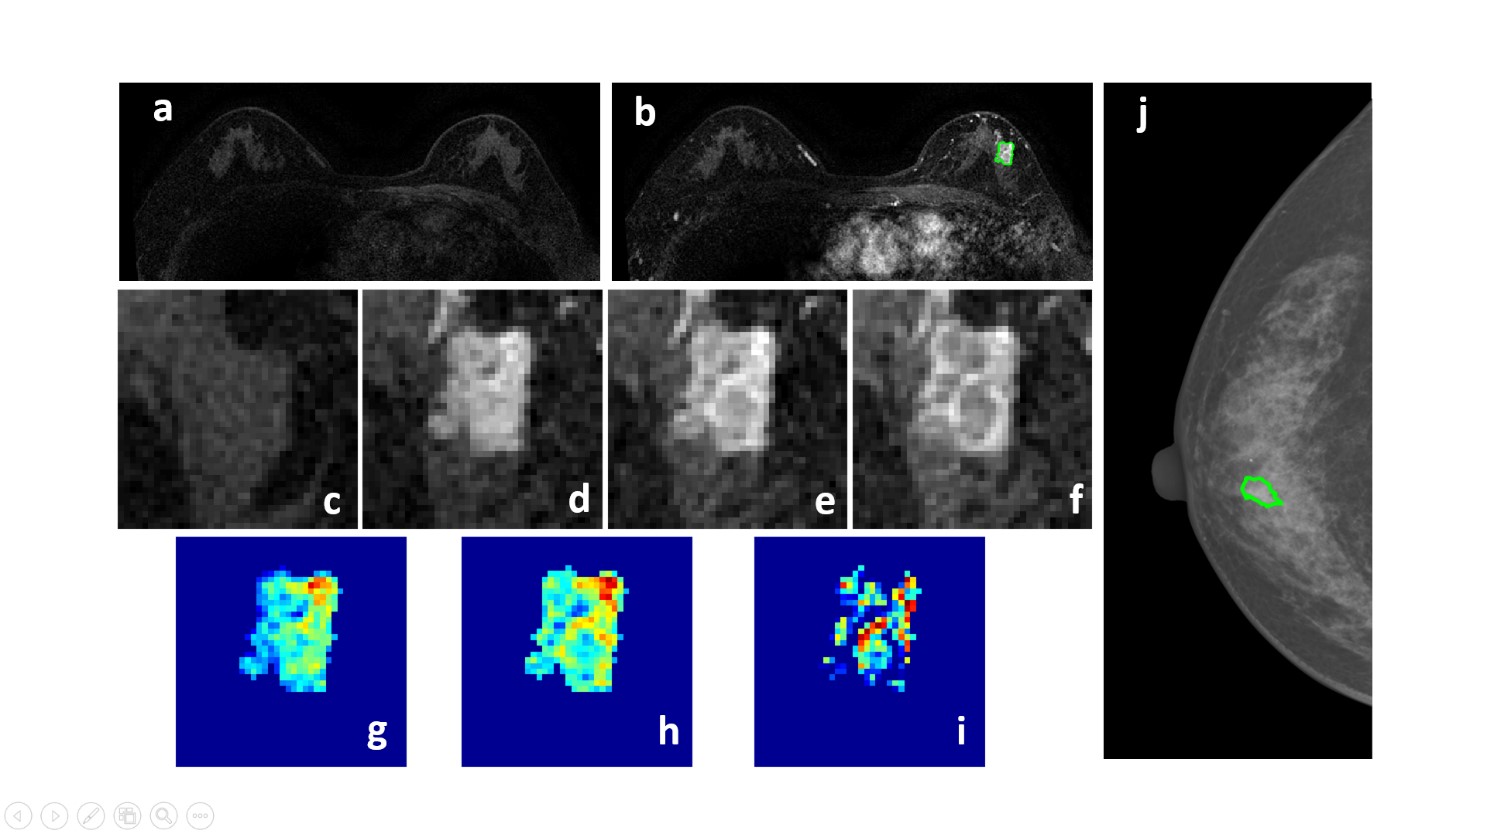
Figure 2: A 58-year-old patient with a malignant cancer showing smooth boundary. (a) F1 Precontrast image. (b) The F2 postcontrast image. (c) The F1 precontrast image. (d) The F2 postcontrast image. (e) The F3 postcontrast image. (f) The last F6 postcontrast image, showing persistent enhancement with increased intensity over time. (g) The washin signal enhancement map F2-F1. (h) The F3-F1 signal enhancement map. (i) The washout F6-F3 map. (j) The corresponding CC view mammography, the lesion mass was outlined by green line.
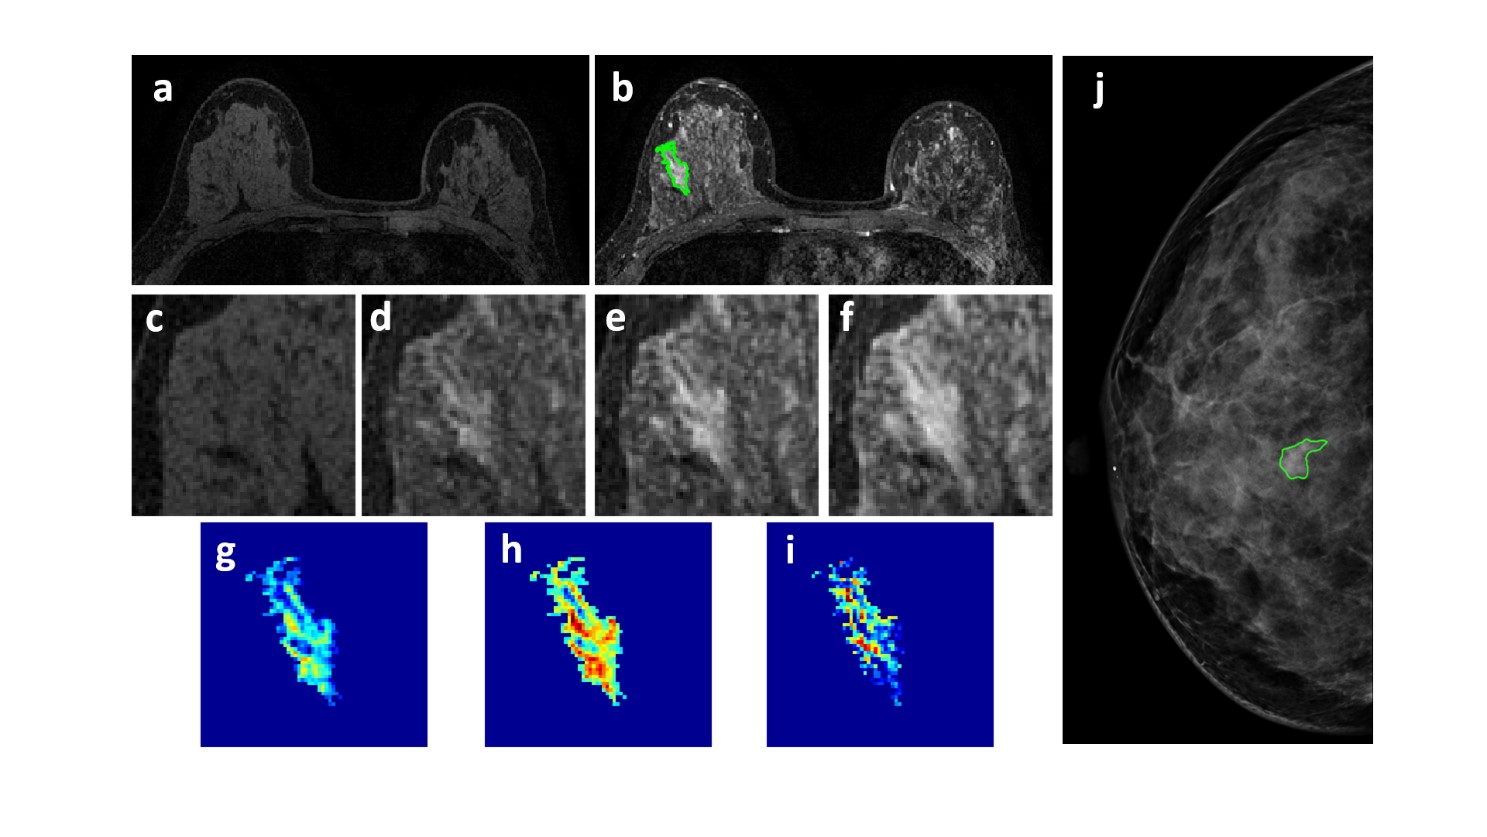
Figure 3: A 46-year-old patient with a benign lesion showing smooth boundary. (a) F1 Precontrast image. (b) The F2 postcontrast image. (c) The F1 precontrast image. (d) The F2 postcontrast image. (e) The F3 postcontrast image. (f) The last F6 postcontrast image, showing persistent enhancement with increased intensity over time. (g) The washin signal enhancement map F2-F1. (h) The F3-F1 signal enhancement map. (i) The washout F6-F3 map. (j) The corresponding CC view mammography, the lesion mass was outline by green line.
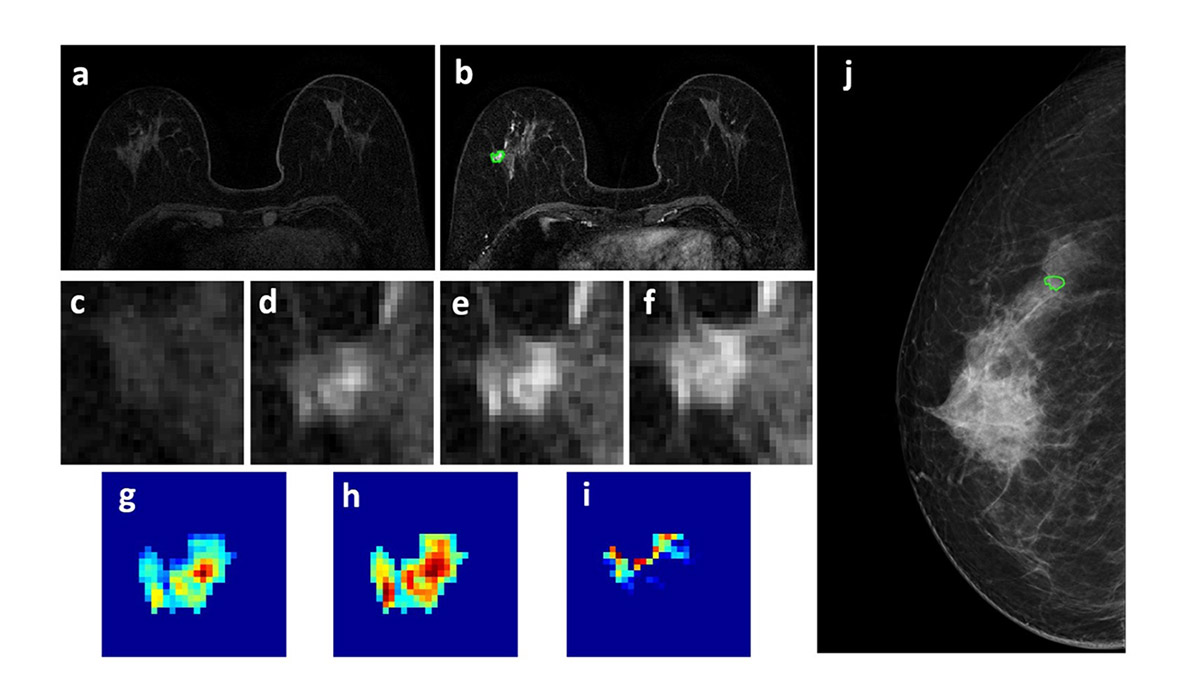
Figure 4: A 63-year-old patient with a benign lesion showing smooth boundary. (a) F1 Precontrast image. (b) The F2 postcontrast image. (c) The F1 precontrast image. (d) The F2 postcontrast image. (e) The F3 postcontrast image. (f) The last F6 postcontrast image,showing persistent enhancement with increased intensity over time. (g) The washin signal enhancement map F2-F1. (h) The F3-F1 signal enhancement map. (i) The washout F6-F3 map. (j) The corresponding CC view mammography, the lesion mass was outline by green line.