1112
Correlation assessment between quantitative multimodality imaging metrics using a community detection algorithm
Ramesh Paudyal1, Milan Grkovski1, Jung Hun Oh1, Heiko Schoder2, David Aramburd Nunez1, Vaios Hatzoglou2, Joseph O Deasy1, John L Hum1, Nancy Lee3, and Amita Shukla-Dave1,2
1Medical Physics, Memorial Sloan Kettering Cancer Center, New York, NY, United States, 2Radiology, Memorial Sloan Kettering Cancer Center, New York, NY, United States, 3Radiation Oncology, Memorial Sloan Kettering Cancer Center, New York, NY, United States
1Medical Physics, Memorial Sloan Kettering Cancer Center, New York, NY, United States, 2Radiology, Memorial Sloan Kettering Cancer Center, New York, NY, United States, 3Radiation Oncology, Memorial Sloan Kettering Cancer Center, New York, NY, United States
Synopsis
This study aims to assess the correlation between the pre-treatment quantitative imaging metrics obtained from multimodality imaging (MMI) techniques such as 18[F]-FMISO PET/CT, 18[F]-FDG PET/CT, DW- and DCE- MRI describing tumor metabolism, hypoxia, diffusion, perfusion, and cell metabolic activity, using a community detection algorithm. The method partitioned the network into four groups with strong and weak connections. The community connection results show complementary, rather than competitive, information about tumor metabolism, hypoxia, diffusion, and perfusion.
Purpose
Quantitative imaging (QI) metrics extracted from multimodality imaging (MMI) methods, including 18[F]-fluorodeoxyglucose (18F-FDG)- and 18[F]-fluoromisonidazole (18F-FMISO)-PET/CT1, and diffusion-weighted (DW-)2 and dynamic contrast-enhanced (DCE)-MRI3, describe tumor metabolism, hypoxia, diffusion, and perfusion/permeability, respectively. These QI metrics can be coupled with advanced statistical analysis to identify subtypes within head and neck (HN) cancer patients1,2. The relationship between the QIs evaluated by a conventional statistical approach may not sufficiently describe the tumor microenvironment's integrity. Therefore, QI metrics can be represented in the form of a community network to assess their relationships where the metrics are described as nodes and their correlations as edges4. These interconnected QI metrics are often characterized as sub-networks (“communities”)5. By integrating the quantitative information from composite datasets through network analysis, the strength of association between QIs can be used to determine overall functional and/or molecular aspects of underlying tumor biology6. The aim of the present study was to investigate correlations between pre-treatment (TX) QIs extracted from MMI methods in HN cancer using a “spin-glass model”-based community detection algorithm4.Methods
Patients: Our institutional review board approved this retrospective study. Twenty-three HN cancer patients (19M/4F, median age = 57 years) underwent 92 pre-TX MMI examinations, including 18F-FDG- and 18F-FMISO PET/CT, DW- and DCE-MRI.FDG- and FMISO-PET/CT data acquisition and analysis: All patients underwent baseline FDG PET/CT scans, followed by a baseline FMISO dynamic PET/CT5. All FDG uptake and FMISO dynamic PET data analyses, which calculate the surrogate biomarkers of tumor hypoxia (k3, tumor-to-blood ratio [TBR]), perfusion (K1), and FMISO distribution volume (DV), were detailed by Grkovski et al.1.
DW- and DCE-MRI data acquisition and analysis: The standard MRI protocol consisted of multi-planar T1/T2 weighted imaging followed by DW- and DCE-MRI on a 3.0T scanner (Ingenia, Philips Healthcare, The Netherlands) using a 20-channel neurovascular phased-array coil. The DW-MRI images were acquired using an SS-EPI sequence as described by Paudyal et al.2. DW multiple b-value data were fitted using (a) mono-exponential model to calculate the apparent diffusion coefficient (ADC) and (b) bi-exponential model (IVIM DW-MRI) model, which provides estimates of true diffusion coefficient (D), perfusion fraction (f), and pseudo-diffusion coefficient (D*)7,8 as detailed elsewhere 8,9. The pre-contrast T1w images were acquired using a fast 3D-SPGR-pulse sequence with TR/TE = 7.0/2.7 ms and multiple flip angles of 5°, 15°, and 30°. The dynamic images before, during, and after an injection of contrast agent were acquired with the same MR parameters mentioned above with phases = 50 and flip angle = 15° as detailed elsewhere10. The DCE-data were analyzed using a fast exchange regime model (FXR), which estimates the volume transfer constant (Ktrans), extravascular extracellular volume fraction (ve), and the mean lifetime of intracellular water molecules τi11.
Regions of Interest Analysis: Regions of Interest (ROIs) were delineated on the neck nodal metastases by a team of radiation oncologists and neuroradiologists based on reference anatomical T2w/T1w images using ImageJ software12. All DW- and DCE- MRI image processing was performed using in-house-developed software entitled MRI-QAMPER10.
Statistical Analysis: In this study, the spin-glass algorithm was employed to detect sub-graphs in a constructed community structure in networks based on the correlations between QI metrics given in Table 1. The basic principle of this method is that a complex network consists of communities, which are defined as groups of nodes that have high interconnectivity (strong links inside the groups) and weak inter-connectivity (weak links between groups)13. Correlations between all pairs of QI metrics were tested using the Spearman correlation test7. Then, significant correlations (P ≤ 0.05) were used as links in the network construction.
Results
For 23 patients, 27 metastatic lymph nodes were analyzed across 92 pre-TX MMI datasets. Multiparametric maps of ADC, D, f, Ktrans, ve, τi, SUV, TBR, k3, and K1 from a representative HN patient are shown in Figure 1 and 2. Table 1 summarizes QI values from the MMI methods. ADC and D exhibited a significant negative correlation with Ktrans and K1 (for both, P<0.05). ADC showed significant positive correlation with ve (P<0.05) and negative correlation with τi (P= 0.06). ADC and D were significantly negatively correlated with SULmean (for both, P< 0.05). K1 and Ktrans were significantly positively correlated (P<0.05). Mean TBR was found significantly positively correlated with SULmax and SULmean (for both, P<0.05). Summary statistics for the QI Spearman correlation tests is given in Table 2. Figure 3 exhibits the resulting community network analysis. Network analysis resulted in 4 sub-networks for the QIs from 4 MMI, linked to each other. The relationships between group members show the strength of correlations between different imaging modalities.Discussion and Conclusion
The groups of nodes that are heavily connected among themselves showed strong correlations. In contrast, a few groups are sparsely connected to the rest of the network as predicted by the Spearman correlation. Detecting the relationship between sub-groups at pre-TX is important to understand the role of imaging features that will pave the path towards personalized cancer medicine.Community structure analysis of MMI data will further improve our understanding of tumor biology in-vivo and unravel new treatment strategies.
Acknowledgements
Supported by NIH U01 CA211205, MSKCC internal IMRAS grant, and in part through the NIH/NCI Cancer Center Support Grant: P30 CA008748.References
1. Kamran SC, Riaz N, Lee N. Nasopharyngeal carcinoma. Surg Oncol Clin N Am. 2015;24(3):547-561. 2. Lee AW, Ma BB, Ng WT, Chan AT. Management of Nasopharyngeal Carcinoma: Current Practice and Future Perspective. Journal of clinical oncology : official journal of the American Society of Clinical Oncology. 2015;33(29):3356-3364. 3. Law BK, King AD, Bhatia KS, et al. Diffusion-Weighted Imaging of Nasopharyngeal Carcinoma: Can Pretreatment DWI Predict Local Failure Based on Long-Term Outcome? AJNR American journal of neuroradiology. 2016;37(9):1706-1712. 4. Zheng DC, Chen YB, Chen Y, et al. Dynamic Contrast-Enhanced MRI of Nasopharyngeal Carcinoma: A Preliminary Study of the Correlations Between Quantitative Parameters and Clinical Stage. Journal of Magnetic Resonance Imaging. 2014;39(4):940-948. 5. Kim S, Loevner LA, Quon H, et al. Prediction of response to chemoradiation therapy in squamous cell carcinomas of the head and neck using dynamic contrast-enhanced MR imaging. AJNR American journal of neuroradiology. 2010;31(2):262-268. 6. Ni LP, Liu Y. Contrast-enhanced dynamic and diffusion-weighted magnetic resonance imaging at 3.0 T to assess early-stage nasopharyngeal carcinoma. Oncol Lett. 2018;15(4):5294-5300. 7. Paudyal R, Oh JH, Riaz N, et al. Intravoxel incoherent motion diffusion-weighted MRI during chemoradiation therapy to characterize and monitor treatment response in human papillomavirus head and neck squamous cell carcinoma. Journal of magnetic resonance imaging : JMRI. 2017;45(4):1013-1023. 8. LoCastro E, Paudyal R, Mazaheri Y, et al. Computational Modeling of Interstitial Fluid Pressure and Velocity in Head and Neck Cancer Based on Dynamic Contrast-Enhanced Magnetic Resonance Imaging: Feasibility Analysis. Tomography. 2020;6(2):129-138. 9. Le Bihan D, Breton E, Lallemand D, Grenier P, Cabanis E, Laval-Jeantet M. MR imaging of intravoxel incoherent motions: application to diffusion and perfusion in neurologic disorders. Radiology. 1986;161(2):401-407. 10. Lu Y, Jansen JF, Mazaheri Y, Stambuk HE, Koutcher JA, Shukla-Dave A. Extension of the intravoxel incoherent motion model to non-gaussian diffusion in head and neck cancer. Journal of magnetic resonance imaging : JMRI. 2012;36(5):1088-1096. 11. Nath K, Pickup S, Lee S, Cai K, Popatani H, Glickson J. Assessment of chemotherapy in a mouse model of non-Hodgkin's lymphoma using Dynamic contrast-enhanced and diffusion weighted MRI. Paper presented at: Proc. Intl. Soc. Mag. Reson. Med. 2013. 12. ImageJ [computer program]. Bethesda, Maryland, USA: U. S. National Institutes of Health; 1997-2016. 13. Paudyal R, Konar AS, Obuchowski NA, et al. Repeatability of Quantitative Diffusion-Weighted Imaging Metrics in Phantoms, Head-and-Neck and Thyroid Cancers: Preliminary Findings. Tomography. 2019;5(1):15-25. 14. R: A language and environment for statistical computing. R Foundation for Statistical Computing [computer program]. Vienna, Austria: R Foundation for Statistical Computing; 2020.Figures
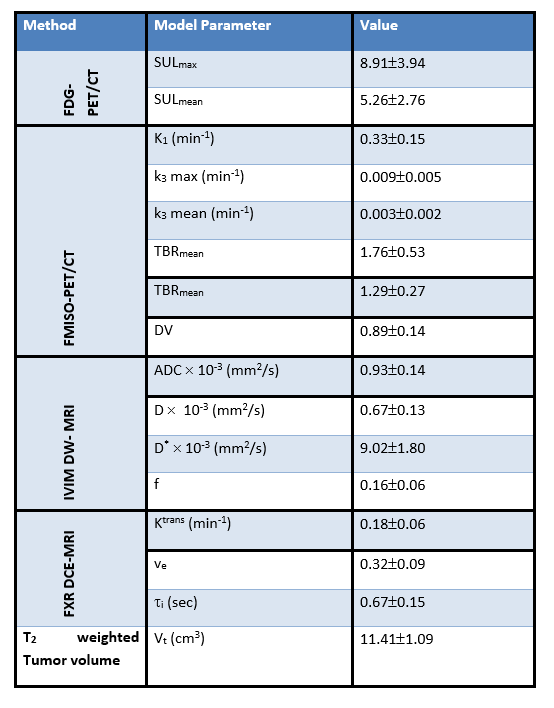
Table 1:
Quantitative imaging metrics value derived from the multi-modality imaging
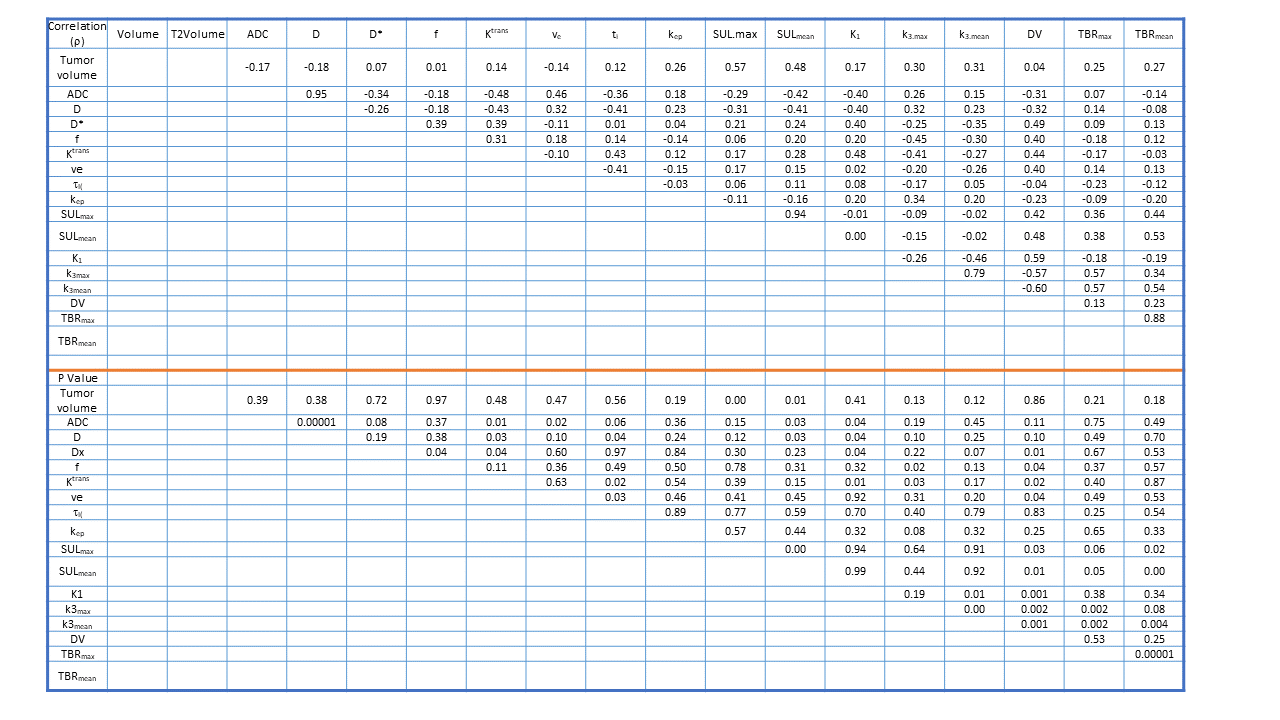
Table 2. Spearman correlation between the
quantitative metrics from the multimodality imaging
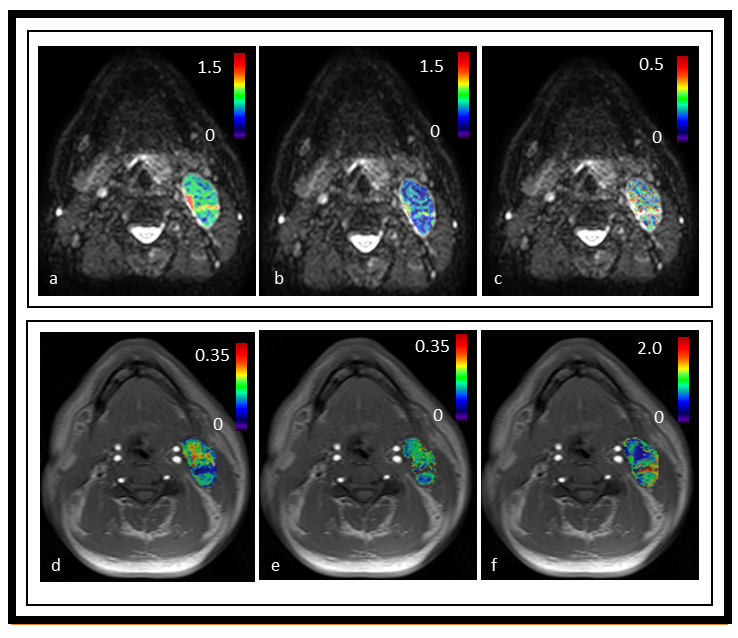
Figure 1. Representative parametric maps derived from the intravoxel incoherent
model and
fast exchange regime model overlaid on diffusion weighted (DW, b=0 s/mm2)
and T1w precontract images
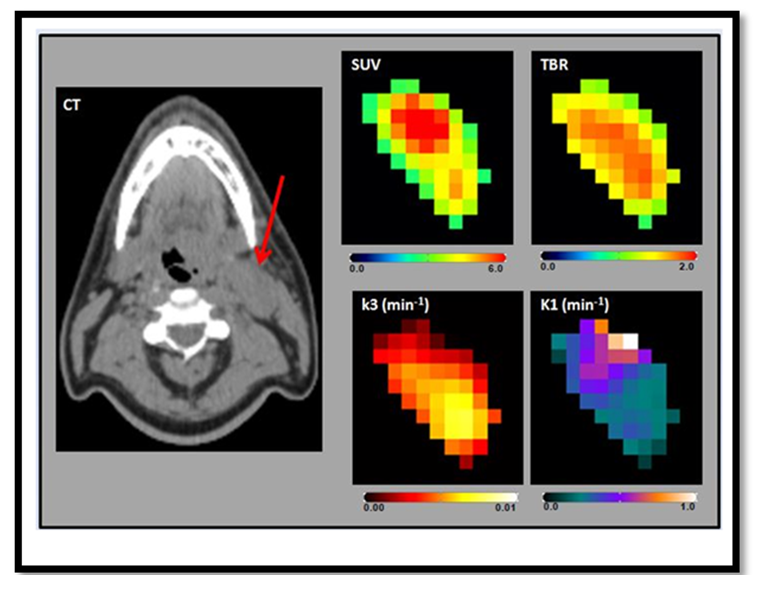
Figure2. Representative multiparametic 18F-fluorodeoxyglucose-
and 18F-fluoromisonidazole positron emission tomography/computerized
tomography (F-MISO PET/CT) maps showing standard uptake value (SUV), Tumor-to-Blood
Ratio (TBR), k3, and K1. The arrow points
the metastatic node of the representative head and
neck cancer patient in a CT image.
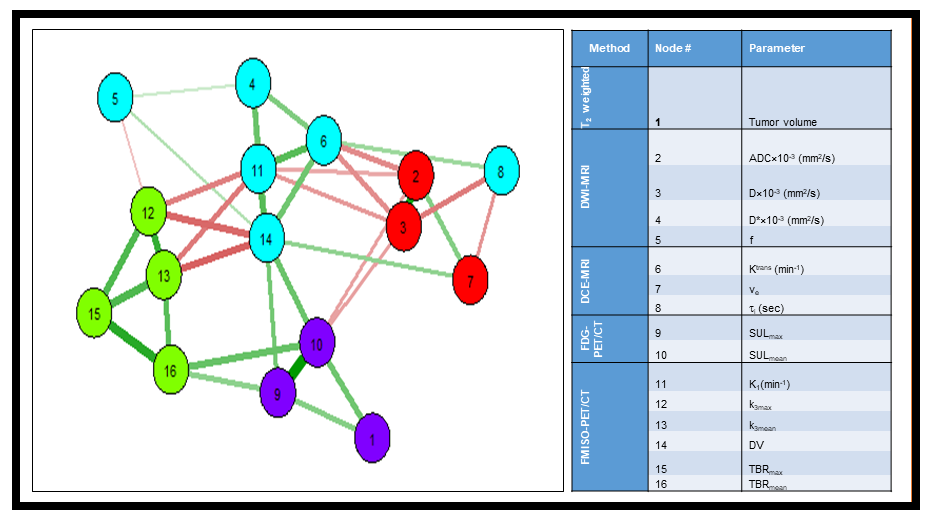
Figure 3. Detection of sub-networks (communities)
in a network with quantitative imaging metrics. The thick lines indicate the strong correlation
between metrics. Note: number on the node represents the MMM
QIs.