1111
High spatial-temporal resolved perfusion imaging: simultaneously DCE- and DSC-MRI acquisition using improved Spiral-Out-In (iSOI) sequence
Yupeng Cao1,2, Jun Zhao1,2, Weinan Tang3, Wentao Liu1, and Dong Han1,2
1National Center for Nanoscience and Technology, Beijing, China, 2University of Chinese Academy of Sciences, Beijing, China, 3Wandong Medical Technology, Beijing, China
1National Center for Nanoscience and Technology, Beijing, China, 2University of Chinese Academy of Sciences, Beijing, China, 3Wandong Medical Technology, Beijing, China
Synopsis
The combination of DCE and DSC MRI contribute to the higher accuracy of diagnosis than either alone. However, high spatial-temporal resolution sequences for DCE and DSC are absent in the clinical use. Herein, we propose an improved Spiral-Out-In (iSOI) sequence to simultaneously sample DCE and DSC signal with high spatial resolution. A model-based strategy for reconstruction of 8-fold accelerated MRI were employed to realize high temporal resolution imaging. The in-plane spatial resolution is 0.78 mm and the temporal resolution is 0.52 s. The perfusion parameters were calculated to verify the proposed method which has potential to benefit the accurate diagnosis.
Introduction
Dynamic Contrast Enhanced (DCE) and Dynamic Susceptibility Contrast (DSC) MRI are two non-invasive perfusion imaging techniques widely applied to detect the vessel permeability and blood flow respectively. The combination of these two modalities gives more benefit diagnosis results than either alone. However, the potential nephrotoxity of full dose gadolinium-based contrast agents is well recognized and the growing evidence that gadolinium deposition may occur in the brain following repeated exposures. 1,2,3 Hence, the single-dose perfusion imaging combined DCE and DSC MRI is necessary. In addition, conventional DCE-MRI is implemented with FLASH and performs high spatial resolution but the temporal resolution is low. 4 While conventional DSC-MRI is implemented with single-shot GRE-EPI and performs high temporal resolution but the spatial resolution is low.5 Both high spatial and temporal resolutions are important to the diagnosis accuracy in DCE- and DSC-MRI.6 Herein, we propose an improved Spiral-Out-In (iSOI) sequence to implement DCE and DSC MRI for high spatial-temporal resolution brain imaging at a clinical 1.5 Tesla (T) MRI with a single-dose administration of contrast agents. Interleaved spirals were used to realize the high spatial resolution and reduce the off-resonance effect. A model-based methods were used to reconstruct the images for the high temporal resolution DCE- and DSC-MRI.Methods
A study was performed on five healthy beagle canines with intravenous 25% mannitol (25 ml/kg) to open the blood-brain barrier (BBB) that underwent perfusion analysis. All studies were performed on an iSPACE 1.5 T MRI scanner (Wandong Medical Inc, Beijing, China) equipped with 3.3 G/cm gradients and 110 mT/m/ms slew rate. 8-channel phased array coil was used. Pre-contrast T1, M0 mapping and perfusion weighted imaged were performed using a multi-shot, dual gradient-echo, spiral-out and -in sequence with the following parameters: FOV=15×15 cm2, matrix=192×192, slice thickness=5 mm, skip=1.5 mm, TE1=4 msec, TE2=34.2 msec, TR=260 msec, number of slices=4, number of interleaved arms=16. Pre-contrast T1, M0 mapping used flip angle=10°, 15°, 20°, 25°, 35°. Perfusion weighted imaging used flip angle=60°, number of samples=90. A standard dose of Gadopentetate Dimeglumine Injection (0.2 mmol/kg, magnevist) was injected at the 30th time point using a power injector. The spiral trajectory is customized for the spiral-out and -in part to two contrast echo signals. The high frequency part in k-space can be shared to reconstruction. Thus the acquisition window width can be controlled. A combined strategy of parallel imaging, compressed sensing, and manifold learning was used for spiral image reconstruction and perfusion calculations were performed offline by using Matlab.Results
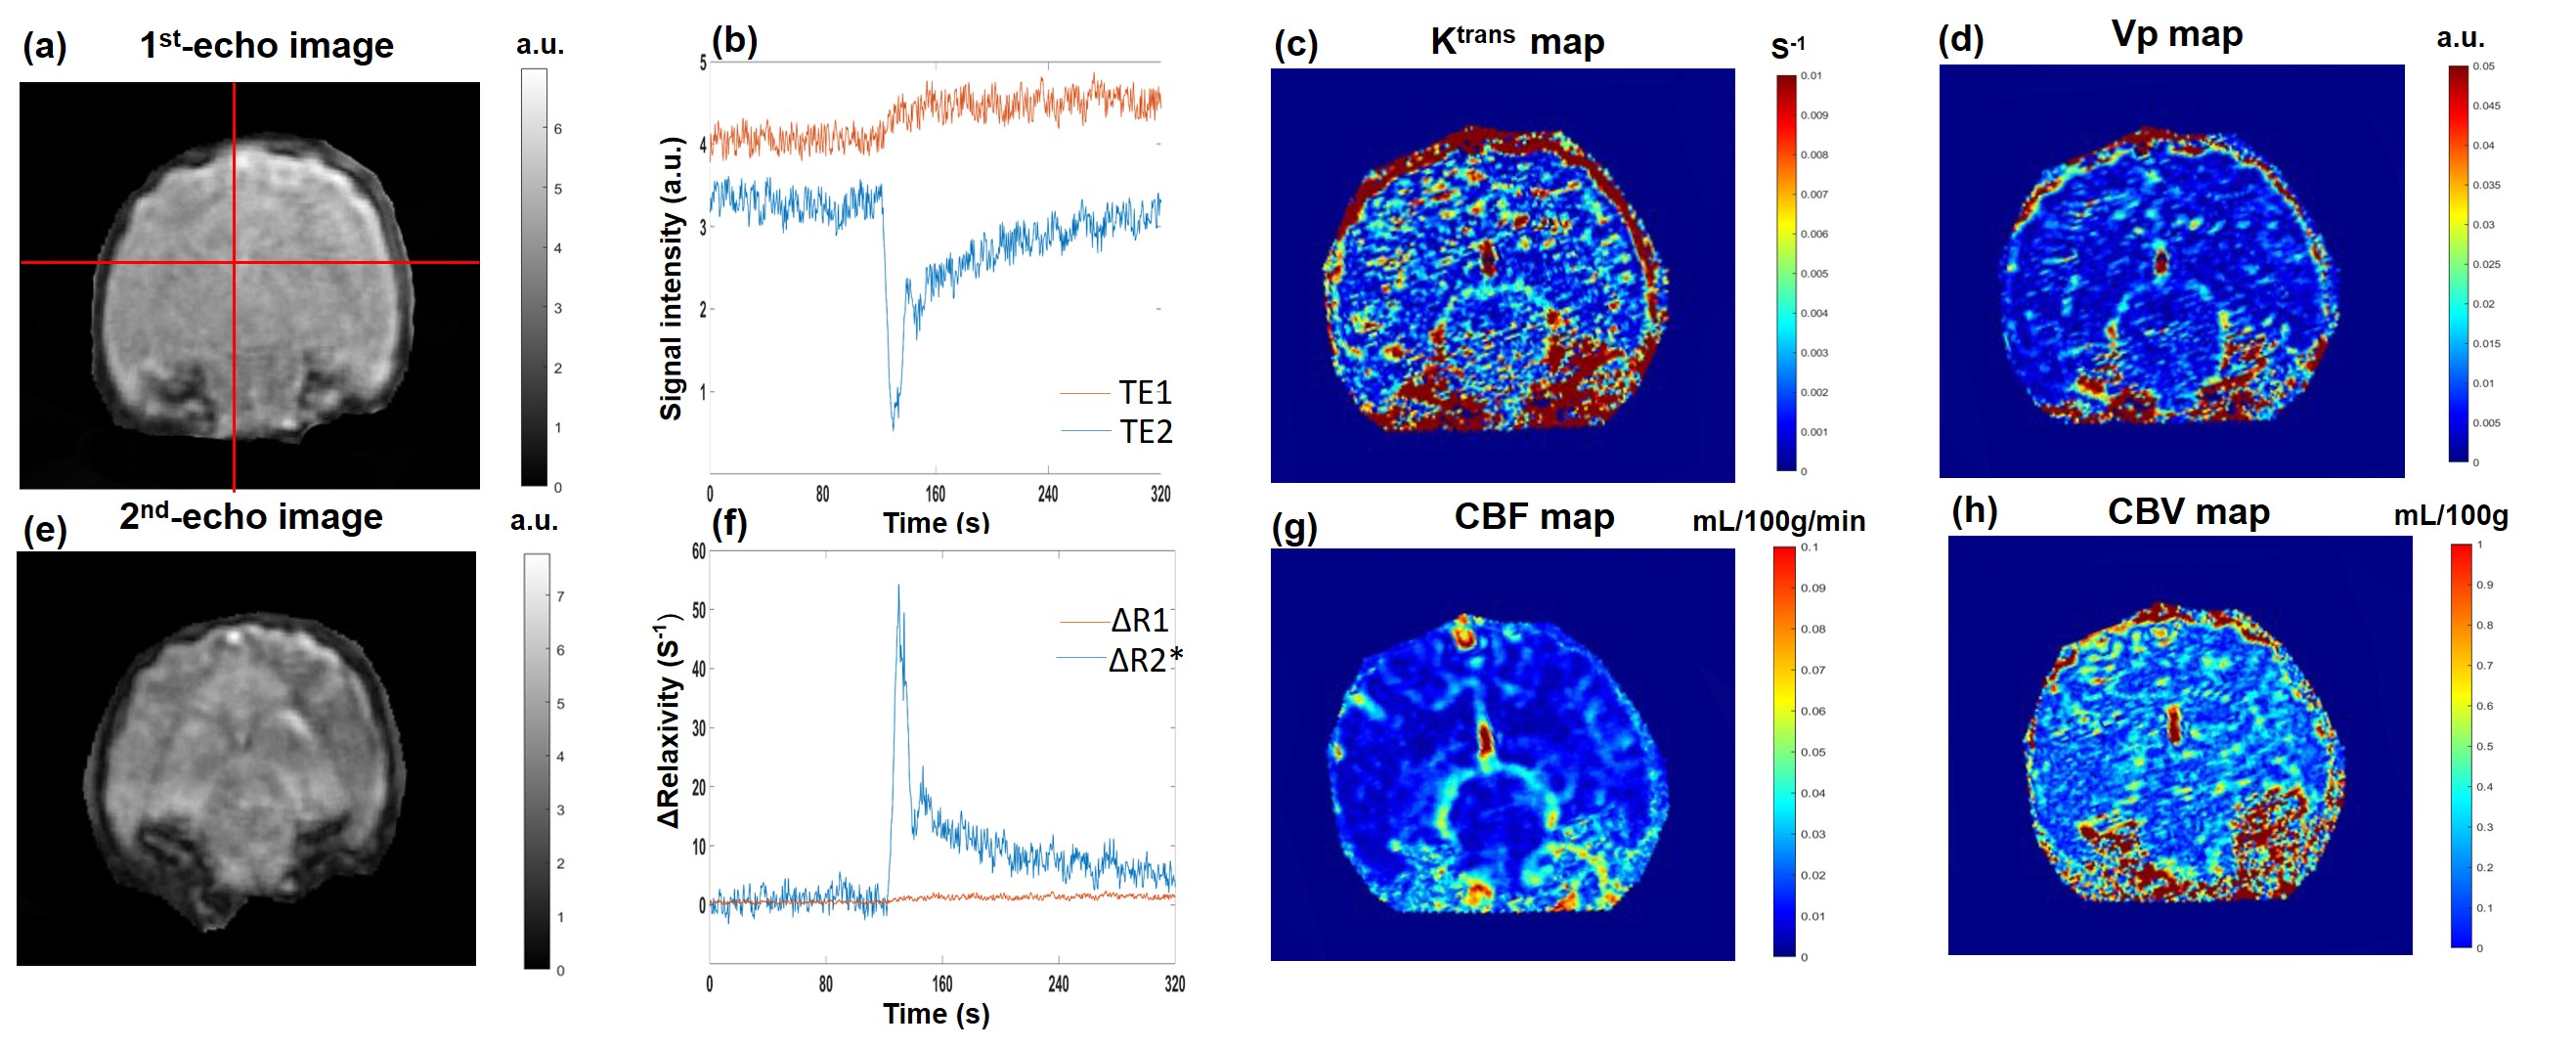
Figure 1 displays the multi-shot dual-echo spiral sequence diagram. TE1 is 1st echo time and TE2 is 2nd echo time of this spiral sequence. The first spiral-out echo is used to collect DCE data, and the second spiral-in echo is used to collect DSC data. Figure 2(a) and (e) display the reconstructed spiral images from 1st and 2nd of the perfusion-weighted images for the brain of beagle canines with intravenous mannitol, respectively. The in-plane resolution is 0.78mm and the temporal resolution is 0.52 second. The structure of the canine brain is clearly shown. The representative signal intensity time courses displayed in Figure 2(b) shows the signal intensity time courses of the two echoes, respectively. Estimates of Ktrans and Vp obtained from Patlak model fitting show the BBB open after mannitol injection in Figure 2(c) and (d). Figure 2(f) displays R1 changes and R2* changes of brain from DCE signals (red curve) and DSC signals (blue curve) respectively. Estimates of CBF and CBV are displayed in Figure 2(g) and (h). These results suggest that both DSC and DCE parameters can be obtained simultaneously using a multi-shot iSOI acquisition method with a standard dose of contrast agent.Discussion
This sequence can realize DCE and DSC in a single-dose scan. The repetition time (TR) is crucial to the contrast type. Hence, an optimum TR should be considered. Ultra-short TR which enables fast scan is not suitable with this sequence. After mannitol injection, the BBB will open and the contrast agent will perfuse into the brain of canines. Therefore, signal intensity-time curves of both echoes show perfusion-like. The relaxivity changes can be used to calculate the arterial input function, which is important for the DCE.7 Noteworthy, the R2* is robust to noise which this sequence can obtained. As a result, the DSC data can be used to optimum calculations of DCE perfusion parameters. Estimations of Ktrans, Vp, CBV and CBF show the brain perfusions.Conclusion
We have presented the theory and feasibility of a dual-echo spiral-based perfusion imaging method by which DSC-and DCE-MRI perfusion imaging data can be derived simultaneously, with high temporal and spatial resolution using only a single dose of contrast agent. This approach has several distinct advantages over the more common approach of obtaining DSC and DCE data separately and with different imaging sequences. An important advantage of the approach is that all data can be obtained using only a single-dose contrast agent. This advantage is of particular importance given the recent restrictions implemented by the Food and Drug Administration on the use of Gd-based agents because of the small but real risk of nephrogenic systemic fibrosis and more recent concerns regarding Gd deposition in brain.Acknowledgements
This work was supported by the National Natural Science Foundation of China (NSFC) (No. 61971151)References
1. McDonald R, McDonald J, Newhouse J, et al. Controversies in contrast material-induced acute kidney injury: closing in on the truth? Radiology 2015; 277: 627–632. 2. Kanal E, Tweedle M. Residual or retained gadolinium: practical implications for radiologists and our patients. Radiology 2015;275: 630–634. 3. McDonald R, McDonald J, Kallmes D, et al. Gadolinium deposition in human brain tissues after contrast-enhanced MR imaging in adult patients without intracranial abnormalities. Radiology 2017;285: 546–554. 4. Marica C, David L, Patrick W, et al. Comparison of ASL and DCE MRI for the non-invasive measurement of renal blood flow: quantification and reproducibility. Eur Radiol 2014; 24:1300–1308. 5. Simon L, Pierre R, Maxime G, et al. Feasibility of human spinal cord perfusion mapping using dynamic susceptibility contrast imaging at 7T: Preliminary results and identified guidelines. 2020; 00: 1–12. 6. Lindsay W. Dynamic contrast-enhanced MRI in the diagnosis and management of breast cancer. NMR IN BIOMEDICINE 2009; 22: 28-39. 7. McDonald R, McDonald J, Kallmes D, et al. Intracranial gadolinium deposition after contrast-enhanced MR imaging. Radiology 2015; 275 (3): 772–782.Figures
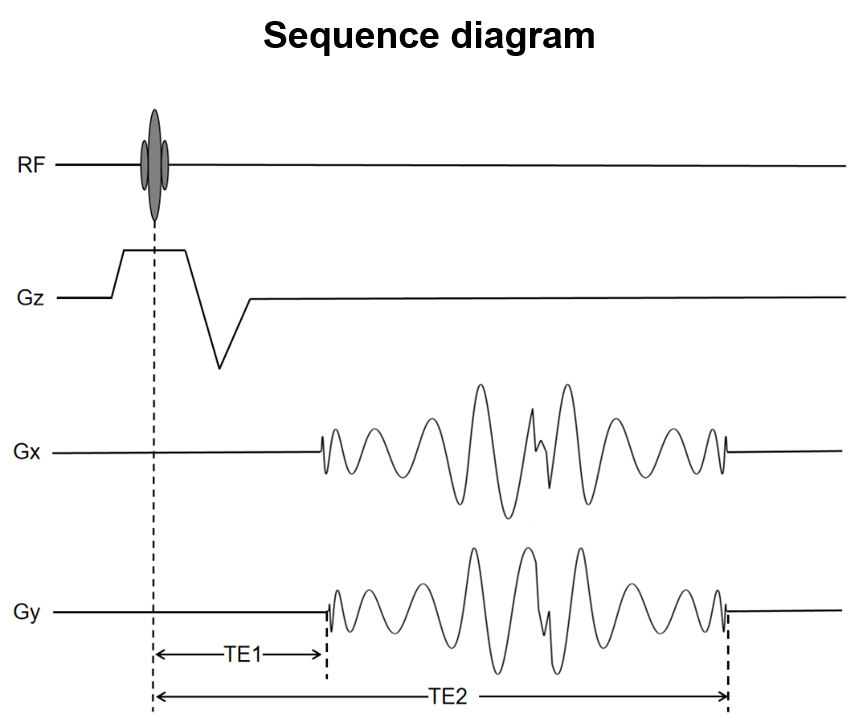
Figure
1. The multi-shot dual-echo spiral
sequence
diagram.
Figure
2. (a) Image of 1st echo shown T1-weighted. (b) Representative
first and second echo MR signal time courses. (c) Ktrans map; (d) Vp map. (e) Image
of 2nd echo shown T2-weighted. (f) The relaxivities, R2*
and R1 time course. (g) CBF map, (h) CBV map.