1109
Significance of 3D Isotropic Resolution for Image Texture Analysis of Pharmacokinetic Model Parametric Maps1Radiology, Weil Cornell Medical College, New York, NY, United States, 2Center for Biomedical Imaging (CBI), Center for Advanced Imaging Innovation and Research (CAI2R), New York University School of Medicine, New York, NY, United States
Synopsis
Quantitative analysis of MRI image features for estimating tumor grading and treatment response is a growing area of research, however a lack of reproducibility and validation present a major challenge in the field. Our study investigates how spatial resolution affects texture features of DCE-MRI images by comparing features generated from 3D isotropic high resolution kinetic parameter maps with typical thick slice maps. We demonstrate that 3D textural features can differ by several orders of magnitude when extracted from isotropic versus thick slice images. These findings have potentially significant implications in the predictive capabilities of texture features.
Introduction
Tumor heterogeneity captured by image texture features derived from DCE-MRI images have been shown to estimate tumor grading and response to treatment,1-5 however, typical 2D multi-slice acquisition methods fall short on capturing the complexity of a tumor microenvironment. 3D texture features have been shown to be more robust than 2D texture features but are limited as 3D features require the up sampling of thick slice images to isotropic resolution. Our study compares the DCE-MRI kinetic parameter maps acquired with 3D isotropic high resolution to those with thick slices to investigate the impact of resolution on image feature analysis.Methods
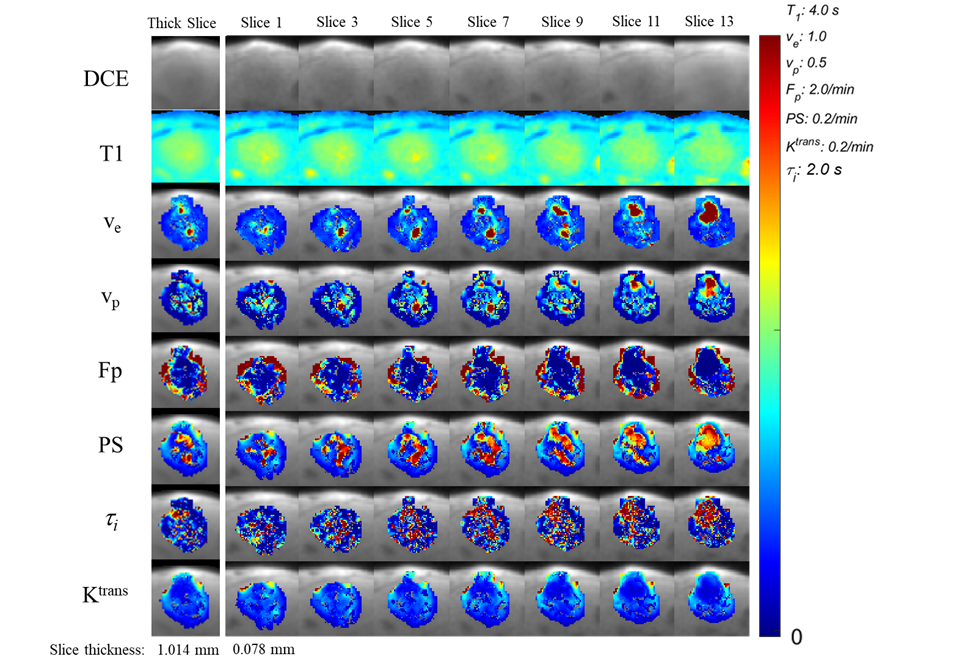
Six to eight-week-old C57BL6 mice (n=8) with GL261 mouse glioma xenograft models were used in this study. MRI scans were performed on a Bruker 7T micro-MRI system, with a 1H four-channel phased array receive-only MRI CryoProbe with a volume transmit coil. The GRASP method6 was used to acquired dynamic contrast-enhance data (TR/TE = 4 / 0.028 ms) with image matrix = 128 x 128 x 128, up sampled to 256x256x256, and field of view = 20 x 20 x 20 mm3. In order to achieve contrast encoding for τi measurement, this sequence was continuously run to acquire 154,080 spokes with two flip angles (51,360 spokes for each flip angle segment 8o - 25o - 8o) for 10 minutes and 13 seconds. Pre-contrast T1 mapping was obtained using the 3D-UTE-GRASP sequence with 38,328 spokes (12,776 spokes for each flip angle segment 8o - 2o - 12o), for a total acquisition time of 153 s at the same resolution as the DCE scan. The joint compressed sensing and parallel imaging reconstruction was implemented based on the 3D-UTE-GRASP algorithm6 with temporal frame resolution T = 5 s/frame. Arterial input function (AIF) was obtained following the Principal Component Analysis (PCA) method used in our previous study7 with the independently measured T1 map. The T1 weighted images were also used to manually segment whole tumors. Pharmacokinetic model analysis was carried out for the whole tumor with the same Two Compartment Exchange Model (TCM)8 and Three Site Two Exchange (3S2X)9 Model for τi estimation with the two-flip angle approach.7 Five parameters, interstitial space volume fraction (ve), vascular space volume fraction (vp), blood flow (Fp), permeability surface area product (PS), and intracellular water lifetime (τi) were estimated from the model fit. Transfer constant (Ktrans) was calculated from PS and Fp.To compare parameter maps from our 3D isotropic high-resolution images with traditional thick slice DCE-MRI images we subdivided the tumor ROI into 13 slice sections (0.078 mm slice thickness) and took a vector average of each slice section to emulate same in plane resolution but with a depth of 1 mm (0.078 mm x 13 =1.016 mm). Pharmacokinetic modeling was then carried out for the simulated thick slice images.
Using the open-source python package PyRadiomics,10 parameter map intensity histogram features (n=18) and texture features(n=68) were calculated for both isometric and thick slice images. For 3D texture feature extraction, the thick slice images were up sampled to isotropic resolution of 256x256x256. Discretization of parameter maps was performed using a fixed bin width determined by: W = 2 (IQR) N-1/3; where IQR is the interquartile range and N is the number of pixels.11 The default PyRadiomics settings were used for all other parameters. The difference of features between isometric and thick slice images was defined as the absolute value of the difference between the log transform of a given feature value.
Results and Discussion
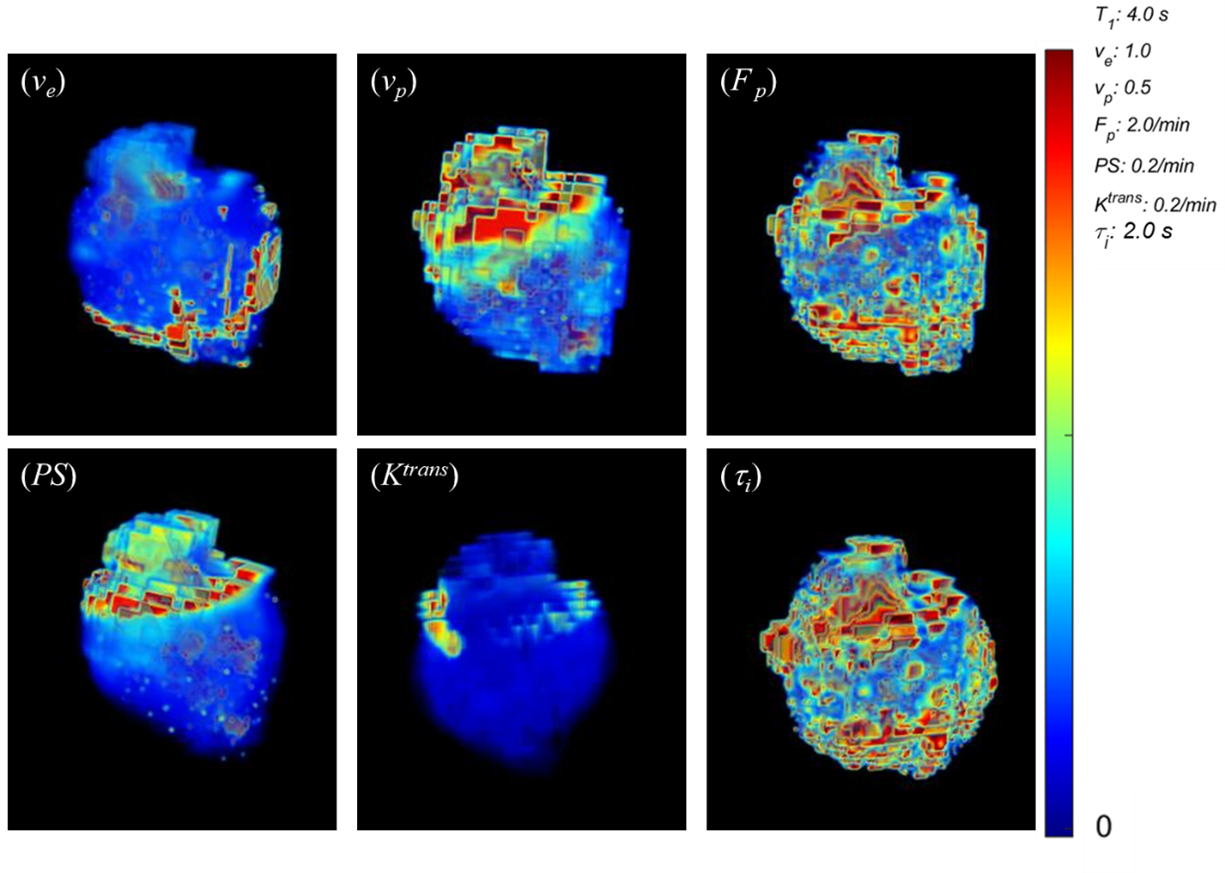
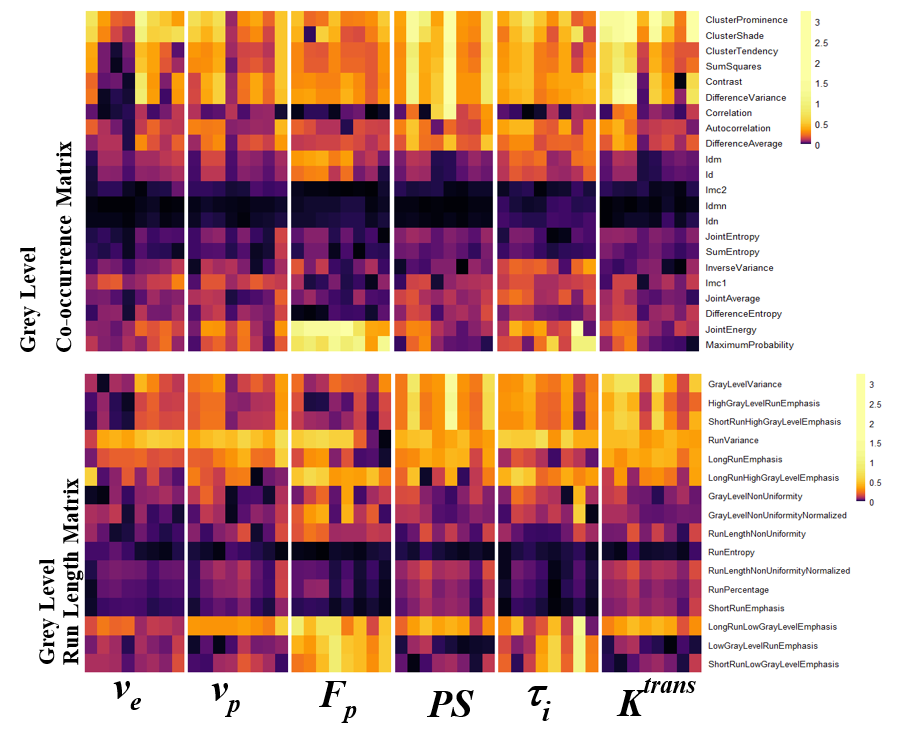
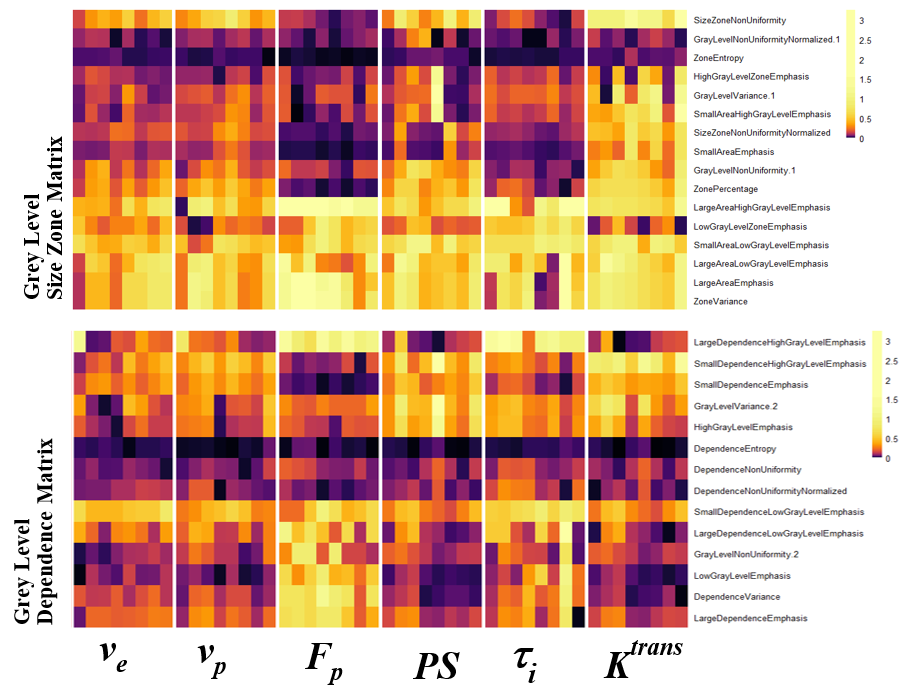
Figure 1 depicts volume renderings of the 3D isotropic high resolution kinetic parameter maps of a mouse glioma tumor. Figure 2 demonstrates the isotropic parameter map slices (Slice 1 - Slice 13, spatial resolution of 0.078 x 0.078 x 0.078 mm3), and the thick slice parameter maps (spatial resolution of 0.078 x 0.078 x 1.016 mm3) estimated from the vector average of the isometric slices. Figure 3 and 4 are heatmaps of texture feature differences from isotropic versus thick parameter maps, displaying differences of several orders of magnitude. These include the texture features largely related to image heterogeneity, found to be significant in recent cancer imaging studies. One study demonstrated such features, from thick slice parameter maps, to be most predictive of breast cancer therapy response.1 Of the 9 most predictive features in this study, we found the Co-occurance Matrix (GLCM) defined features of: difference entropy, contrast, difference variance and the Run Length Matrix (GLRLM) defined features of: gray-level nonuniformity and long run emphasis to be impacted by several orders of magnitude when extracted from isometric maps versus thick slice maps. Furthermore, texture features relating to heterogeneity correlating with Ki-67 expression in breast tumors, such as GLCM contrast, correlation and GLRLM long run low grey level emphasis and long run high grey level emphasis are also impacted by being measured from isotropic versus thick slice images.3,4Conclusion
For 3D texture feature analysis, thick slice images must be up sampled for the analysis. This could create an inference of information, potentially obfuscating texture features of the image and impacting its predictive ability. To improve reproducibility in texture features and best capture tumor heterogeneity, DCE-MRI images would benefit from an isotropic resolution acquisition.Acknowledgements
NIH R01CA160620, NIH R01CA219964, UG3CA22869References
1. Thibault G, Tudorica A, Afzal A, Chui SY, Naik A, Troxell ML, Kemmer KA, Oh KY, Roy N, Jafarian N, Holtorf ML, Huang W, Song X. DCE-MRI Texture Features for Early Prediction of Breast Cancer Therapy Response. Tomography. 2017;3(1):23-32.
2. Niu Q, Jiang X, Li Q, et al. Texture features and pharmacokinetic parameters in differentiating benign and malignant breast lesions by dynamic contrast enhanced magnetic resonance imaging. Oncol Lett. 2018;16(4):4607-4613.
3. Juan MW, Yu J, Peng GX, Jun LJ, Feng SP, Fang LP. Correlation between DCE-MRI radiomics features and Ki-67 expression in invasive breast cancer. Oncol Lett. 2018;16(4):5084-5090.
4. Ma W, Ji Y, Qi L, Guo X, Jian X, Liu P. Breast cancer Ki67 expression prediction by DCE-MRI radiomics features. Clin Radiol. 2018;73(10):909.e1-909.e5.
5. Liu M, Mao N, Ma H, et al. Pharmacokinetic parameters and radiomics model based on dynamic contrast enhanced MRI for the preoperative prediction of sentinel lymph node metastasis in breast cancer. Cancer Imaging. 2020;20(1):65.
6. Zhang, J., Feng, L., Otazo, R., & Kim, S. G. Rapid dynamic contrast-enhanced MRI for small animals at 7T using 3D ultra-short echo time and golden-angle radial sparse parallel MRI. Magnetic Resonance in Medicine. 2019;81(1), 140–152.
7. Zhang, J., & Kim, S. G. Estimation of cellular-interstitial water exchange in dynamic contrast enhanced MRI using two flip angles. NMR in Biomedicine. 2019;32(11), 1–17.
8. Sourbron SP, Buckley DL. Tracer kinetic modelling in MRI: estimating perfusion and capillary permeability. Phys Med Biol. 2012;57(2):R1-33.
9. McConnell, H. M. Reaction rates by nuclear magnetic resonance. The Journal of Chemical Physics. 1958; 28(3), 430–431.
10. van Griethuysen, J. J. M., Fedorov, A., Parmar, C., Hosny, A., Aucoin, N., Narayan, V., Beets-Tan, R. G. H., Fillon-Robin, J. C., Pieper, S., Aerts, H. J. W. L. Computational Radiomics System to Decode the Radiographic Phenotype. Cancer Research. 2017; 77(21)
11. Izenman, A. J. Recent developments in nonparametric density estimation. Journal of the American Statistical Association. 1991; 86(413):205-224.
12. Lambin, P. Radiomics Digital Phantom. CancerData. 2016; 41(2), 366–373.
Figures