1107
Use of Reference Region Model to Improve Arterial Input Function Selection for Estimating Kidney Function with DCE-MRI1Radiology, Boston Children's Hospital and Harvard Medical School, Boston, MA, United States
Synopsis
Estimating glomerular filtration rate (GFR) is crucial for diagnostic purposes. DCE-MRI is capable of measuring tracer kinetic parameters of kidney function. Tracer kinetic models require arterial input function to find tracer kinetic parameters such as filtration rate. However, determining the arterial input function concentration is challenging and important for estimating GFR accurately. Here, we propose to use reference region model to improve arterial input function selection to estimate GFR more accurately. Comparing the GFR values estimated using the improved arterial input function with the ground truth GFR, we have observed a significant decrease in the mean absolute error in GFR.
Introduction
Estimating glomerular filtration rate accurately (GFR) is crucial for diagnosing hydronephrosis and determining which patients should be considered for surgery in the case of obstruction1. Dynamic contrast-enhanced MRI is a promising tool to estimate tracer kinetic (TK) parameters that are used to compute GFR. These models require accurate measurement and selection of arterial input function (AIF) for accurate estimation of GFR. An example for dependence of AIF on segmentation region is depicted in Figure 1a. One of the methods used in the case of unavailability of an accurate AIF is measuring concentration in a reference region such as muscle to estimate TK parameters. Here, we propose to select an accurate AIF using a reference region2 and input function tail (RRIFT)3 model among a set of candidate AIFs (Figure 1b). RRIFT is used with constrained extended reference region model (CERRM)2 to compute the efflux rate of the reference region. We then use this AIF to estimate perfusion and filtration rate parameters of kidneys using the separable 2-compartment (2-CP) model by Sourbron et al.4.Methods
The block diagram of the proposed methodology to select AIF using an exhaustive search is demonstrated in Figure 2. A set of candidate AIFs was constructed using a threshold parameter αi. The voxels inside the segmented aorta which have a peak (i.e., maximum aorta signal) larger than αi percent of the maximum aorta signal are averaged to obtain an AIF. We changed αi from 0 to 100 to generate the set of possible AIFs (Cp(αi)).Using the concentration of the reference region (CRR) and the tail of Cp(αi), tracer kinetic parameters (Ktrans_RRIFT, kep_RRIFT, vp_RRIFT) were estimated using the RRIFT model. This model does not use the entire AIF but only uses its tail together with the Psoas muscle as a reference region to estimate parameters of the Extended Tofts Model (ETM)5,6 for kidneys. We set the Ktrans_RRIFT parameter from this model as the reference value of Ktrans, which is then used to determine αi, resulting in the most accurate AIF. For each AIF candidate Cp(αi), we used ETM to estimate Ktrans_ETM for each kidney. We then selected the AIF parameter αi which minimizes the total absolute error between reference Ktrans (Ktrans_RRIFT) and the estimated Ktrans (Ktrans_ETM) using the following equation: $$$α_{sel}=arg min_{\alpha_i} \sum_k |K_{transETM}-K_{transRRIFT}|$$$. The selected αi is denoted as αsel. and the index of summation "k" is the tissue index (k=1 right kidney, k=2 left kidney).
After determining the selected AIF using αsel, we then used the separable 2-CP model to compute the filtration rate parameter (FT) which is then used to compute GFR for each kidney and the total GFR. The GFR is then normalized to the body surface area (BSA) of 1.73 m2. We compared the GFR values estimated using the selected AIF and estimated using an initial AIF. Note that the initial AIF parameter was set to α0=9%.
The proposed technique was tested on 4D DCE-MRI data involving 5 patients whose GFR values were also measured by nuclear medicine-based test (DTPA-GFR), which is used as the ground truth in this study.
Image acquisition: We acquired DCE-MR images from patients who had a nuclear medicine GFR test and who are undergoing a contrast-enhanced MRI exam using an approved IRB protocol. We used a “stack-of-stars” 3D FLASH prototype sequence with a multi-channel body-matrix coil (3T Siemens Skyra/Trio, TR/TE/FA 3.56/1.39ms/12◦, 32 coronal slices, voxel size=1.25x1.25x3mm, 1326 radial spokes acquired in 6 mins with golden angle radial ordering), average temporal resolution was 3.3 s.
Results
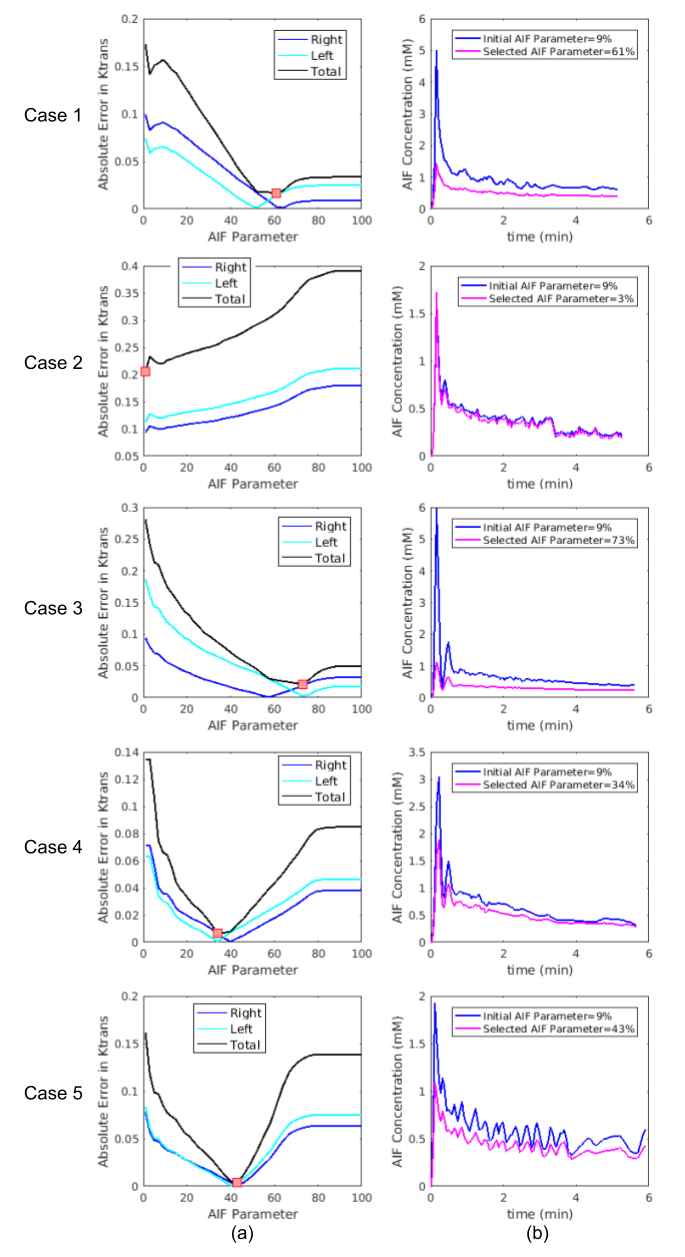
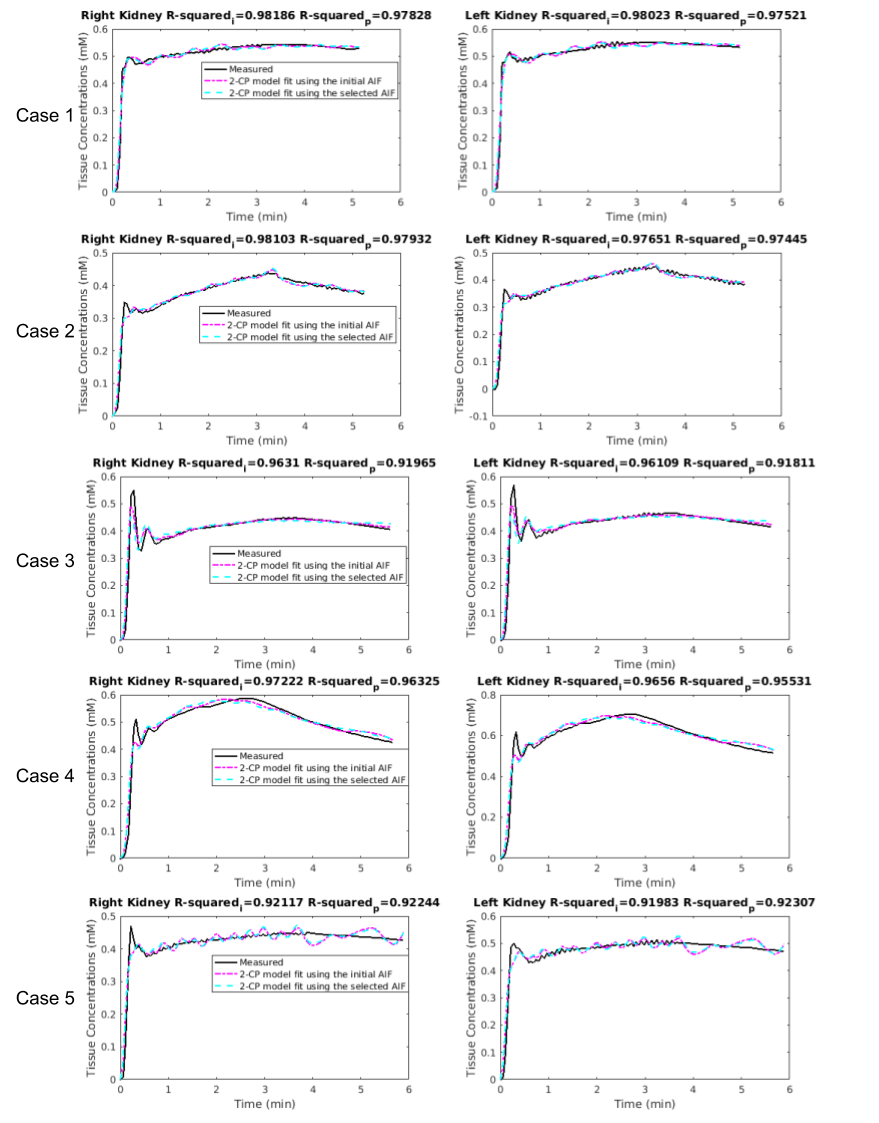
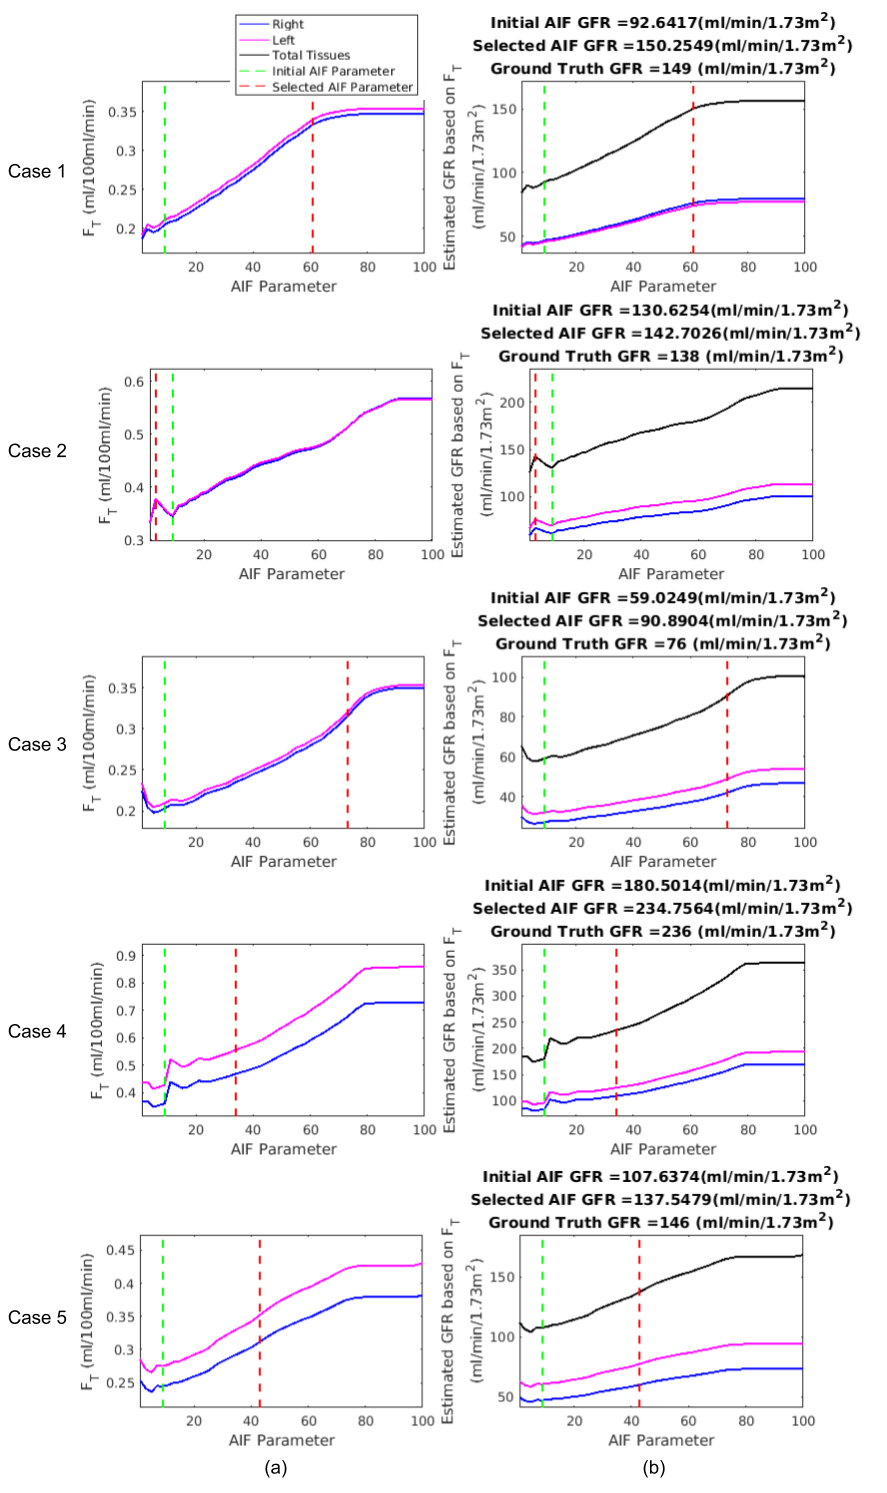
Determining the AIF parameter and corresponding AIF function are depicted in Figure 3. In Figure 4, fitted tissue concentration curves by 2-CP model for the selected AIF is compared with the fitted concentration curves obtained by the initial AIF. In addition, goodness-of-fit of 2-CP model was evaluated by R-squared for each case (Figure 4). Ground truth GFR values and computed normalized total GFR are given in Figure 5.Discussion
We have proposed a method to improve AIF selection using a reference region model and using DCE-MRI data from 5 patients. AIF parameter was selected as the argument minimizing the absolute error in tracer kinetic parameters of a reference region model (i.e., RRIFT) and extended Tofts model, as shown in Figure 3. R-squared values were reported to evaluate goodness-of-fit, resulting in >0.91 for both initial AIF and selected AIF for all cases. Comparing the GFR values computed by 2-CP model with the ground truth, we have observed a significant decrease in the mean absolute error in GFR by reducing it from 34.91 to 6.11 using the optimized AIF compared to the initial AIF (Figure 5).Conclusion
The proposed pipeline results in more accurate estimation of tracer kinetic parameters by improving AIF selection. As future work, number of test subjects should be increased. Furthermore, a similar pipeline can be used for other AIF parameter optimization such as a segmentation region based or parametric equation based.Acknowledgements
This work was supported partially by the grant No 2019056 from the United States-Israel Binational Science Foundation (BSF), the Boston Children's Hospital Translational Research Program Pilot Grant 2018, Society of Pediatric Radiology Multi-center Research Grant 2019, Crohn’s and Colitis Foundation of America’s (CCFA) Career Development Award and by the National Institutes of Health under award numbers R01EB019483, R21DK123569, R21EB029627.References
[1] S. Kurugol et al., “Feed and Wrap Magnetic Resonance Urography Provides Anatomic and Functional Imaging in Infants Without Anesthesia,” J. Pediatr. Urol., 2019.
[2] Ahmed, Z. and Levesque, I.R., 2018. An extended reference region model for DCE‐MRI that accounts for plasma volume. NMR in Biomedicine, 31(7), p.e3924.
[3] Ahmed, Z. and Levesque, I.R., 2020. Pharmacokinetic modeling of dynamic contrast‐enhanced MRI using a reference region and input function tail. Magnetic Resonance in Medicine, 83(1), pp.286-298.
[4] S. P. Sourbron, H. J. Michaely, M. F. Reiser, and S. O. Schoenberg, “MRI-measurement of perfusion and glomerular filtration in the human kidney with a separable compartment model,” Invest. Radiol., vol. 43, no. 1, pp. 40–48, 2008.
[5] Tofts PS. Modeling tracer kinetics in dynamic Gd‐DTPA MR imaging. J Magn Reson Imaging. 1997;7(1):91‐101.
[6] Tofts PS, Brix G, Buckley DL, et al. Estimating kinetic parameters from dynamic contrast‐enhanced T1‐weighted MRI of a diffusable tracer: standardized quantities and symbols. J Magn Reson Imaging. 1999;10:223‐232.
Figures
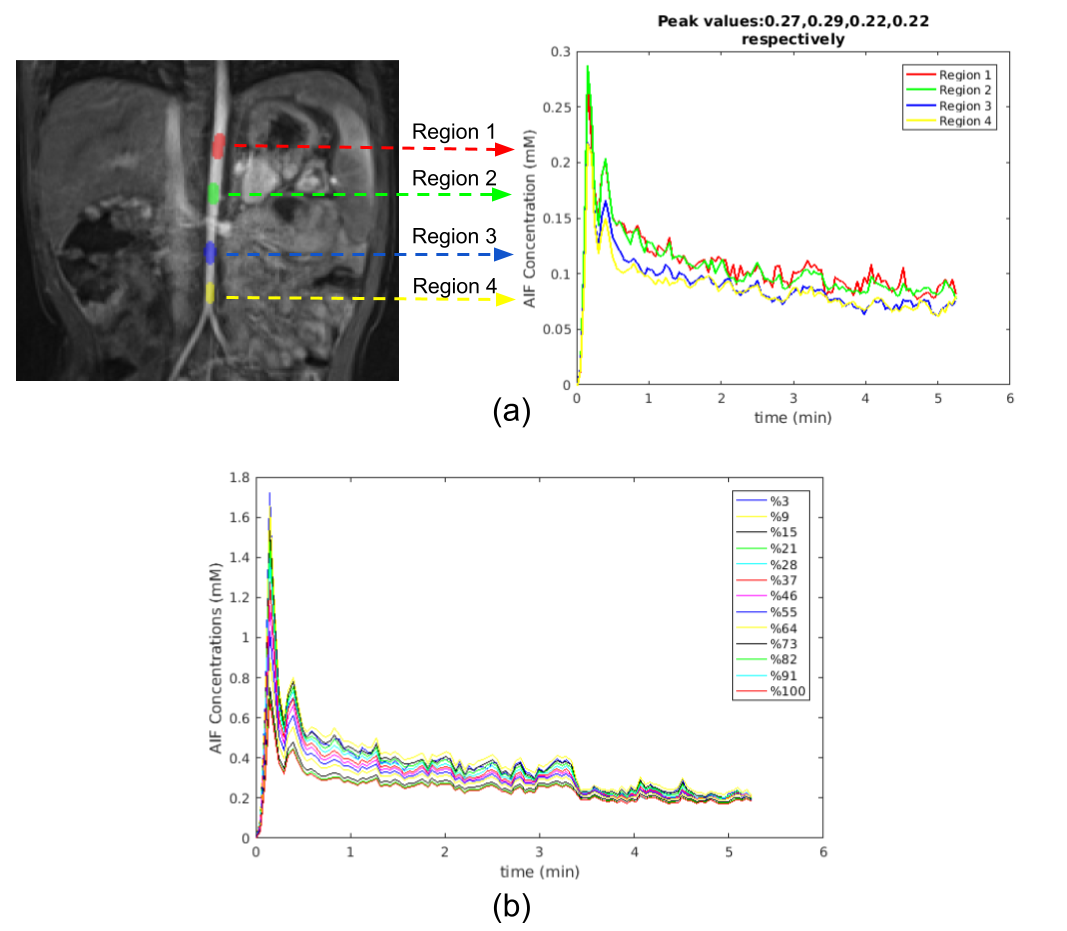
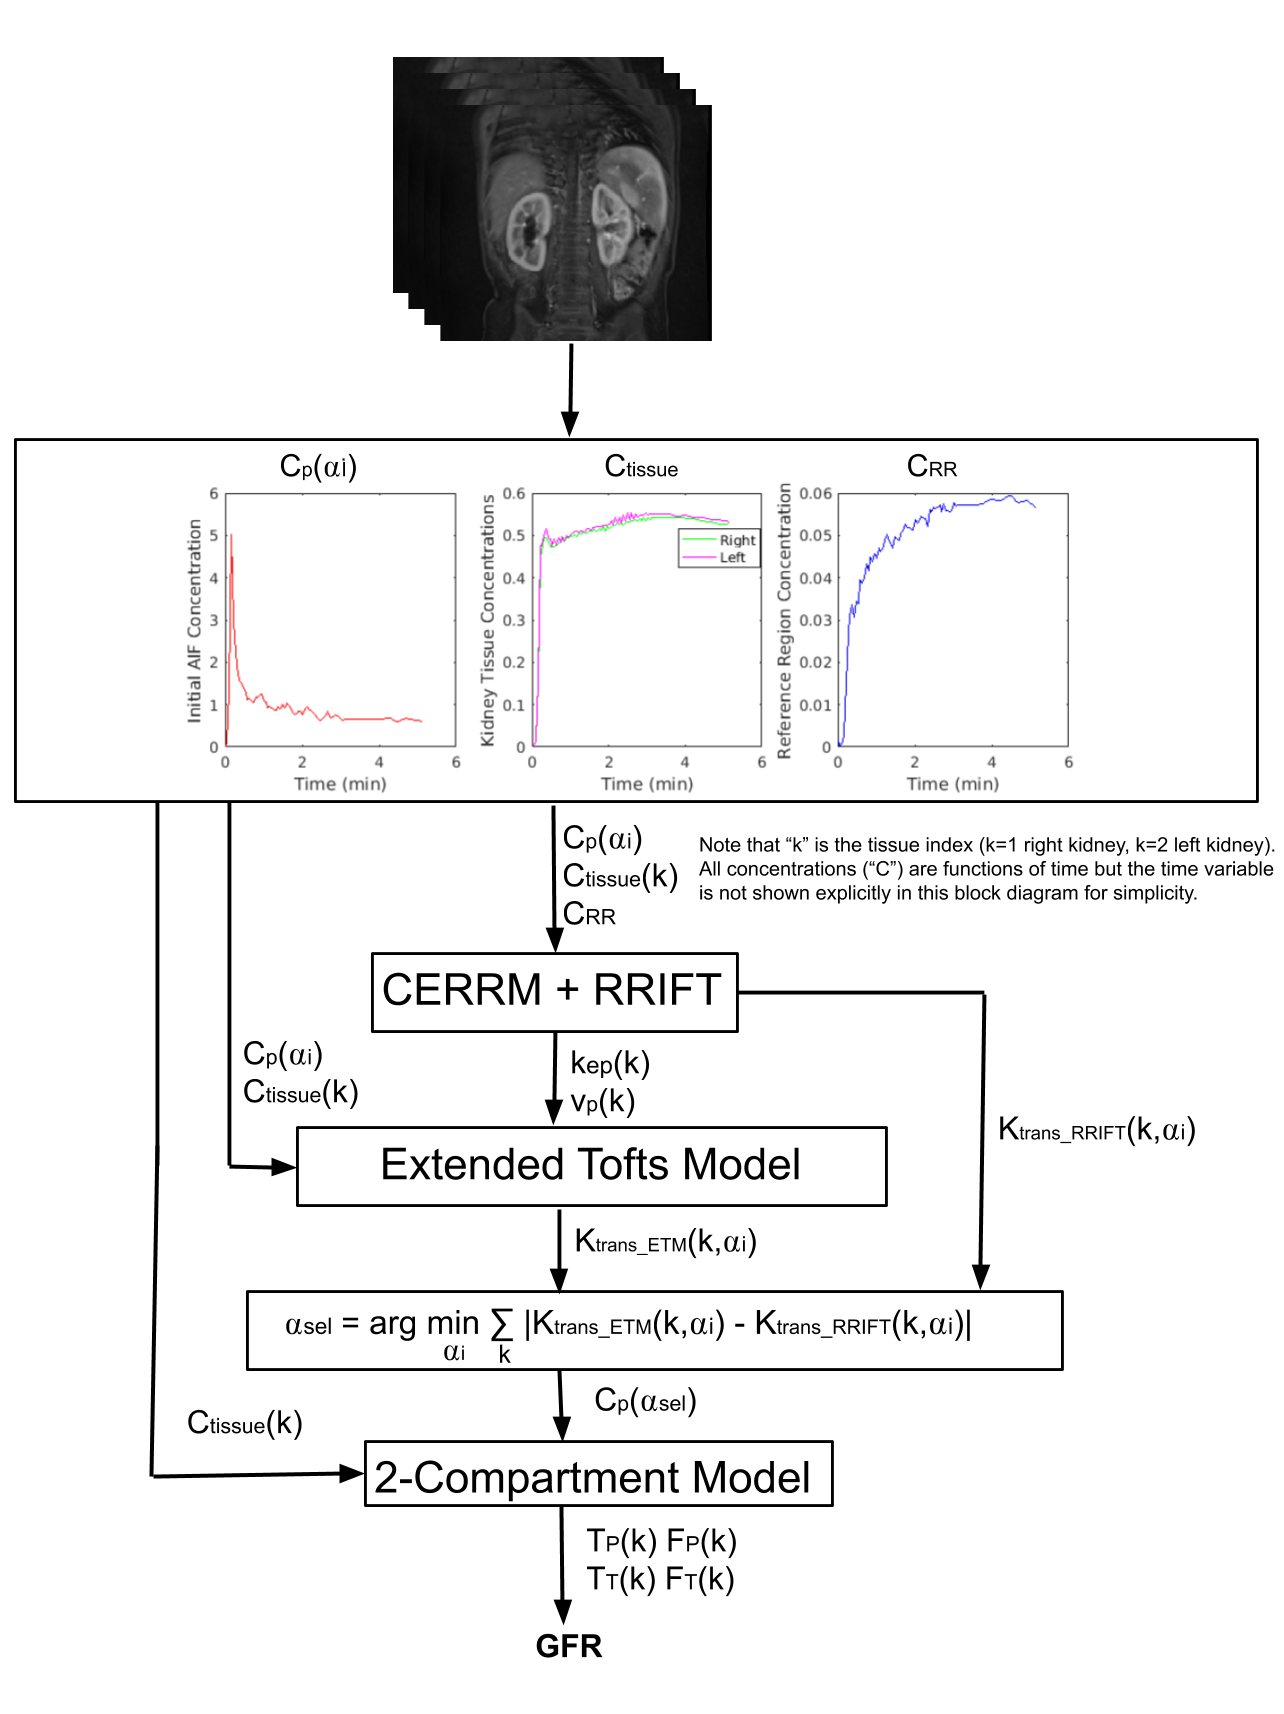
Figure 2. Block diagram of the proposed method to select parameter (αsel) to determine an improved AIF (Cp(αsel)) for accurate estimation of filtration rate (FT). The inputs to the algorithm are AIF (Cp), kidneys (Ctissue) and reference region (CRR) concentration curves extracted from 4D DCE-MRI data. The proposed method selects the AIF parameter αsel resulting in a minimum sum of absolute error of Ktrans_RRIFT and the Ktrans_ETM from ETM using the selected AIF. We then used this selected AIF to compute the filtration rate parameter (FT) using the 2-CP model. FT is used to compute GFR.