1105
Associate Focused Ultrasound-induced MR Signal Changes With Gd-Enhancement and Ktrans1Department of Biomedical Engineering and Environmental Sciences, National Tsing Hua University, Hsinchu, Taiwan, 2Center for Advanced Molecular Imaging and Translation, Chang Gung Memorial Hospital, Taoyuan, Taiwan, 3Department of Electrical Engineering, Chang-gung University, Taoyuan, Taiwan
Synopsis
Blood brain barrier (BBB) can be opened transiently by the cavitation effect with the assist of focused ultrasound (FUS) and microbubble (MB). A previous study proved that FUS-induced MR signal changes can monitor cavitation effect in in vitro phantom experiments. However, whether MR signal changes can reflect BBB opening levels in vivo remains uncertain. In this study, a cavitation index (CI) map was employed to evaluate MR signal changes during FUS sonication in in vivo experiments. We aim to examine the relationship between MR signal change and BBB opening levels by associating CI map with Gd-enhancement and Ktrans maps.
Introduction
Blood brain barrier (BBB) can protect the brain tissue by restricting the diffusion of solutes into the brain. With the assist of focused ultrasound (FUS) and microbubbles, BBB can be opened transiently by the cavitation effect (1). Evaluation of gadolinium (Gd) enhancement and calculation of Ktrans after Gd injection are two common schemes to evaluate BBB opening (2). Gd-enhancement reflects the area with Gd leakage, while Ktrans represents the efflux rate of particle from plasma to tissue, which is often interpreted as the tissue permeability (3). However, both schemes require the injection of Gd and are usually used to evaluate BBB opening after FUS sonication.It has been shown that a half-Fourier acquisition single-shot turbo spin echo (HASTE) sequence can be employed to monitor microbubble cavitation in in vitro experiment (4). Herein, we proposed a cavitation index (CI) map to simultaneously monitor HASTE signal changes in vivo during the procedure of FUS-induced BBB opening. The purpose of this study was to investigate the relationships of MR signal change and BBB opening level by associating CI map with Gd-enhancement and Ktrans maps.
Methods
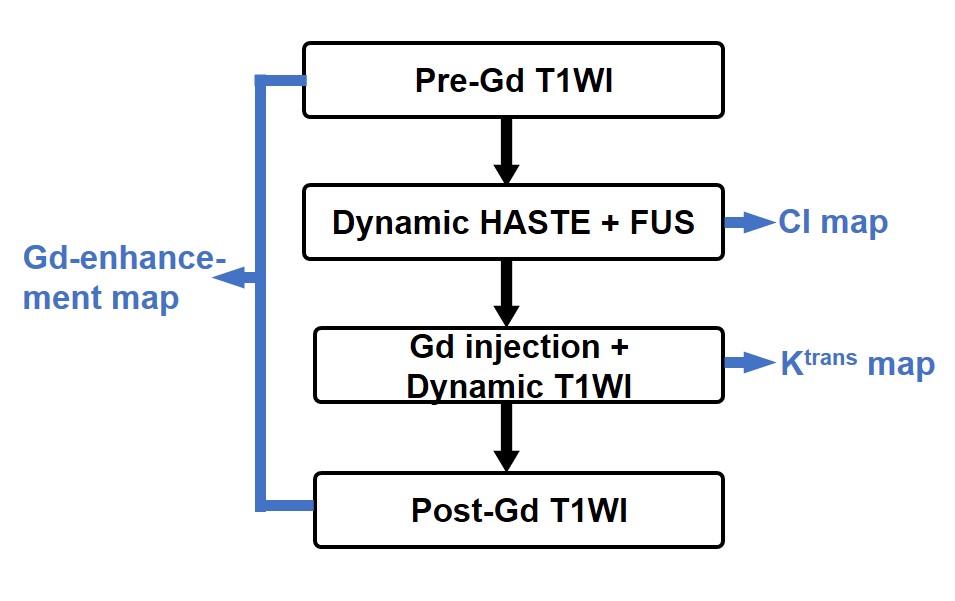
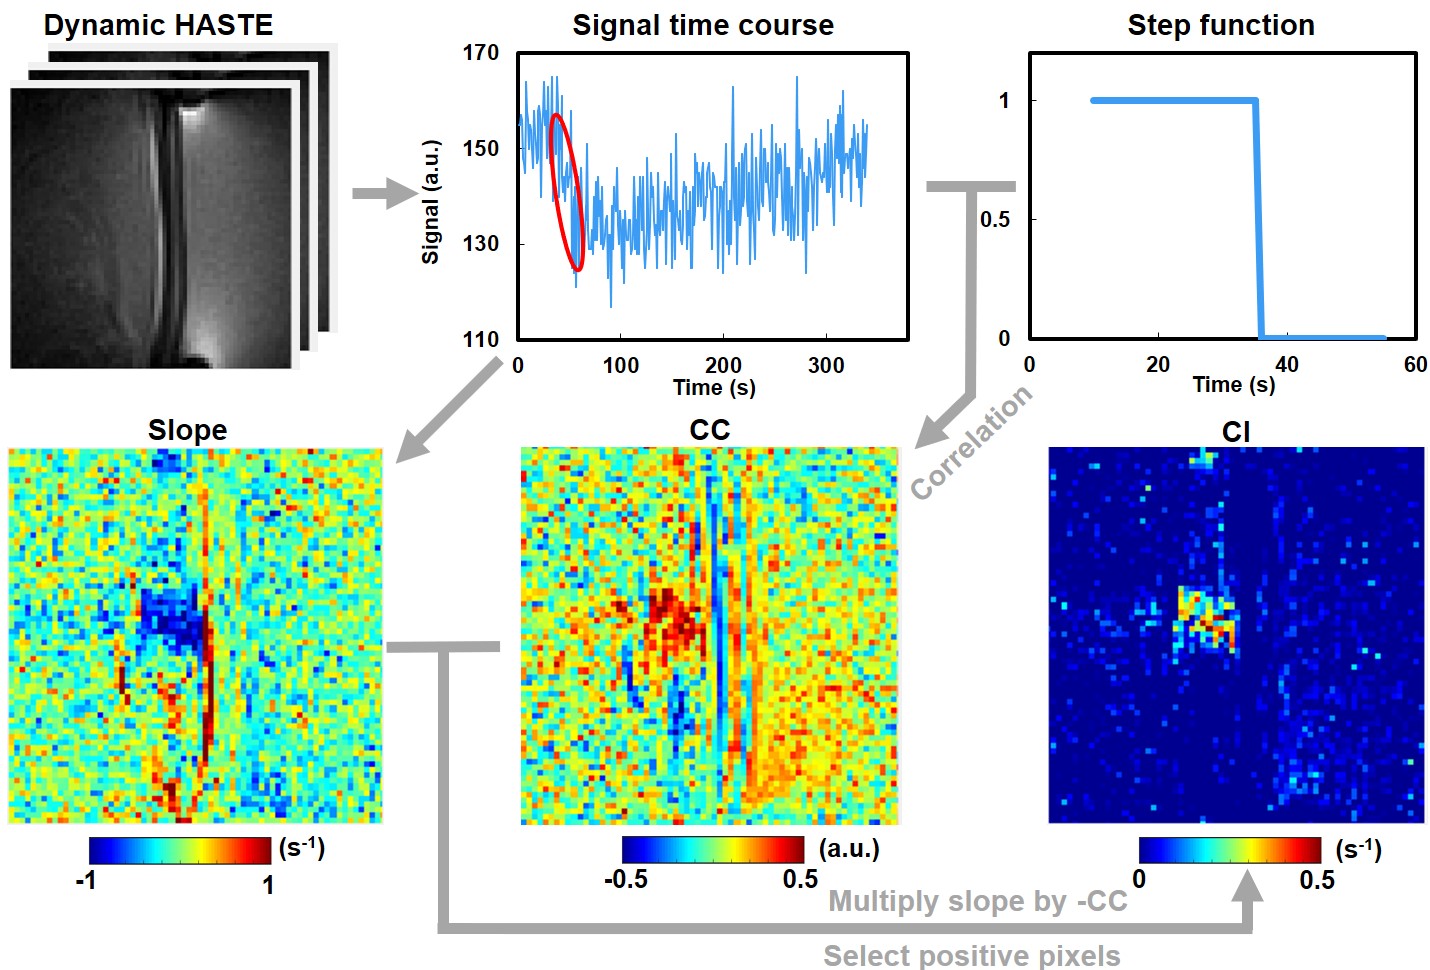
The in vivo experiments included 17 adult Sprague-Dawley rats (weight: 310±30 g). The flow chart of MR image acquisition is shown in Figure 1. We performed dynamic HASTE sequence (TR/TE=900/22 ms, pixel size=0.23x0.23 mm2, flip angle=90°, temporal resolution=0.9 s) in a 7-Tesla MR scanner (ClinScan, Bruker). During HASTE image acquisition, a 1.0-MHz FUS transducer (RK 300, FUS instrument) was used to transmit FUS pulses targeting the cortex ~2-mm beneath the superior sagittal sinus of the rat brain for 60 s starting from t=35 s with acoustic pressure of 0.5 MPa (n=10) and 0.8 MPa (n=7), PRF=10 Hz, duty cycle=10%. A cavitation index (CI) map, reflected the signal changes of HASTE images during FUS transmission, was computed following the flow chart shown in Figure 2.The Gd-enhancement map was computed from pre- and post-Gd T1WI (TR/TE=200/3.81 ms, pixel size=0.23x0.23 mm2, flip angle=70°). To compute Ktrans map, a dynamic series of T1WI (TR/TE=4.9/1.97 ms, pixel size=0.23x0.23 mm2, flip angle=20°, temporal resolution=2.2 s) was acquired with Gd injection. Ktrans map was calculated by a pixel-wise parameter fitting of dynamic T1WI, as described by Tofts et al (3):
$$c_{t}=v_{p}\cdot c_{p}+K^{trans}\cdot\int_{0}^{t}c_{p}\cdot e^{\frac{ -(t-\tau)\cdot K^{trans}}{v_{e}}}d\tau$$
, where Ct and Cp are the Gd concentration of tissue and plasma, respectively, and Ve and Vp are the fractional volume of extravascular extracellular space and plasma, respectively. The Evans blue dye (100mg/kg) was administered 15 min after sonication and the rats were sacrificed within 6 hours after MRI acquisition to perform brain histological sections.
A region-of-interest (ROI) on the focal plane of CI map was semi-automatically determined. Another ROI with 25-pixels in area was manually selected on off-focal plane for comparison. The two determined ROIs were overlaid with CI, Gd-enhancement, and Ktrans maps. The Pearson correlation coefficients between either two indices were evaluated. Pixels with Ktrans > 0.1 were excluded due to the serious noise.
Results
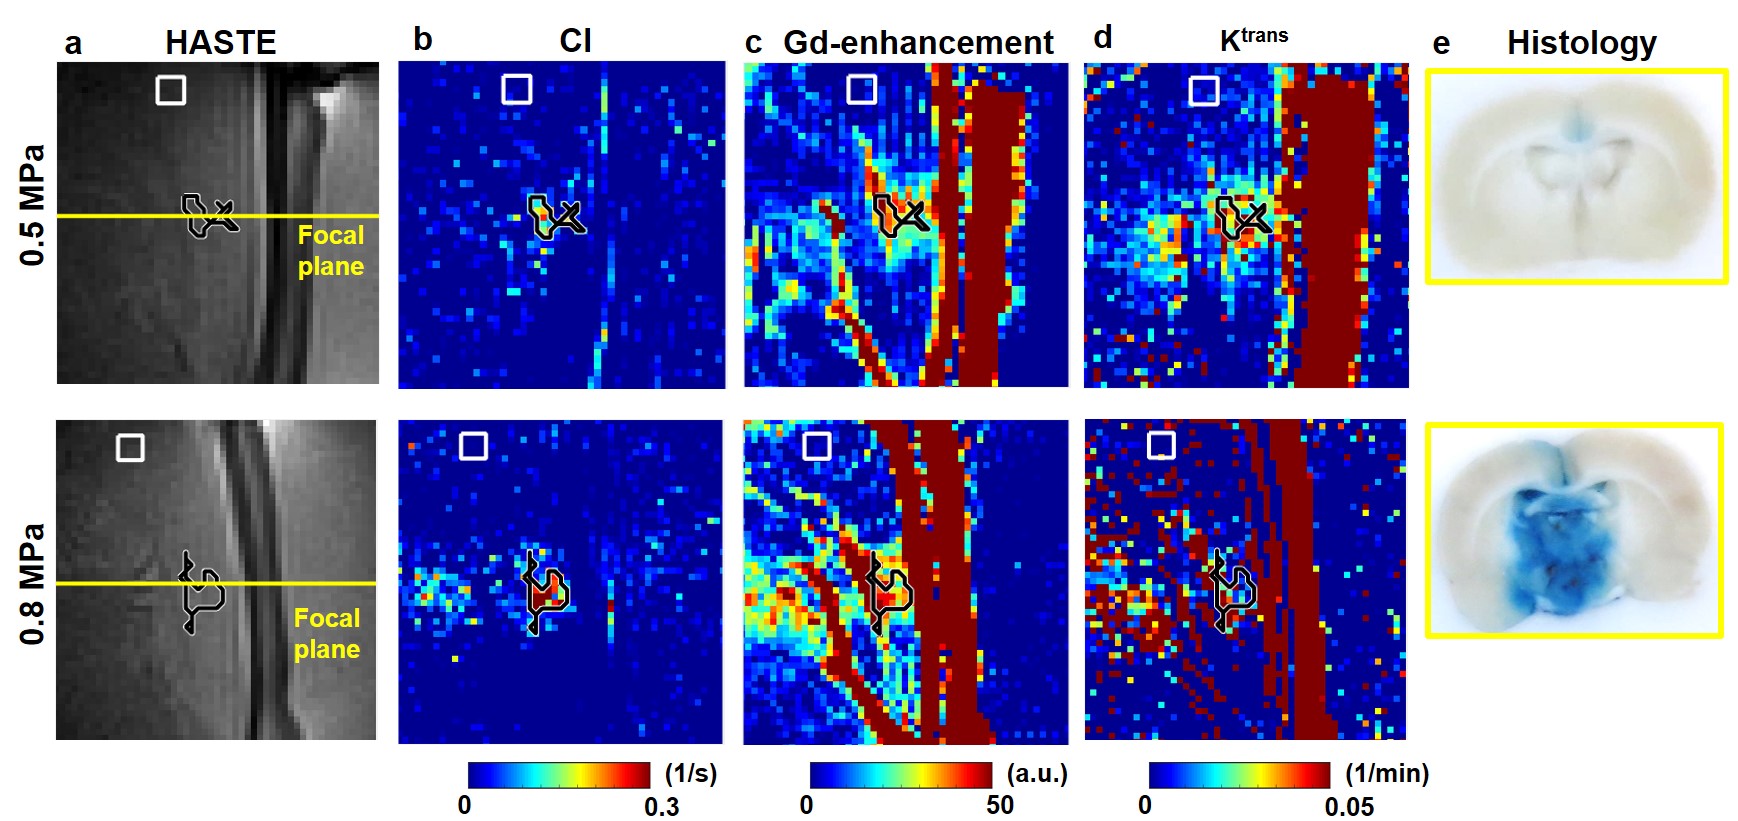
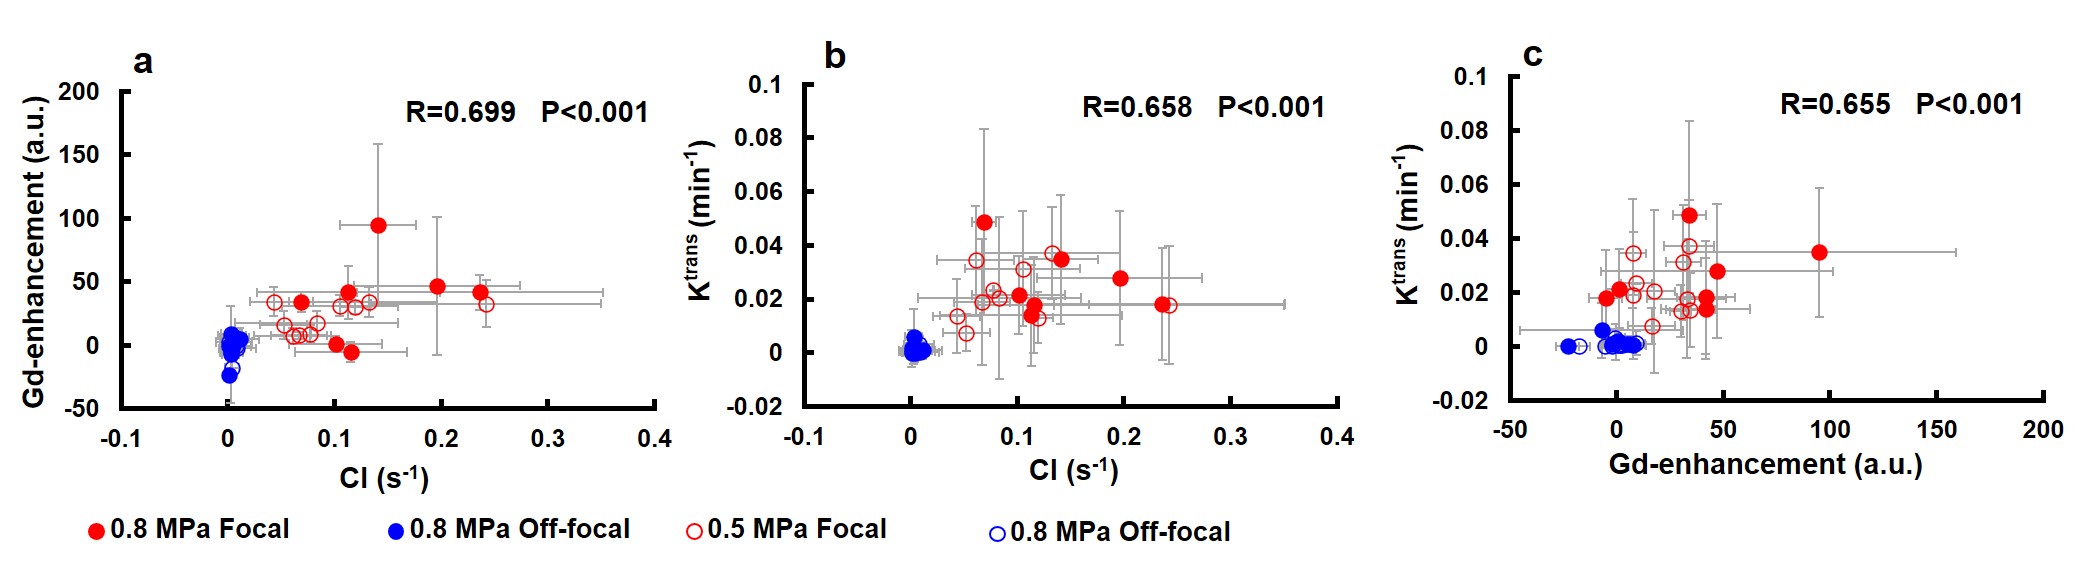
Figure 3 demonstrates the HASTE images, CI maps, Gd-enhancement maps, Ktrans maps, and histology of 0.5- and 0.8-MPa experiments. In the ROI on focal plane, substantial enhancements were shown in the three maps of the two FUS conditions. By contrast, the ROIs on the off-focal plane presented low values in the three maps. The brain histology displayed perceptible leakages of Evens blue after FUS sonication.Figure 4 illustrates the scatter plots which demonstrated the relationship of the mean values within ROIs of focal and off-focal planes in CI, Gd-enhancement and Ktrans maps. The correlation coefficients between Gd-enhancement and CI, Ktrans and CI, and Ktrans and Gd-enhancement were R=0.699, 0.658, and 0.655, respectively (all P<0.001).
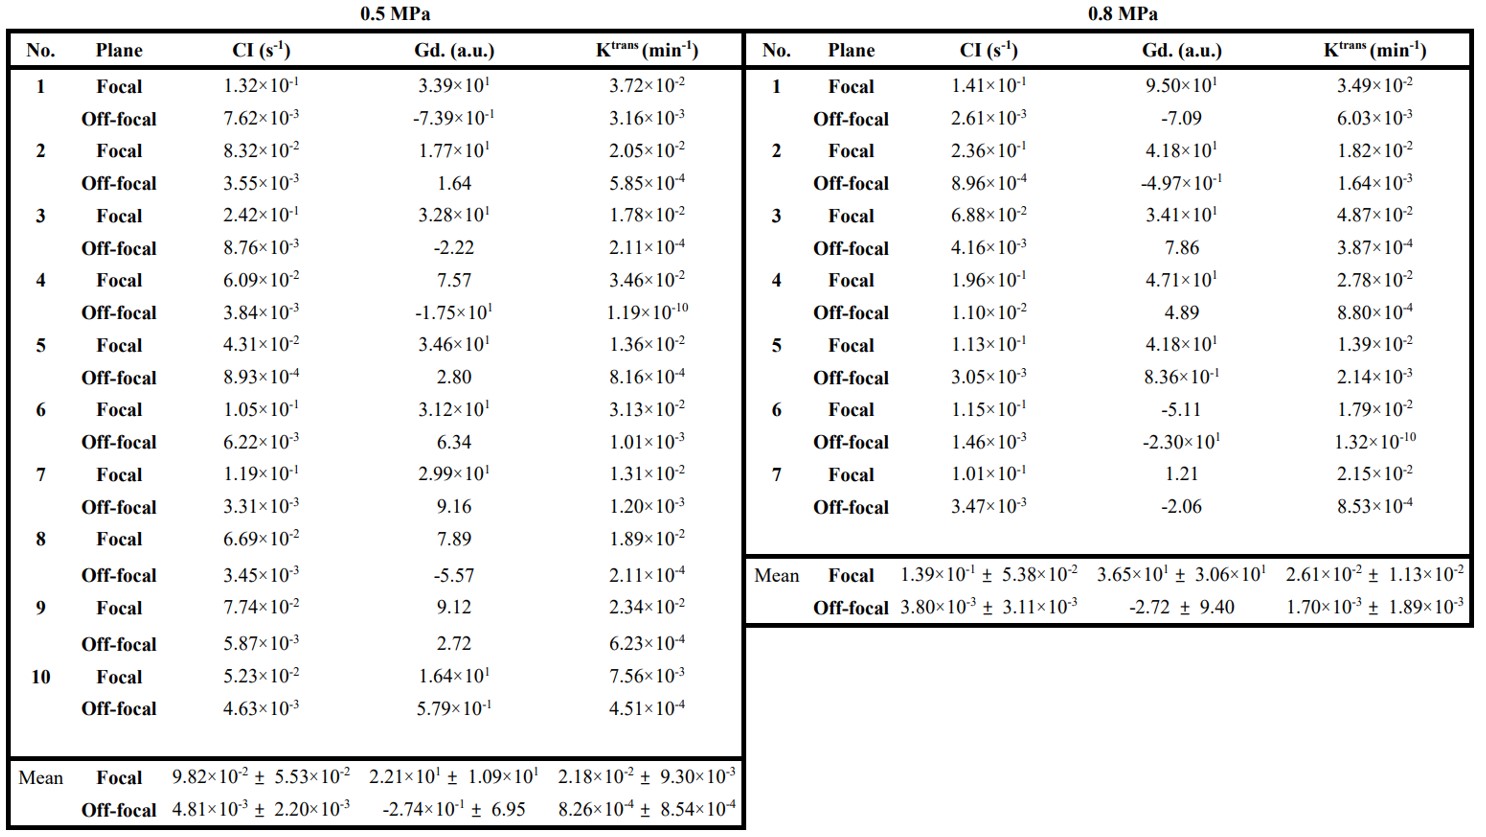
Table 1 lists the results of the individual mean values within the focal and off-focal ROIs in the three maps. Substantial higher CI values were presented in focal ROI than in off-focal ROI in experiments of 0.5-MPa (9.8x10⁻² vs. 4.8x10⁻³ s-1) and 0.8-MPa (1.4x10⁻¹ vs. 3.8x10⁻³ s-1).
Discussion
In this study, a CI map, derived from FUS-induced HASTE signal changes, was computed to real-time monitor the sonicated area. In an ROI analysis, positive correlations were shown between CI, Gd-enhancement and Ktrans maps, implying that CI map without injection of Gd may be an alternative to Gd-enhancement and Ktrans map for evaluating BBB opening. The group mean of the focal ROI of the three maps possess higher values in 0.8-MPa than in 0.5-MPa group, illustrating that sonication with higher FUS acoustic pressure was able to cause more significant MR signal changes and BBB opening (5).The Ktrans value computed in this study was derived from the signal difference of dynamic T1WI instead of using the Gd concentration (6). In addition, signals in superior sagittal sinus of the rat brain, instead of arterial input function, was used to calculate Ktrans. Therefore, there may be bias in the calculation of Ktrans values.
In conclusion, this study validates the positive correlations of non-contrast MR signal changes and Gd-enhancement and Ktrans, illustrating the feasibility of localizing FUS-induced BBB opening without Gd injection during FUS sonication in an in vivo rat model.
Acknowledgements
No acknowledgement found.References
1. Liu, Hao-Li, et al. "Combining microbubbles and ultrasound for drug delivery to brain tumors: current progress and overview." Theranostics 4.4 (2014): 432.
2. Chai, Wen-Yen, et al. "Image-guided focused-ultrasound CNS molecular delivery: an implementation via dynamic contrast-enhanced magnetic-resonance imaging." Scientific reports 8.1 (2018): 1-11.
3. Tofts, Paul S. "Modeling tracer kinetics in dynamic Gd‐DTPA MR imaging." Journal of magnetic resonance imaging 7.1 (1997): 91-101.
4. Peng, Hsu‐Hsia, et al. "Real‐time monitoring of inertial cavitation effects of microbubbles by using MRI: In vitro experiments." Magnetic resonance in medicine 77.1 (2017): 102-111.
5. Chen, Hong, and Elisa E. Konofagou. "The size of blood–brain barrier opening induced by focused ultrasound is dictated by the acoustic pressure." Journal of Cerebral Blood Flow & Metabolism 34.7 (2014): 1197-1204.
6. Wang, Ping, et al. "Effects of flip angle uncertainty and noise on the accuracy of DCE-MRI metrics: comparison between standard concentration-based and signal difference methods." Magnetic resonance imaging 33.1 (2015): 166-173.
Figures