1102
tMB Whole Heart Perfusion Imaging with Iterative Reconstruction at 3.0T1Paul C. Lauterbur Research Centre for Biomedical Imaging, Shenzhen Institutes of Advanced Technology, Chinese Academy of Science, Shenzhen, China, 2Shenzhen College of Advanced Technology, University of Chinese Academy of Sciences, Shenzhen, China, 3UIH America Inc., Houston, TX, United States
Synopsis
Auto-calibrated multiband CAIPIRINHA with through-time encoding (tMB) has been proposed to acquire multiple slices simultaneously without extra reference scans. Reference images are estimated from the consecutive cardiac phases at a lower temporal resolution for subsequent slice separation. We implemented the tMB method in a myocardial perfusion sequence and demonstrated the feasibility of whole heart perfusion imaging with tMB and iterative reconstruction using in a clinical setting.
Introduction
First-pass myocardial perfusion MRI shows great potential for ischemia testing in patients with intermediate risk of coronary artery disease [1]. To date, simultaneous multi-slice imaging [2] has been proposed to increase ventricular coverage without sacrificing in-plane spatial resolution. However, single-band (SB) data of each slice are essential for subsequent reconstruction and are generally obtained from an additional scan. Recent development in simultaneous multi-slice with through-time encoding (tMB) [3] allows reconstruction of multiple slices without the need for extra reference data acquisition. Instead, the non-aliased reference data is estimated from the consecutive cardiac phases at a lower temporal resolution. The tMB technique has been implemented in a standard spoiled GRE sequence which combines with a pseudo random in-plane sampling pattern using the Latin Hypercube method [4] to achieve whole heart perfusion imaging in one single breath hold. The feasibility of the application has been explored under a retrospective experiment with full sample data without administration [5]. In this study, we used a different in-plane undersampling pattern and validated this application through a healthy volunteer with contrast administration.Methods
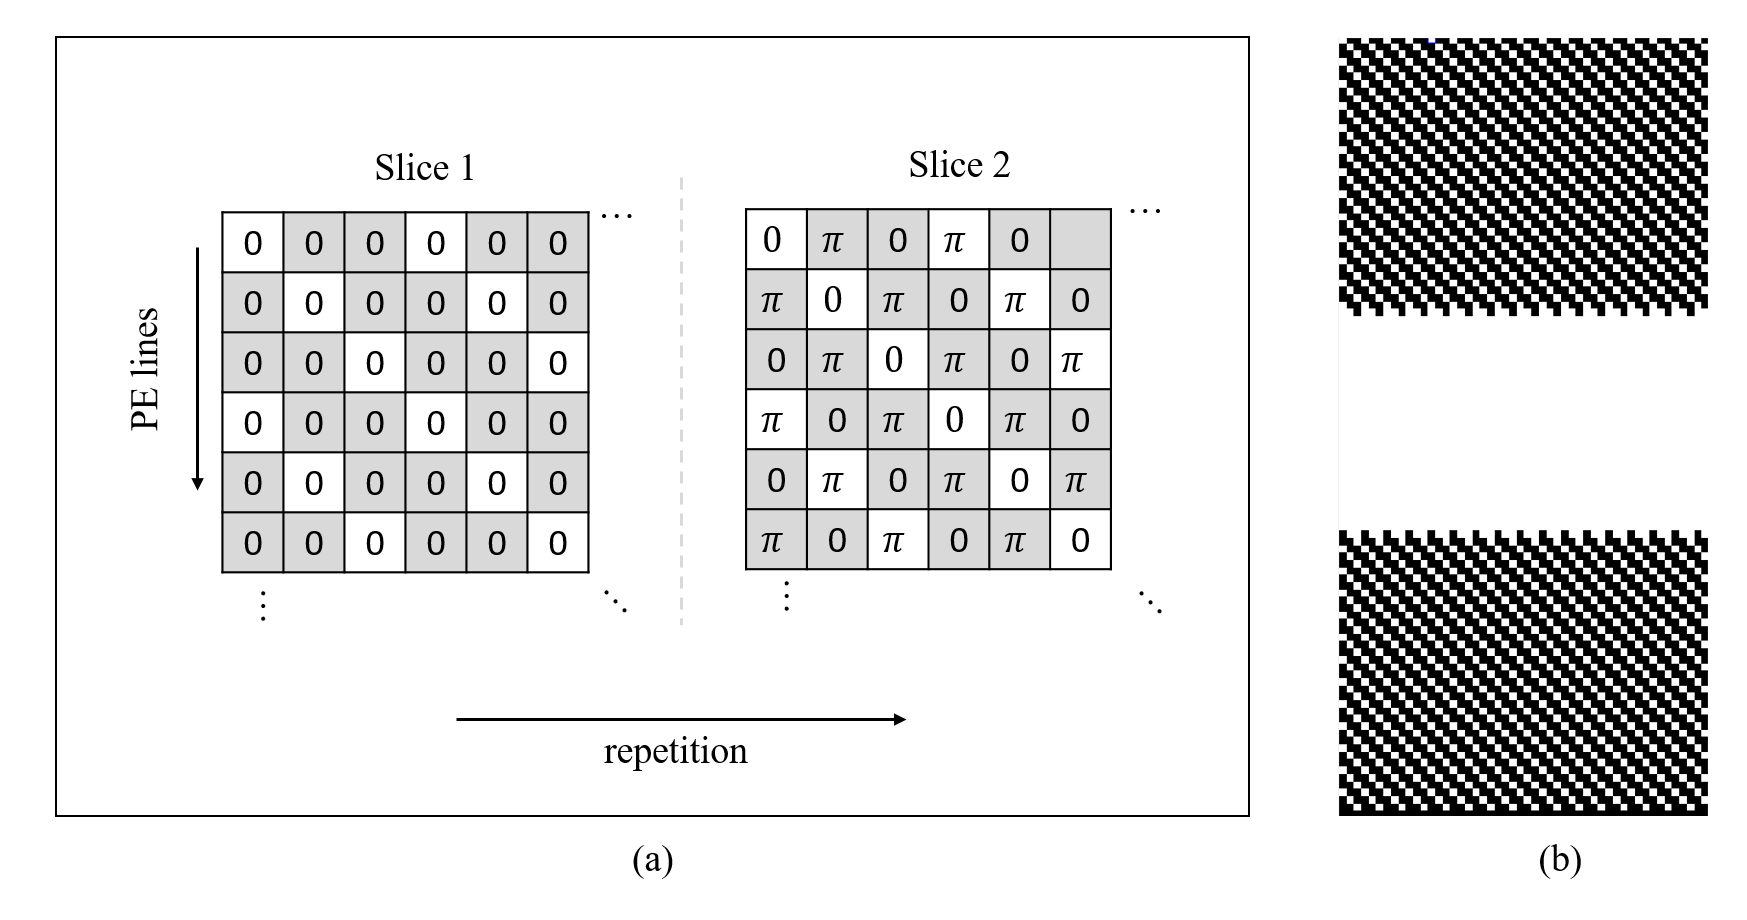
Sequence developmentThe sequence [5] combined tMB technique with a standard spoiled GRE sequence, with a non-selective saturation recovery (SR) pulse before each shot. The RF phases of the multiband (MB) pulses of each excited slice are cycled along phase encoding (PE) lines and repetition (or cardiac cycle). MB=2 was achieved and demonstrated in this study as shown in Figure 1a. The k space center was fully sampled, while the outer was 3-fold undersampled according to the k-t acceleration mask as shown in Figure 1b, in which white dots represent lines to acquire. Patterns along repetition are different and complementary for adjacent. The effective in-plane undersampling factor was 2 (55 lines per repetition), and 4-fold total acceleration was achieved.
Image acquisition
tMB perfusion imaging was performed on a healthy volunteer with 0.1 mmol/kg of Gd-DTPA (Magnevist, Bayer Healthcare, Leverkusen, Germany) using a 3.0T scanner (uMR790, United Imaging Healthcare, Shanghai, China). A 12-channel abdomen coil in conjunction with a Body coil (12 channels selected) were used for data reception. The study was approved by our Institutional Reviews Board (IRB). Contrast administered in the study. Imaging parameters were: FA=10°, TR/TE=2.95/1.41ms, saturation recovery time=100ms, FOV=380×320×8mm3, in-plane matrix size=192×106, spatial resolution=1.98×1.98×8mm3 and bandwidth=1000Hz/pixel. A total of 6 slices was covered with MB=2. The total scan time was about 40s.
Reconstruction
SB reference data calculation [5]:
Consecutive repetitions can be grouped to generate slice-separated reference datasets at low temporal resolution. Specifically, the aliased k-space data was firstly averaged according to the odd and even cardiac cycles. After that, the SB reference data was calculated by summation and subtraction of the averaged odd and even datasets. Then the separated SB images were reconstructed by Fourier transform and used to estimate coil sensitivity maps for subsequent non-linear iterative reconstruction.
Image reconstruction:
Images were reconstructed using non-linear iterative reconstruction, by minimizing the cost function below with L1 regularization of spatial and temporal TV transform:
$$ \arg{}\min_{x_{1},x_{2}}\frac{1}{2}\parallel y-p_{1}DF(s_{1}x_{1}+p_{2}DF(s_{2}x_{2})\parallel^2_{2}+\lambda_{1}\parallel Tx_{1}\parallel_{1}+\lambda_{2}\parallel Tx_{2}\parallel_{1}$$
where y is the measured data, x1 and x2 are the two perfusion slice groups in time, s1 and s2 are coil sensitivity maps of the SB reference image, p1 and p2 are phase modulations, D represents the k-space sampling operator, F represents the Fourier transform operator, and T represents the temporal TV operator which is the sparsifying transform for L1 regularization, is an adjustable parameter of the regularization strength.
Results
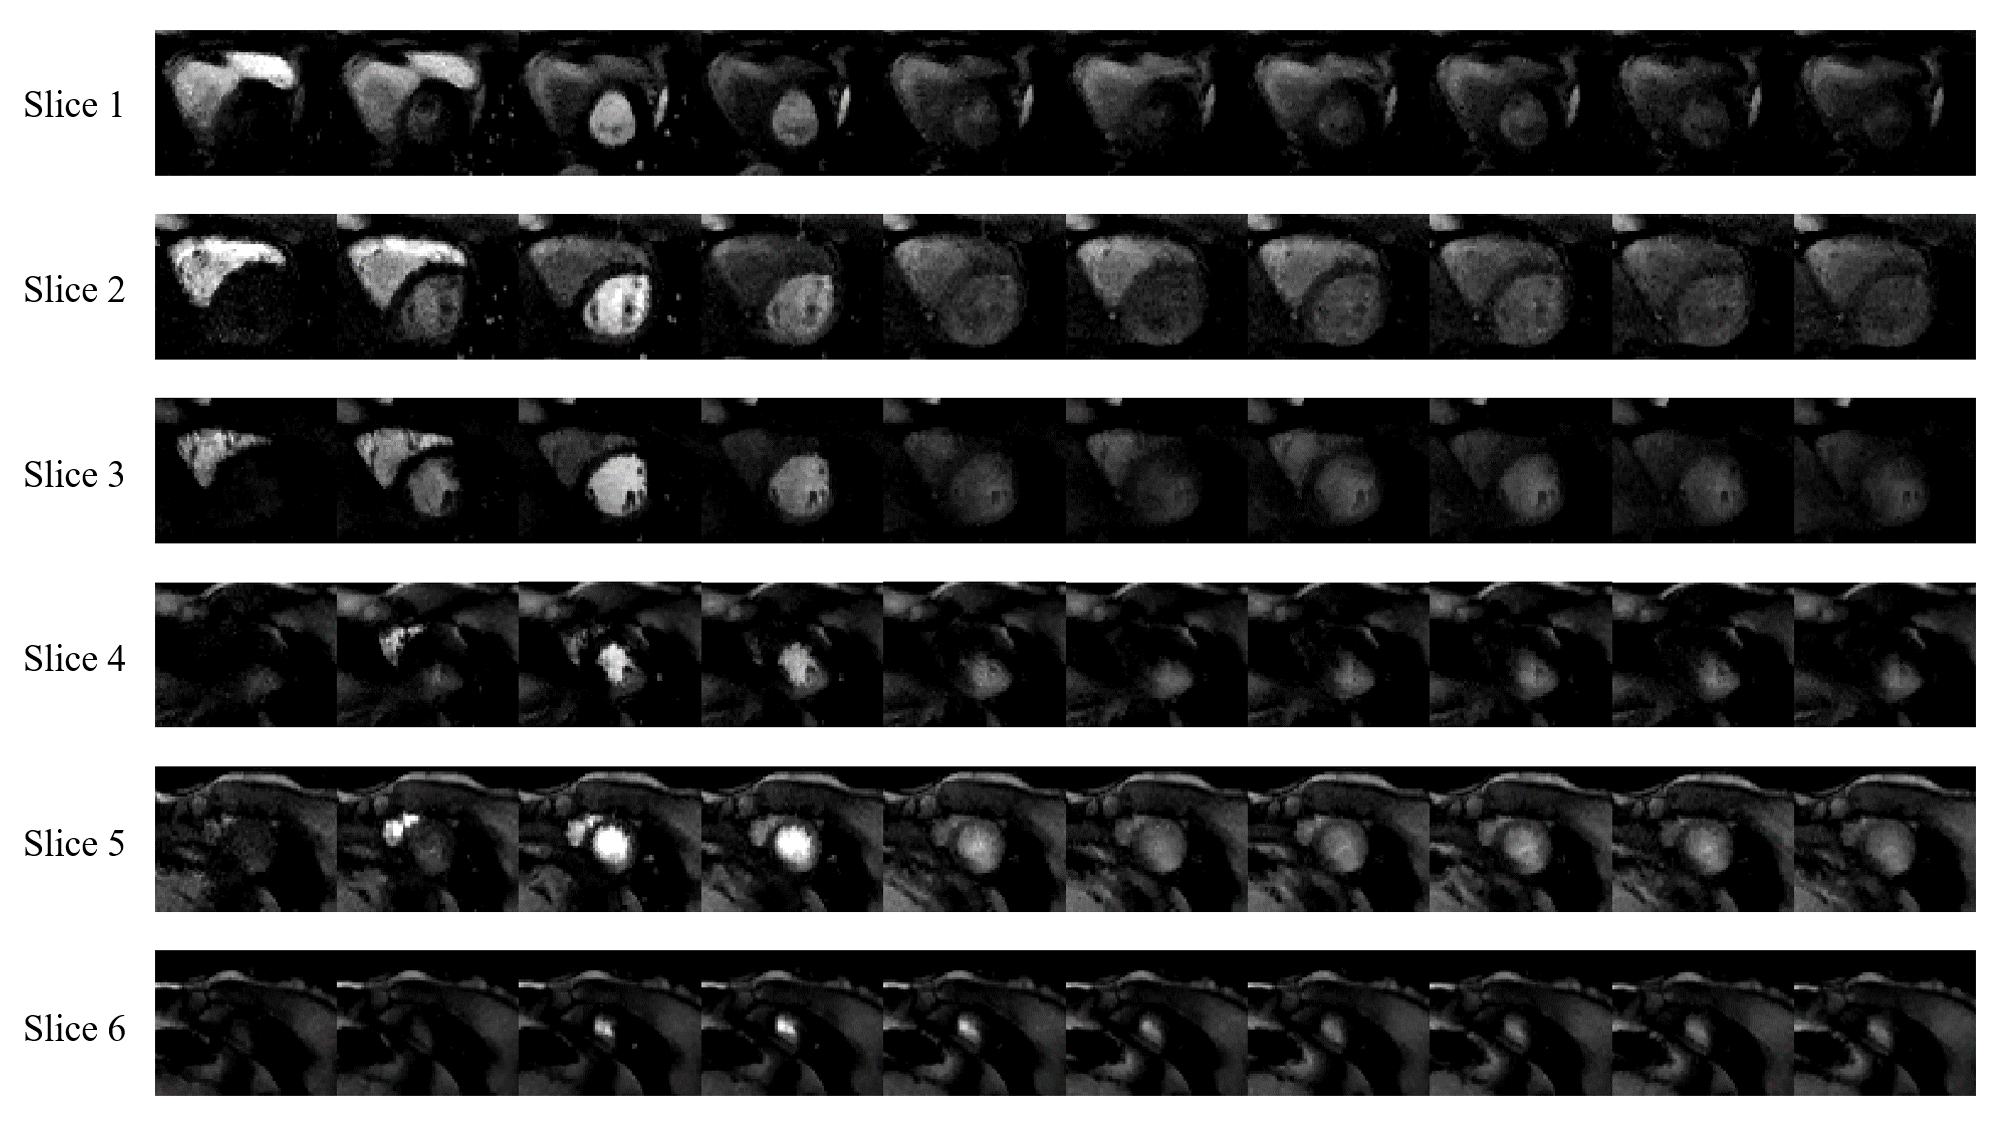
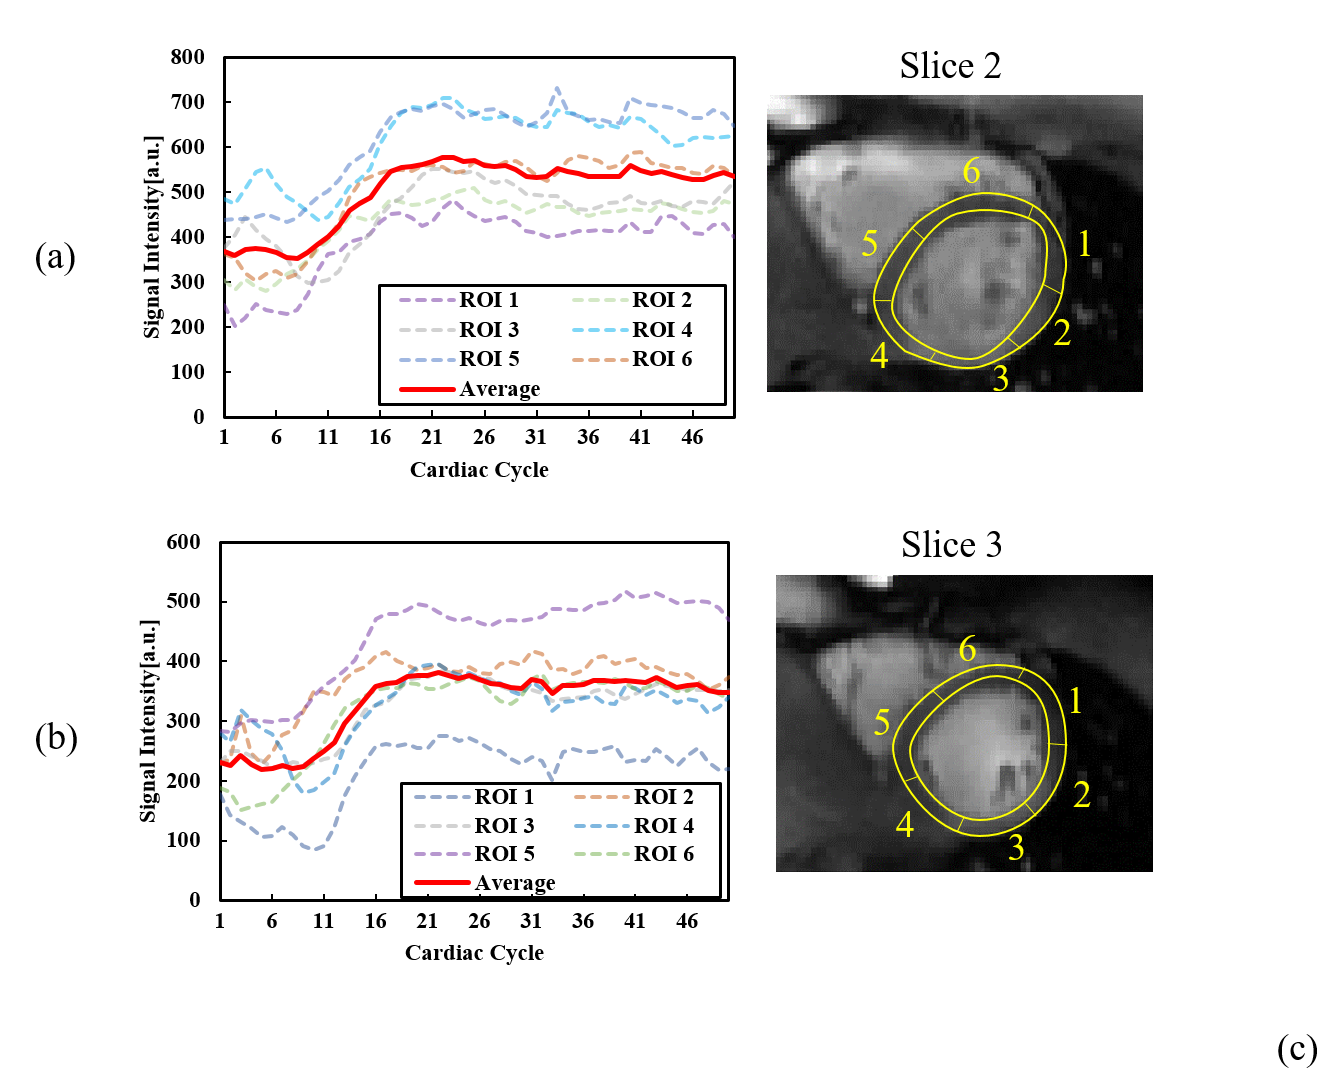
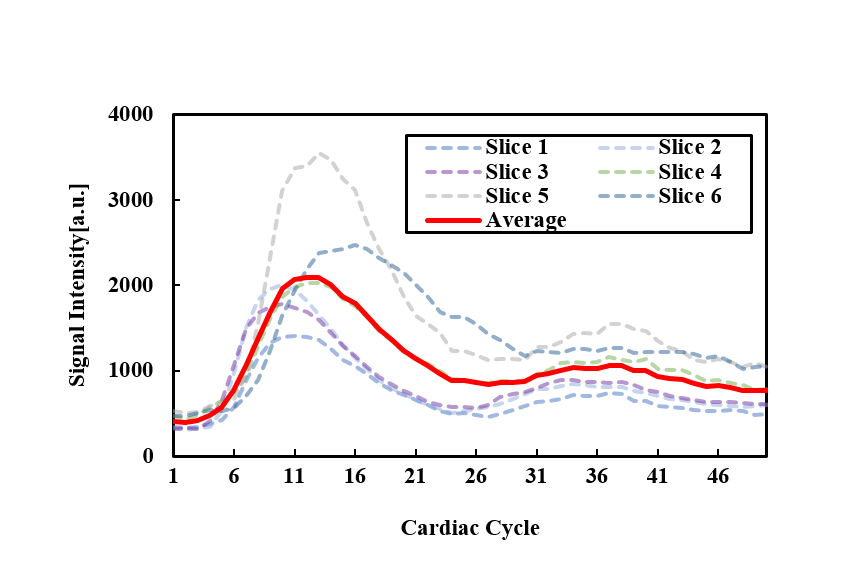
Figure 2 shows the dynamic perfusion series of 6 slices from a healthy volunteer. Contrast transit through right ventricle, left ventricular blood pool, peak myocardial and washout is shown in the figure, which is represented by images at cardiac cycle 1, 6, 11, 16, 21, 26, 31, 36, 41, 46. Peak signal intensities of different slices occur at different cardiac cycles. Figure 3 shows signal intensity curves of regions of interest (ROIs) on the myocardial wall at 2 slices. Myocardium of different ROIs through time (denoted by dot) shows similar dynamics of contrast uptake, as validated by their time intensity curves. Signal intensity curves for the blood pool are shown in Figure 4.Discussion and Conclusion
We have implemented the tMB technique in cardiac perfusion imaging and evaluated the application on a volunteer with contrast agent administration. Although the signal intensity changes abruptly between certain frames with contrast administration, low temporal resolution single-band reference images can still be extracted and used for downstream unalising, which in this case is achieved by an iterative reconstruction procedure with sparsity constraints. The k-space is also in-plane undersampled and a total acceleration of 4 was achieved to ensure the stability of the sequence and more suitable for the clinical use. Currently, whole heart coverage can also be achieved using 3D acquisition techniques, however, with in-plane spatial resolution reduced. With higher in-plane acceleration, the proposed tMB technique could achieve more slice coverage.This technique may represent a route to achieve high resolution 3D whole heart coverage for improved diagnostic accuracy and identification of subendocardial ischaemia.Acknowledgements
Thanks Yunshan Winlead Hospital for the help of data acquisition. Some of the work was partially supported by the National Natural Science Foundation of China (No. 81801691), the State Key Program of National Natural Science Foundation of China (Grant No. 81830056), the Key Laboratory for Magnetic Resonance and Multimodality Imaging of Guangdong Province, and the Shenzhen Key Laboratory of Ultrasound Imaging and Therapy (ZDSYS20180206180631473).References
1. Coelhofilho O R et al., Radiology, 2013, 266(3): 701-715.
2. Barth M et al., Magnetic Resonance in Medicine, 2016, 75(1): 63-81.
3. Ferrazzi G et al., Magnetic Resonance in Medicine, 2019, 81(2): 1016-1030.
4. Lyu JY et al, Proc. Intl. Soc. Mag. Reson. Med. 27, 4752.
5. Zou L et al, Proc. Intl. Soc. Mag. Reson. Med. 28, 2883.
Figures