1100
A new image clustering method for assessing tumor heterogeneity induced by a drug treatment in DCE-MRI
Kazuyuki Makihara1, Kazuya Sakaguchi1, Masayuki Yamaguchi2, Ken Ito3, Yusaku Hori3, Taro Semba3, Yasuhiro Funabashi3, Hirofumi Fujii2, and Yasuhiko Terada1
1Faculty of Pure and Applied Sciences, University of Tsukuba, Tsukuba, Ibaraki, Japan, 2National Cancer Center, EPOC, Division of Functional Imaging, Kashiwa, Chiba, Japan, 3Eisai Co.,Ltd. Oncology Business Group, Bunkyo City, Tokyo, Japan
1Faculty of Pure and Applied Sciences, University of Tsukuba, Tsukuba, Ibaraki, Japan, 2National Cancer Center, EPOC, Division of Functional Imaging, Kashiwa, Chiba, Japan, 3Eisai Co.,Ltd. Oncology Business Group, Bunkyo City, Tokyo, Japan
Synopsis
Dynamic contrast-enhanced (DCE) -MRI has been widely used to assess tumor responses to anticancer drugs. Ktrans, one of the pharmacokinetic parameters of DCE-MRI, reflects blood perfusion and permeability in tumor tissue and is a good indicator of perfusion assessment. However, conventional analyses of DCE-MRI do not reflect drug response well, since tumor is extremely heterogeneous. In this study, we have developed a new method for quantitatively assessing the heterogeneous response of tumors during anticancer treatment, and applied it to examine the drug response of E7130, a novel anti-cancer agent with spatiotemporal variation in human breast cancer xenograft model.
INTRODUCTION
Dynamic contrast-enhanced (DCE-) MRI is a technique that tracks the pharmacokinetics of contrast agents (CAs) administered intravenously to examine the structure and function of tumor vasculature, and is widely used to assess cancer drug effects. The forward transfer constant Ktrans, a typical pharmacokinetic parameter, reflects the blood perfusion and permeability within tumor tissues and is a good indicator of drug efficacy.Knowing how the microvascular structure changes inside a tumor is very important to understand how a drug works. Traditional DCE-MRI mainly uses simple statistical analysis of pharmacokinetic estimates for an entire tumor or within predefined region-of-interests within the tumor [1], which does not well reflect the heterogeneous nature of drug effects to the tumor.
In this study, we proposed a new method for quantitative assessment of drug effects on tumors by DCE-MRI, including evaluation of heterogeneous nature of tumor response to drug treatment. K-means clustering was used to classify the Ktrans and fractional extracellular and extravascular space volume, ve. The spatial heterogeneity of tumor response was assessed by analyzing the distance from the tumor rim for each clustered voxel.
METHOD
Animal model and treatment:E7130, an inhibitor of microtubule polymerization, was used to develop a method for assessing drug activity against tumor microenvironments; in addition to its cytotoxic effects, E7130 has been reported to improve the microenvironment in tumor tissue through vascular remodeling [2]. Human mammary carcinoma cell line (MCF-7) was subcutaneously transplanted into mice and divided into 14 treatment (E7130-treated, 180μg/kg dosage) and 8 non-treatment (control) groups.
Gadobutrol was also injected into another cohort of 7 mice, and plasma gadolinium (Gd) was measured by inductively coupled plasma mass spectrometry (ICP-MS) to determine arterial input function (AIF). The experimental protocol was approved by the institutional animal care and use committee.
DCE-MRI measurement:
DCE-MRI was performed on a Bruker 9.4T MRI before and 2 and 5 days after treatment with E7130. The DCE-MRI sequence was two-dimensional spoiled gradient-echo technique (field of view = 30 mm × 20 mm, slice thickness = 1 mm, matrix size = 128 × 192, 3 slice, TR/TE = 32.9/2.0 ms, flip angle 45°, 5 sec intervals). Fifty seconds after the imaging started, contrast agent (Gadobutrol; 0.2 mmole Gd/kg (infusion volume of 10 µl/g BW)) was injected rapidly from the tail vein. The total scan time was 600 seconds (120 time points). T1 maps and anatomical fast spin-echo T2-weighted images of the tumor were also acquired before DCE-MRI.
Analysis: CA concentration maps were calculated in a pixel-by-pixel basis from DCE-MRI data and T1 map. At each voxel, the values of Ktrans and ve were calculated by least-squares fitting to the CA concentration curve over time using a Tofts and Kermode (TK) model [3], where the AIF values were incorporated. Automatic classification using the k-means method was performed for Ktrans and ve with the number of clusters at 4, which was determined in advance using the Elbow method.
The volume fraction was calculated for each cluster. For each voxel, the distance from the nearest tumor rim was calculated and normalized with respect to the square of the area of the tumor ROI.
RESULTS
In treated group, the mean tumor volume decreased with time dependently compared to control group. (Fig. 1).Figure 2 and Table 1 showed the results of k-means clustering of all tumor data. Clusters 1 and 2 account for about 80% of the total volume of all tumors. Among the four clusters, cluster 1 had the highest volume fraction (51.6%) and smaller Ktrans and smaller ve values. The representative CA curve for cluster 1 showed a gradual increase in CA uptake and a low peak value. Cluster 2 showed the second highest volume fraction (31.5%), with larger Ktrans values and medium ve values.
As shown in Fig. 3, in treated group, the volume fraction of cluster 1 decreased and that of cluster 2 increased. In control group, the volume fraction of each cluster did not change over time.
In treated group, the mean distance from the rim for cluster 1 decreased during treatment (Fig. 3(e)), while that for cluster 2 increased (Fig. 3(f)). These trends were not observed in control group. These features were also observed in the representative maps of Ktrans, ve, and clusters (Fig. 4).
DISCUSSION
The tumor voxels of cluster 1 showed smaller Ktrans (i.e., slow CA uptake), indicating the poor blood perfusion and permeability. They appear frequently in control group and before treatment in treated group. In treated group, the volume fraction of cluster 2 with elevated Ktrans increased over time, indicating the increase in high-Ktrans area that is suggestive of an enhanced microvasculature permeability region after treatment. This effect has already been reported, a process known as vascular remodeling [2].The distance-from-the-rim analysis clearly showed the spread of highly vascularized region (cluster 2) from the tumor rim to the tumor core during treatment. Importantly, the high vascularized region (cluster 2) almost occupied the whole tumor on day 5. This is qualitatively consistent with the results of microscopic observations.
CONCLUSION
The proposed method was shown quantitatively assess the heterogeneous tumor effects of an anticancer drug.Acknowledgements
No acknowledgement found.References
[1] D.L. Longo et al., Cluster analysis of quantitative parametric maps from DCE-MRI: application in evaluating heterogeneity of tumor response to antiangiogenic treatment, Magn Reson Imaging, 2015;33:725–736.[2] Kawano S et al. A landmark in drug discovery based on complex natural product synthesis. Scientific Rep. 2019: ;9(1):8656.
[3] P. S. Tofts and A. G. Kermode, Measurement of the blood-brain barrier permeability and leakage space using dynamic MR imaging. 1. Fundamental concepts, Magn Reson Med, 1991;17:357–67.
Figures
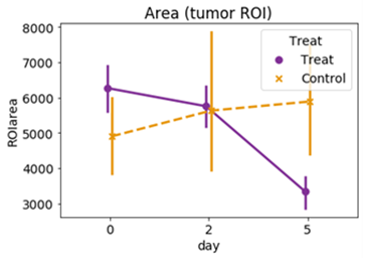
Fig. 1. Changes in the average volume of the
tumor.
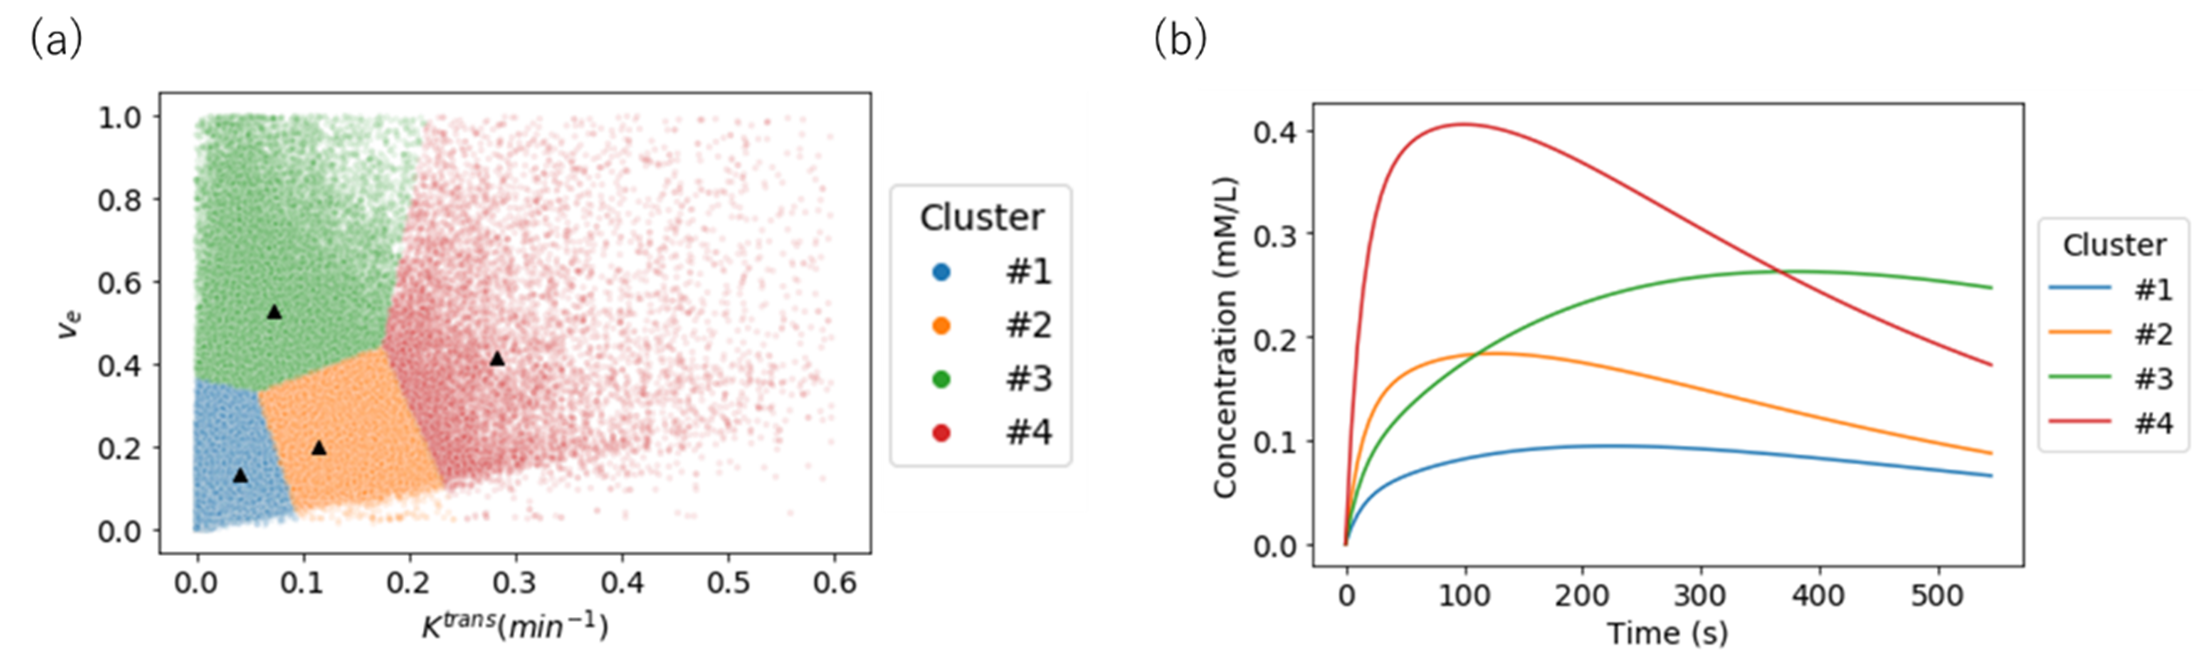
Fig. 2. K-means clustering results. (a) Scatter
plot of Ktrans and ve. (b) Model concentration curves calculated with the
center of gravity values of each cluster.
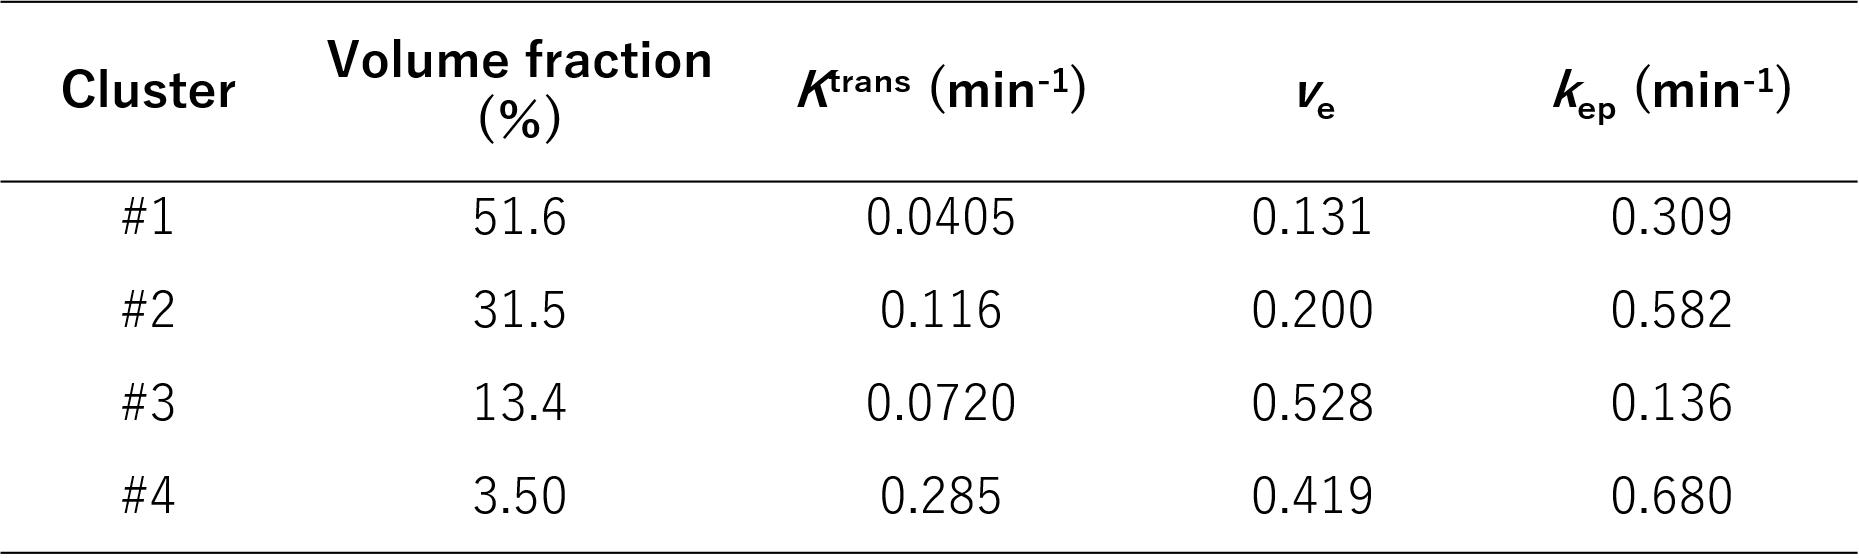
Table 1. Average values of the volume fraction and pharmacokinetic parameters for each cluster. kep is defined as Ktrans/ve.
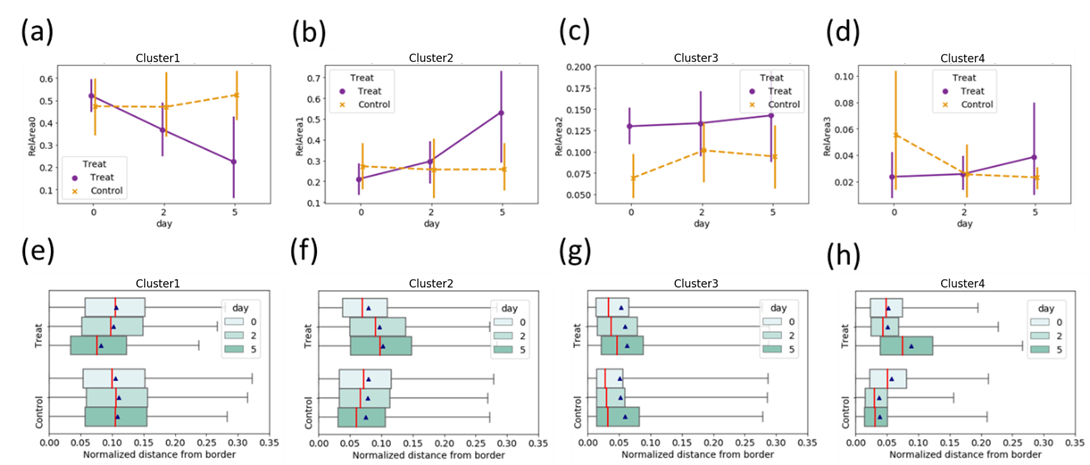
Fig. 3. Changes in average volume fraction
(a-d) and relative distance from the tumor rim (e-f).
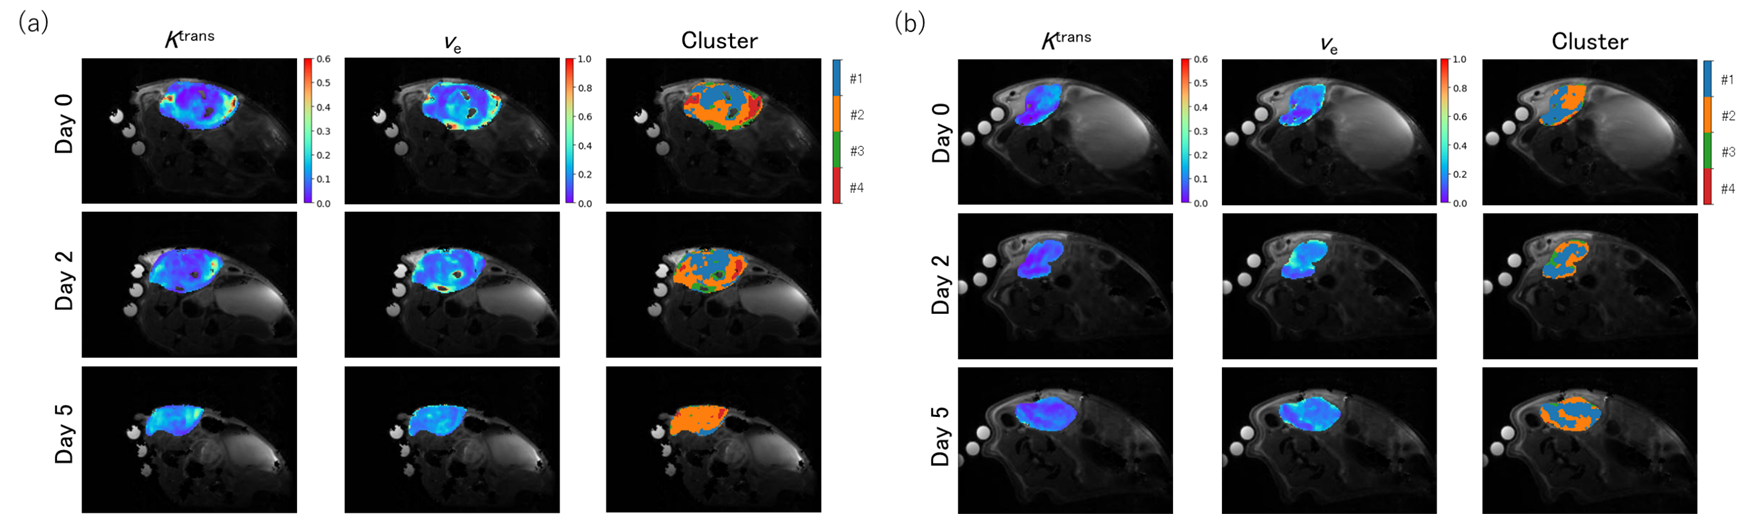
Fig. 4. Representative Ktrans, Ve,
and cluster maps overimposed on the T2W anatomical images of treatment and
non-treatment groups (a-b).