1099
Tumor intracellular water residence time measured by DCE-MRI negatively correlates with the standard update value of 18F-FDG-PET1Radiology, Weil Cornell Medical College, New York, NY, United States, 2Center for Biomedical Imaging (CBI), Center for Advanced Imaging Innovation and Research (CAI2R), New York University School of Medicine, New York, NY, United States
Synopsis
Intracellular water residence time (τi) is an important property of solid tumors, with implications in cellular energy turnover. Measurement of τi using the active contrast encoding MRI method offers insight into tumor microenvironment heterogeneity and potentially metabolic activity. Our study compares τi, measured using ACE-MRI, in mouse gliomas with the standardized uptake value (SUV) from 18F-FDG PET in order to investigate the feasibility of using τi as an imaging marker for cellular metabolic activity.
Introduction
Cellular-interstitial water exchange, often characterized by the kinetic parameter intracellular water residence time (τi), has been shown to be a promising biomarker for cellular energy turnover.1 Recently the Active Contrast Encoding (ACE) MRI method was introduced to measure τi by using more than one flip angle during dynamic scan with contrast injection.3 In this study, we generated whole tumor τi parameter maps and compared them with 18F-FDG PET standardized uptake values to investigate the feasibility of using τi as an imaging marker for cellular metabolic activity.Methods
Six to eight-week-old C57BL6 mice (n=7) with GL261 mouse glioma xenograft models were used in this study. MRI scans were performed on a Bruker 7T micro-MRI system, with a 1H four-channel phased array receive-only MRI CryoProbe with a volume transmit coil. The 3D-UTE-GRASP method2 was used to acquired dynamic contrast-enhance data (TR/TE = 4 / 0.028 ms) with image matrix = 128 x 128 x 128, and field of view = 20 x 20 x 20 mm3. In order to achieve active contrast encoding for τi measurement, this sequence was continuously run to acquire 154,080 spokes with two flip angles (51,360 spokes for each flip angle segment 8o - 25o - 8o) for 10 minutes and 13 seconds. Pre-contrast T1 mapping was obtained using the 3D-UTE-GRASP sequence with 38,328 spokes (12,776 spokes for each flip angle segment 8o - 2o - 12o), for a total acquisition time of 153 s at the same resolution as the DCE scan. The joint compressed sensing and parallel imaging reconstruction was implemented based on the 3D-UTE-GRASP algorithm2 with temporal frame resolution T = 5 s/frame. Arterial input function (AIF) was obtained following the Principal Component Analysis (PCA) method used in our previous study3 with the independently measured T1 map. The T1 weighted images were also used to manually segment whole tumors. Pharmacokinetic model analysis was carried out for the whole tumor with the same Two Compartment Exchange Model (TCM)4 and Three Site Two Exchange (3S2X)5 Model for τi estimation with the two-flip angle approach3. Five parameters, interstitial space volume fraction (ve), vascular space volume fraction (vp), blood flow (Fp), permeability surface area product (PS), and intracellular water life time (τi) were estimated from the model fit. Transfer constant (Ktrans) was calculated from PS and Fp.Dynamic 18F-FDG PET/CT scans were performed on an Inveon small-animal PET/CT scanner (Siemens Medical Solutions), immediately following the DCE-MRI scan. The mice were administered an 18F-FDG bolus (6.45-11.1 MBq/0.1 mL) via tail vein injection 1 minute into the 60 minute scan. Whole tumors were manually segmented from co-registered PET/CT images. Dynamic tracer uptake was measured following decay correction and CT-based attenuation correction. The SUV of the whole tumor ROI was calculated as: [decay corrected activity (Bq/mL)] / [animal weight (g)]/[injected dose (Bq)].
All animals were treated in strict accordance with the National Institutes of Health Guide for the Care and Use of Laboratory Animals.
Results
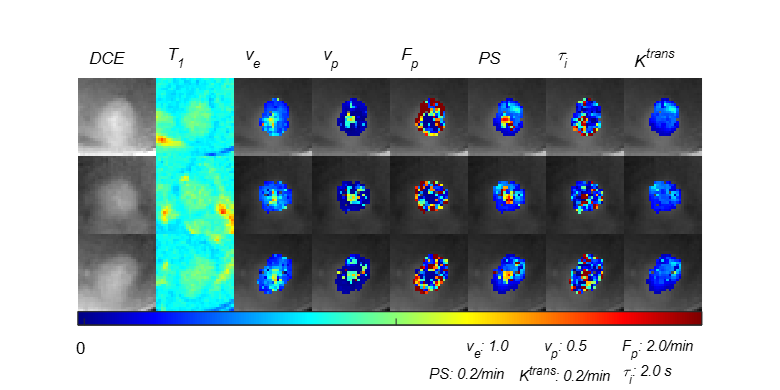
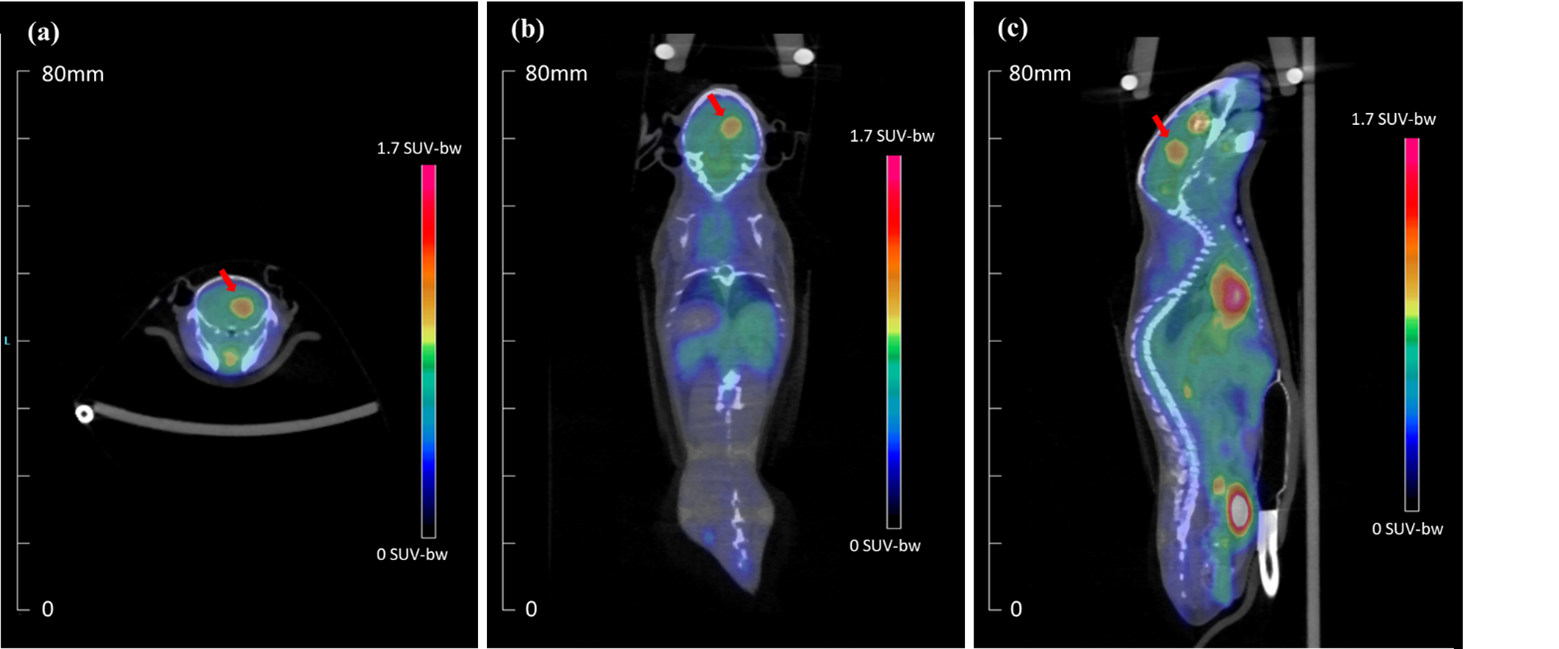
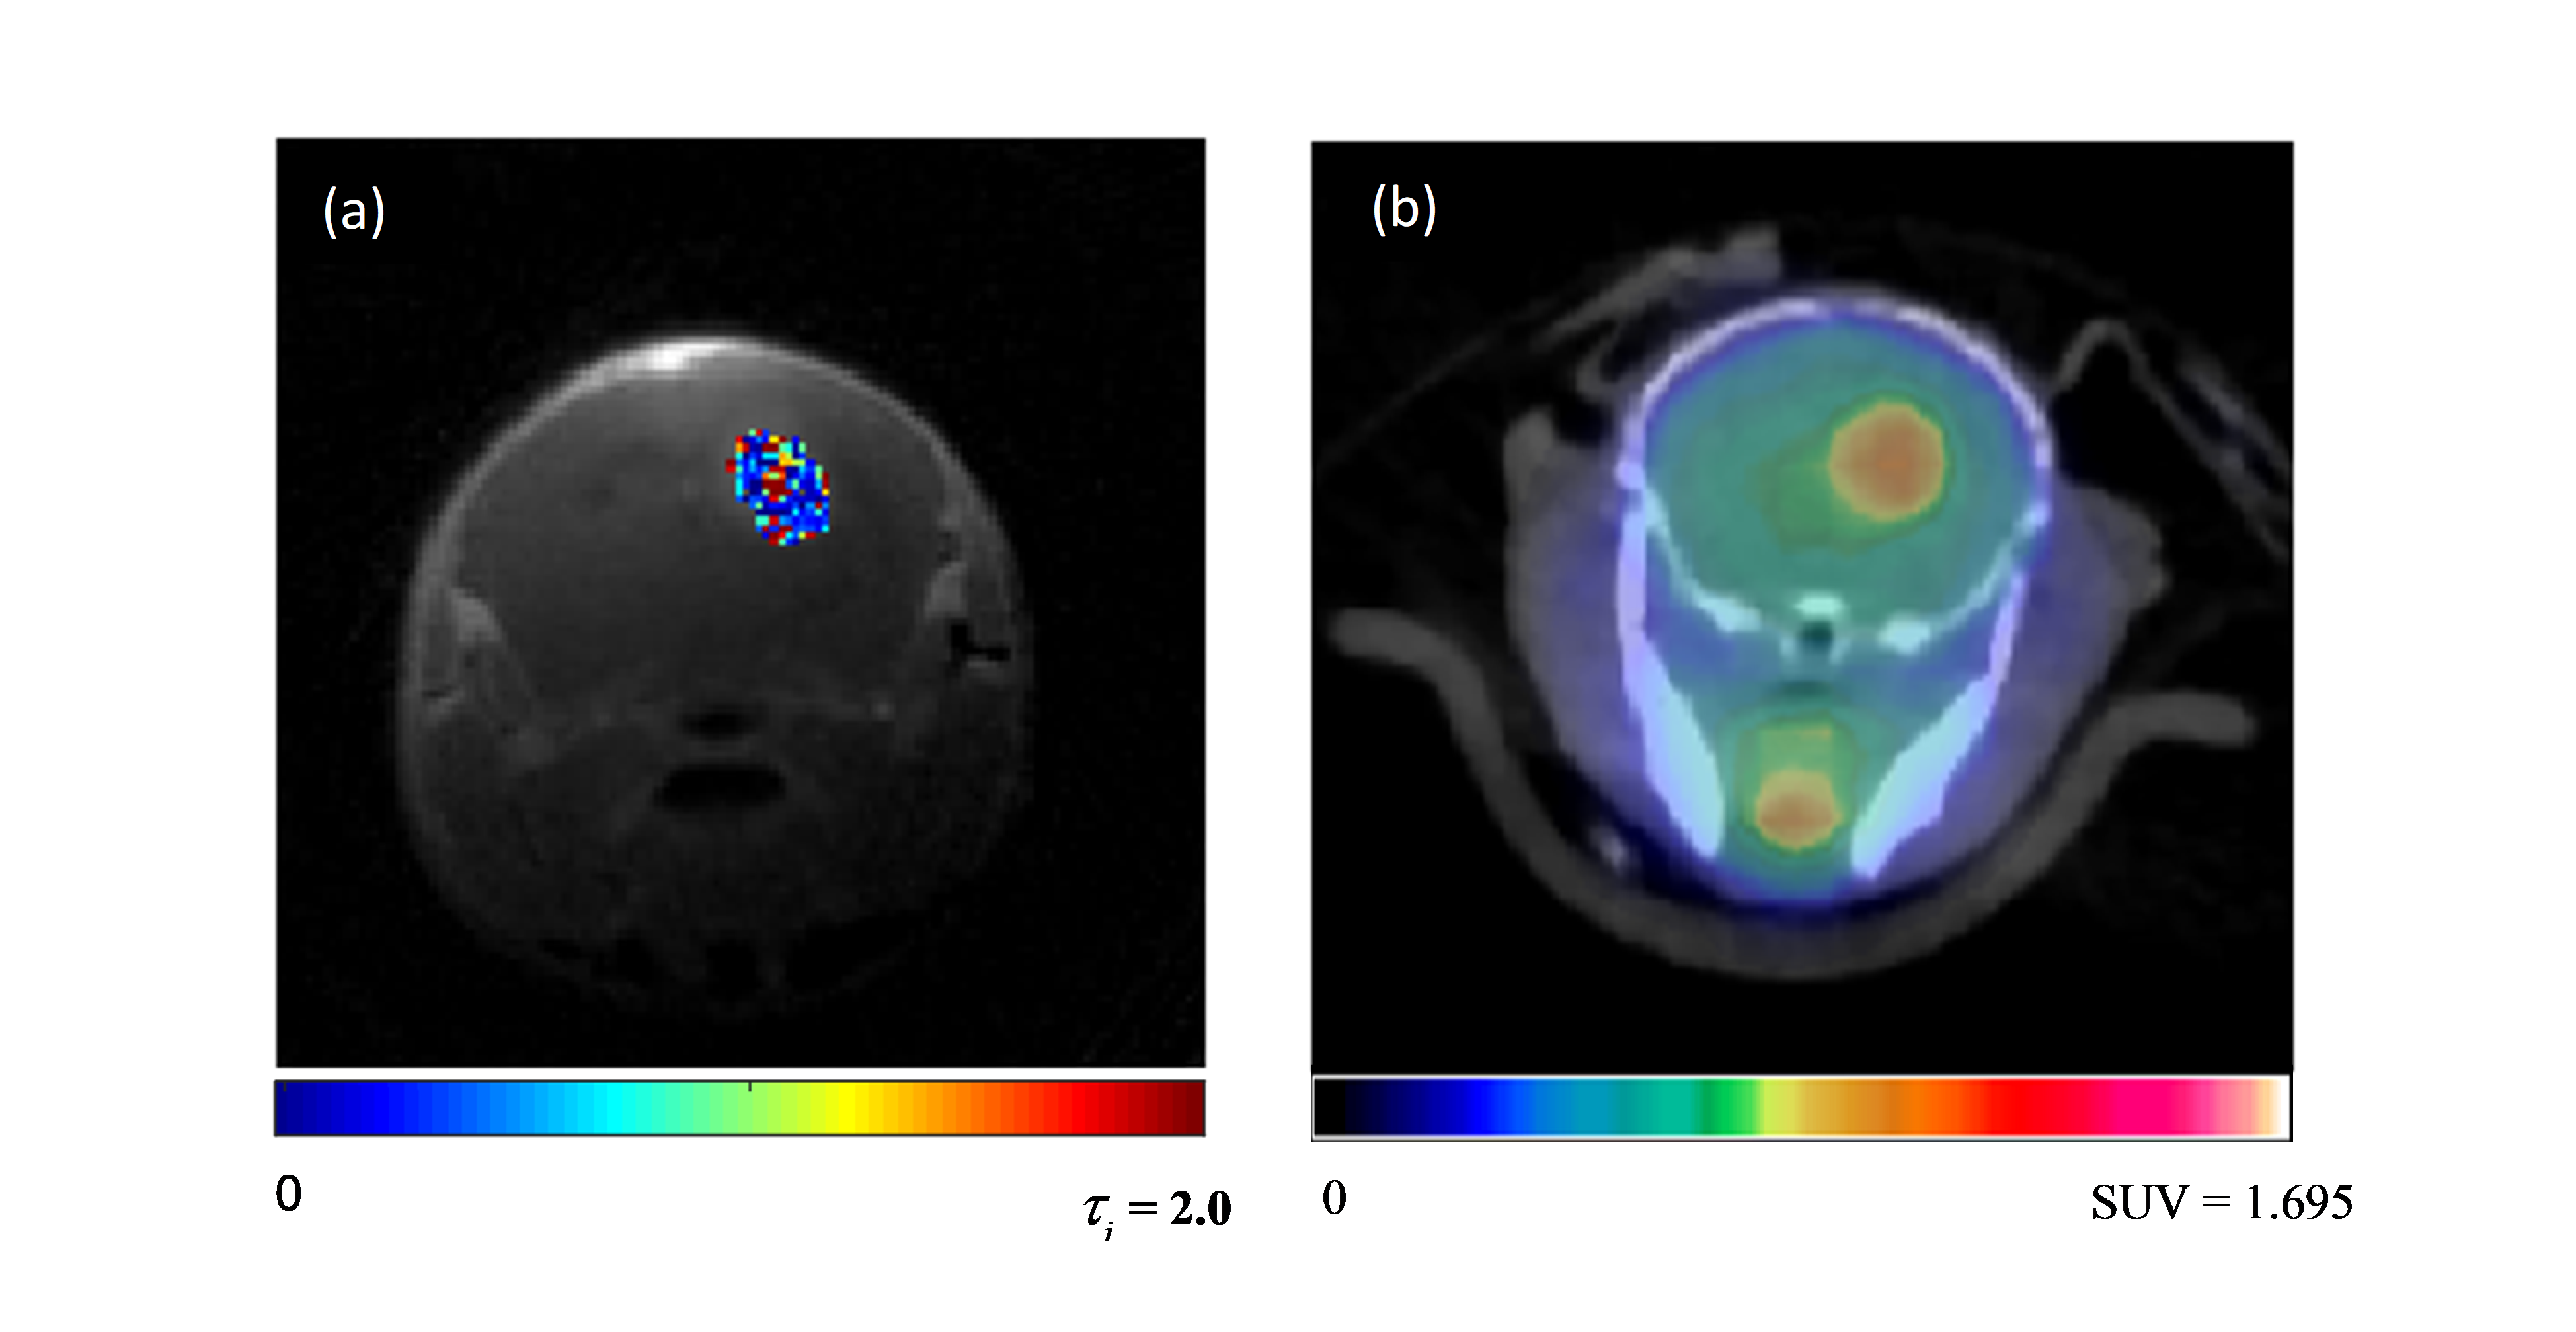
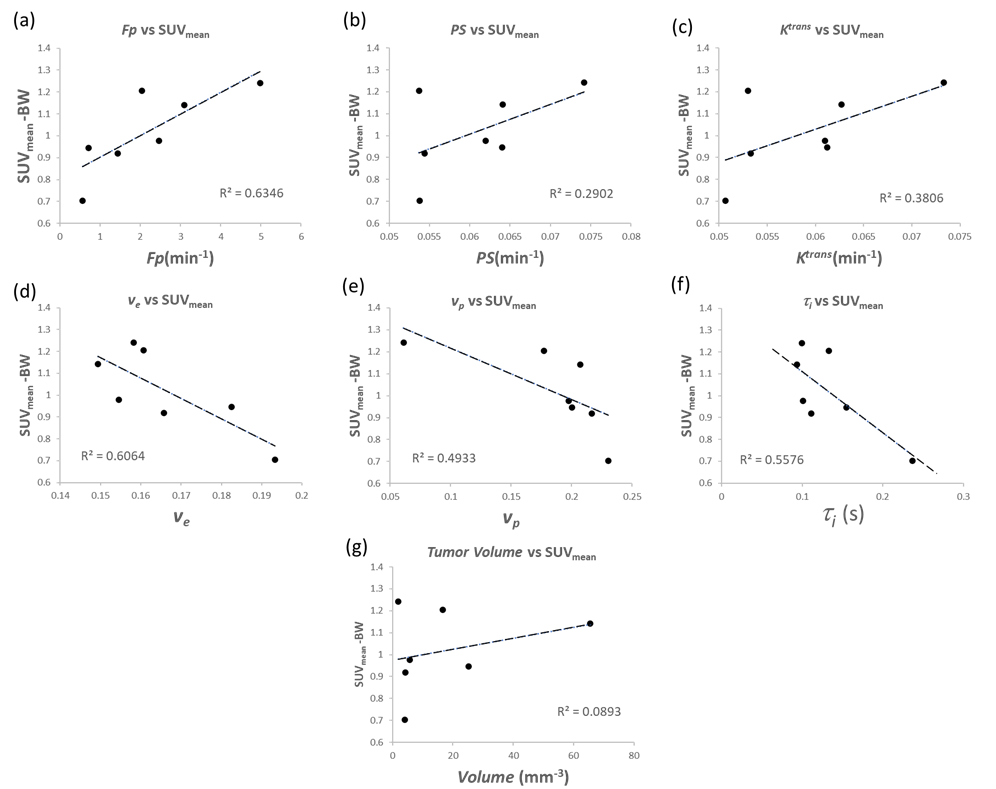
Figure 1 depicts the tumor heterogeneity captured by the whole tumor kinetic parameter maps modeled from the DCE images. Figure 2 illustrates the 18F-FDG activity in the whole mouse based on the summed frames of the dynamic 18F-FDG PET/CT scan data, with a red arrow indicating location of the tumor. Figure 3 (a) depicts an example 3D-UTE-GRASP MRI image overlaid with the τi parameter map of the tumor ROI. Figure 1 (b) depicts the 18F-FDG activity in the same subject and region from the follow up 18F-FDG PET/CT scan. Figure 4 shows the comparison of whole tumor mean standardized uptake value (SUVmean) with each kinetic parameter map median values in highly enhancing pixels of whole tumor ROI with positive correlations for: (a) Fp, R2 =0.6346, (b) PS, R2 =0.6346, (c) Ktrans, R2 = 0.6346, (d), negative correlations for: ve, R2 =0.6346, (e) vp, R2 =0.6346, (f) τi, R2 =0.6263 and (g) demonstrates little correlation between whole tumor volume with SUVmean, R2 = 0.00893.Discussion
As the τi parameter represents the intracellular water residence time, higher τi values would indicate slower interstitial-cellular water exchange. Water exchange has been implicated as a biomarker of cellular metabolic activity.1 The standardized uptake value from 18F-FDG PET is widely used as a semi-quantitative method of measuring glucose uptake and phosphorylation in tissue, an indicator of cellular metabolic activity. The negative correlation between τi and SUV reinforces τi as a sensitive parameter for cellular metabolic activity, suggesting that the water exchange is facilitated by trans-membrane active water transport. The weak correlation between tumor volume and SUV further supports the relationship between τi, SUV and tumor metabolism as FDG uptake is more likely driven by energy turnover than the bias of larger tumors acting as an FDG sink.Conclusion
In this proof-of-concept study, we found that τi measured from ACE-MRI has a strong correlation with the SUV from 18F-FDG PET, suggesting the feasibility of using τi as an imaging marker for cellular metabolic activity without using a radioactive contrast agent. Future studies are warranted to further characterize τi as biomarker for cellular metabolic activity with a larger cohort and its potential for grading tumor aggressiveness and response to treatment.Acknowledgements
NIH R01CA160620, NIH R01CA219964, P41EB017183, NIH/NCI 5P30CA016087References
1. Springer, C. S., Li, X., Tudorica, L. A., Oh, K. Y., Roy, N., Chui, S. Y. C., Naik, A. M., Holtorf, M. L., Afzal, A., Rooney, W. D., & Huang, W. Intratumor mapping of intracellular water lifetime: Metabolic images of breast cancer? NMR in Biomedicine. 2014;27(7), 760–773.
2. Zhang, J., Feng, L., Otazo, R., & Kim, S. G. Rapid dynamic contrast-enhanced MRI for small animals at 7T using 3D ultra-short echo time and golden-angle radial sparse parallel MRI. Magnetic Resonance in Medicine. 2019;81(1), 140–152.
3. Zhang, J., & Kim, S. G. Estimation of cellular-interstitial water exchange in dynamic contrast enhanced MRI using two flip angles. NMR in Biomedicine. 2019;32(11), 1–17.
4. Sourbron SP, Buckley DL. Tracer kinetic modelling in MRI: estimating perfusion and capillary permeability. Phys Med Biol. 2012;57(2):R1-33.
5. McConnell, H. M. (1958). Reaction rates by nuclear magnetic resonance. The Journal of Chemical Physics, 28(3), 430–431. Lucignani G, Paganelli G, Bombardieri E. The use of standardized uptake values for assessing FDG uptake with PET in oncology: a clinical perspective. Nucl Med Commun. 2004;25(7):651-6.
Figures