1097
Repeatability of contrast kinetic parameters of whole tumor with isotropic resolution measured by 3D-UTE-GRASP method
Jin Zhang1, Ayesha Bharadwaj Das1, James Tranos2, Karl Kiser1, Youssef Zaim Wadghiri2, and Gene Kim1,2
1Weill Cornell Medicine, New York, NY, United States, 2NYU Langone Health, New York, NY, United States
1Weill Cornell Medicine, New York, NY, United States, 2NYU Langone Health, New York, NY, United States
Synopsis
The repeatability of dynamic contrast enhanced (DCE)-MRI has not been fully studied, particularly with contrast kinetic parameters including intracellular water lifetime (τi). The purposes of this study were: (1) to investigate the repeatability of DCE-MRI with the newly proposed technique, 3D-UTE-GRASP (Golden angle Radial Sparse Parallel), which can provide isotropic high-resolution images for quantitative pharmacokinetic model analysis; and (2) to investigate the repeatability of intracellular water lifetime estimation using the two-flip angle DCE-MRI approach.
Introduction
T1-weighted dynamic contrast enhanced (DCE)-MRI can be an important imaging tool for prediction and assessment of cancer treatment response. The repeatability of DCE-MRI has not been fully studied, particularly with contrast kinetic parameters including intracellular water lifetime (τi). We recently developed the 3D-UTE-GRASP (Golden angle Radial Sparse Parallel) method1 for DCE-MRI study. With this sequence, datasets were acquired serially with isotropic resolution under high temporal resolution. The same protocol incorporates 3D-T1 maps with identical resolution2, enabling quantitative analysis of a whole tumor3. The objective of this study was to investigate the repeatability of the proposed DCE-MRI technique for contrast kinetic parameters including τi.Methods
Six to eight-week-old C57BL6 mice (n=7) with GL261 mouse glioma models were included in this study. MRI experiments were performed on a Bruker 7T micro-MRI system, with a 1H four-channel phased array cryogenically cooled receive-only MRI coil. Two DCE-MRI experiments were carried out with a 30 minutes gap. DCE-MRI image acquisition was performed using 3D-UTE-GRASP pulse sequence1 (TR=4ms and TE=0.028ms) to achieve an isotropic spatial resolution and to minimize the T2* effect. It was continuously run to acquire 154,080 spokes (51,360 spokes each flip angle segment 8o - 25o - 8o) for 10 minutes and 13 seconds. Reconstruction temporal frame resolution was T = 5 s/frame. Image matrix = 128x128x128, field of view = 20x20x20 mm3 and the spatial resolution was 0.156x0.156x0.156 mm3. A bolus of gadoxetate disodium (Eovist, Bayer) in saline at the dose of 0.1 mmol/kg was injected through a tail vein catheter, starting 60 seconds after the start of data acquisition. Prior to each DCE-MRI experiment, a 3D T1 map with the same isotropic high resolution was obtained using the same 3D-UTE-GRASP sequence2 with variable flip angles (8o - 2o - 12o, 12,776 spokes for each flip angle, with total acquisition time was 153 s). To align the tumor voxels between the 1st and the 2nd DCE-MRI scans, the 2nd experiment (both T1 and DCE-MRI) was registered to the 1st DCE-MRI by applying rigid body transformation (Figure 1A and 1B). Arterial input function (AIF) was obtained using the Principal Component Analysis (PCA) method used in our previous study4 with the measured T1 maps described above (Figure 1C). Pharmacokinetic model analysis was carried out for the tumor with the two-compartment exchange model with water exchange4, yielding five parameters: PS (permeability surface area product), Fp (blood flow), ve (extracellular space volume fraction), vp (vascular space volume fraction) and τi (intracellular water lifetime) (Figure 2).Results and Discussions
Figure 2 shows that ve and vp showed small differences between the 1st and 2nd scans. In contrast, PS and Fp appear to be higher in the 2nd scan. τi showed a large variability between the 1st and 2nd experiments. Figure 3 shows the boxplots comparison of the whole tumor pharmacokinetic model parameters. Figure 4 shows comparisons of the median values of all 7 animals. Similar to the observation in Figure 2, ve and vp showed strong correlations between the two scans, with correlation coefficients were 0.61 and 0.70, respectively. Wilcoxon signed rank test showed that there is not enough evidence to reject the null hypothesis of equal median with p-values of 0.375 (ve) and 0.467 (vp). This is reasonable since cellular volumetric properties were expected to remain same within one hour of the two scans. The other two parameters, PS and Fp, of the 2nd experiment seem to be higher than those of the 1st scan, which may indicate the actual changes of the physiological properties of the tumor between two scans. The last parameter, τi, showed a large variability between the two scans. Wilcoxon signed rank test showed the failure to reject the null hypothesis with p-values are 0.109 (PS), 0.078 (Fp) and 0.156 (τi) respectively. Only the p-value for Ktrans (0.047) showed that the rejection of the null hypothesis. Figure 5 shows the comparison of whole tumor τi estimation precision (evaluated with interquartile range, IQR) changes with Ktrans changes. Out of six animals with Ktrans increases in the 2nd scan, four animals showed improved precision in τi estimation (IQR decreases in the 2nd scan). One of the limitations of the current study is the repetition of the two DCE-MRI experiments within one hour, where the contrast agent from the 1st DCE-MRI was still not fully washed out (which can be observed from the relative lower T1 values in Figure 1A) during the 30 min gap between the two scans.Conclusion
This study demonstrates the feasibility and limitation of using the 3D-UTE-GRASP sequence based DCE-MRI technique for longitudinal studies with pharmacokinetic model analysis. While the DCE-MRI parametric measurements were found consistent through the entire tumor volumes between two scans, our results showed that Fp and PS could change between two consecutive scans that could also affect the estimation of τi.Acknowledgements
NIH R01CA160620, NIH R01CA219964, P41EB017183, NIH/NCI 5P30CA016087References
- J. Zhang, L. Feng, R. Otazo and S. Kim, MRM, 2019 Jan;81(1):140-152.
- J. Zhang, K. Kiser and S. Kim, ISMRM abstract 4709, 2020.
- J. Zhang, K. Kiser, C. Zhang, A. Bharadwaj Das, and S. Kim, ISMRM abstract 0007,
2020.
- J. Zhang and S. Kim, NMR in Biomedicine, 2019 Nov;32(11),e4135
Figures
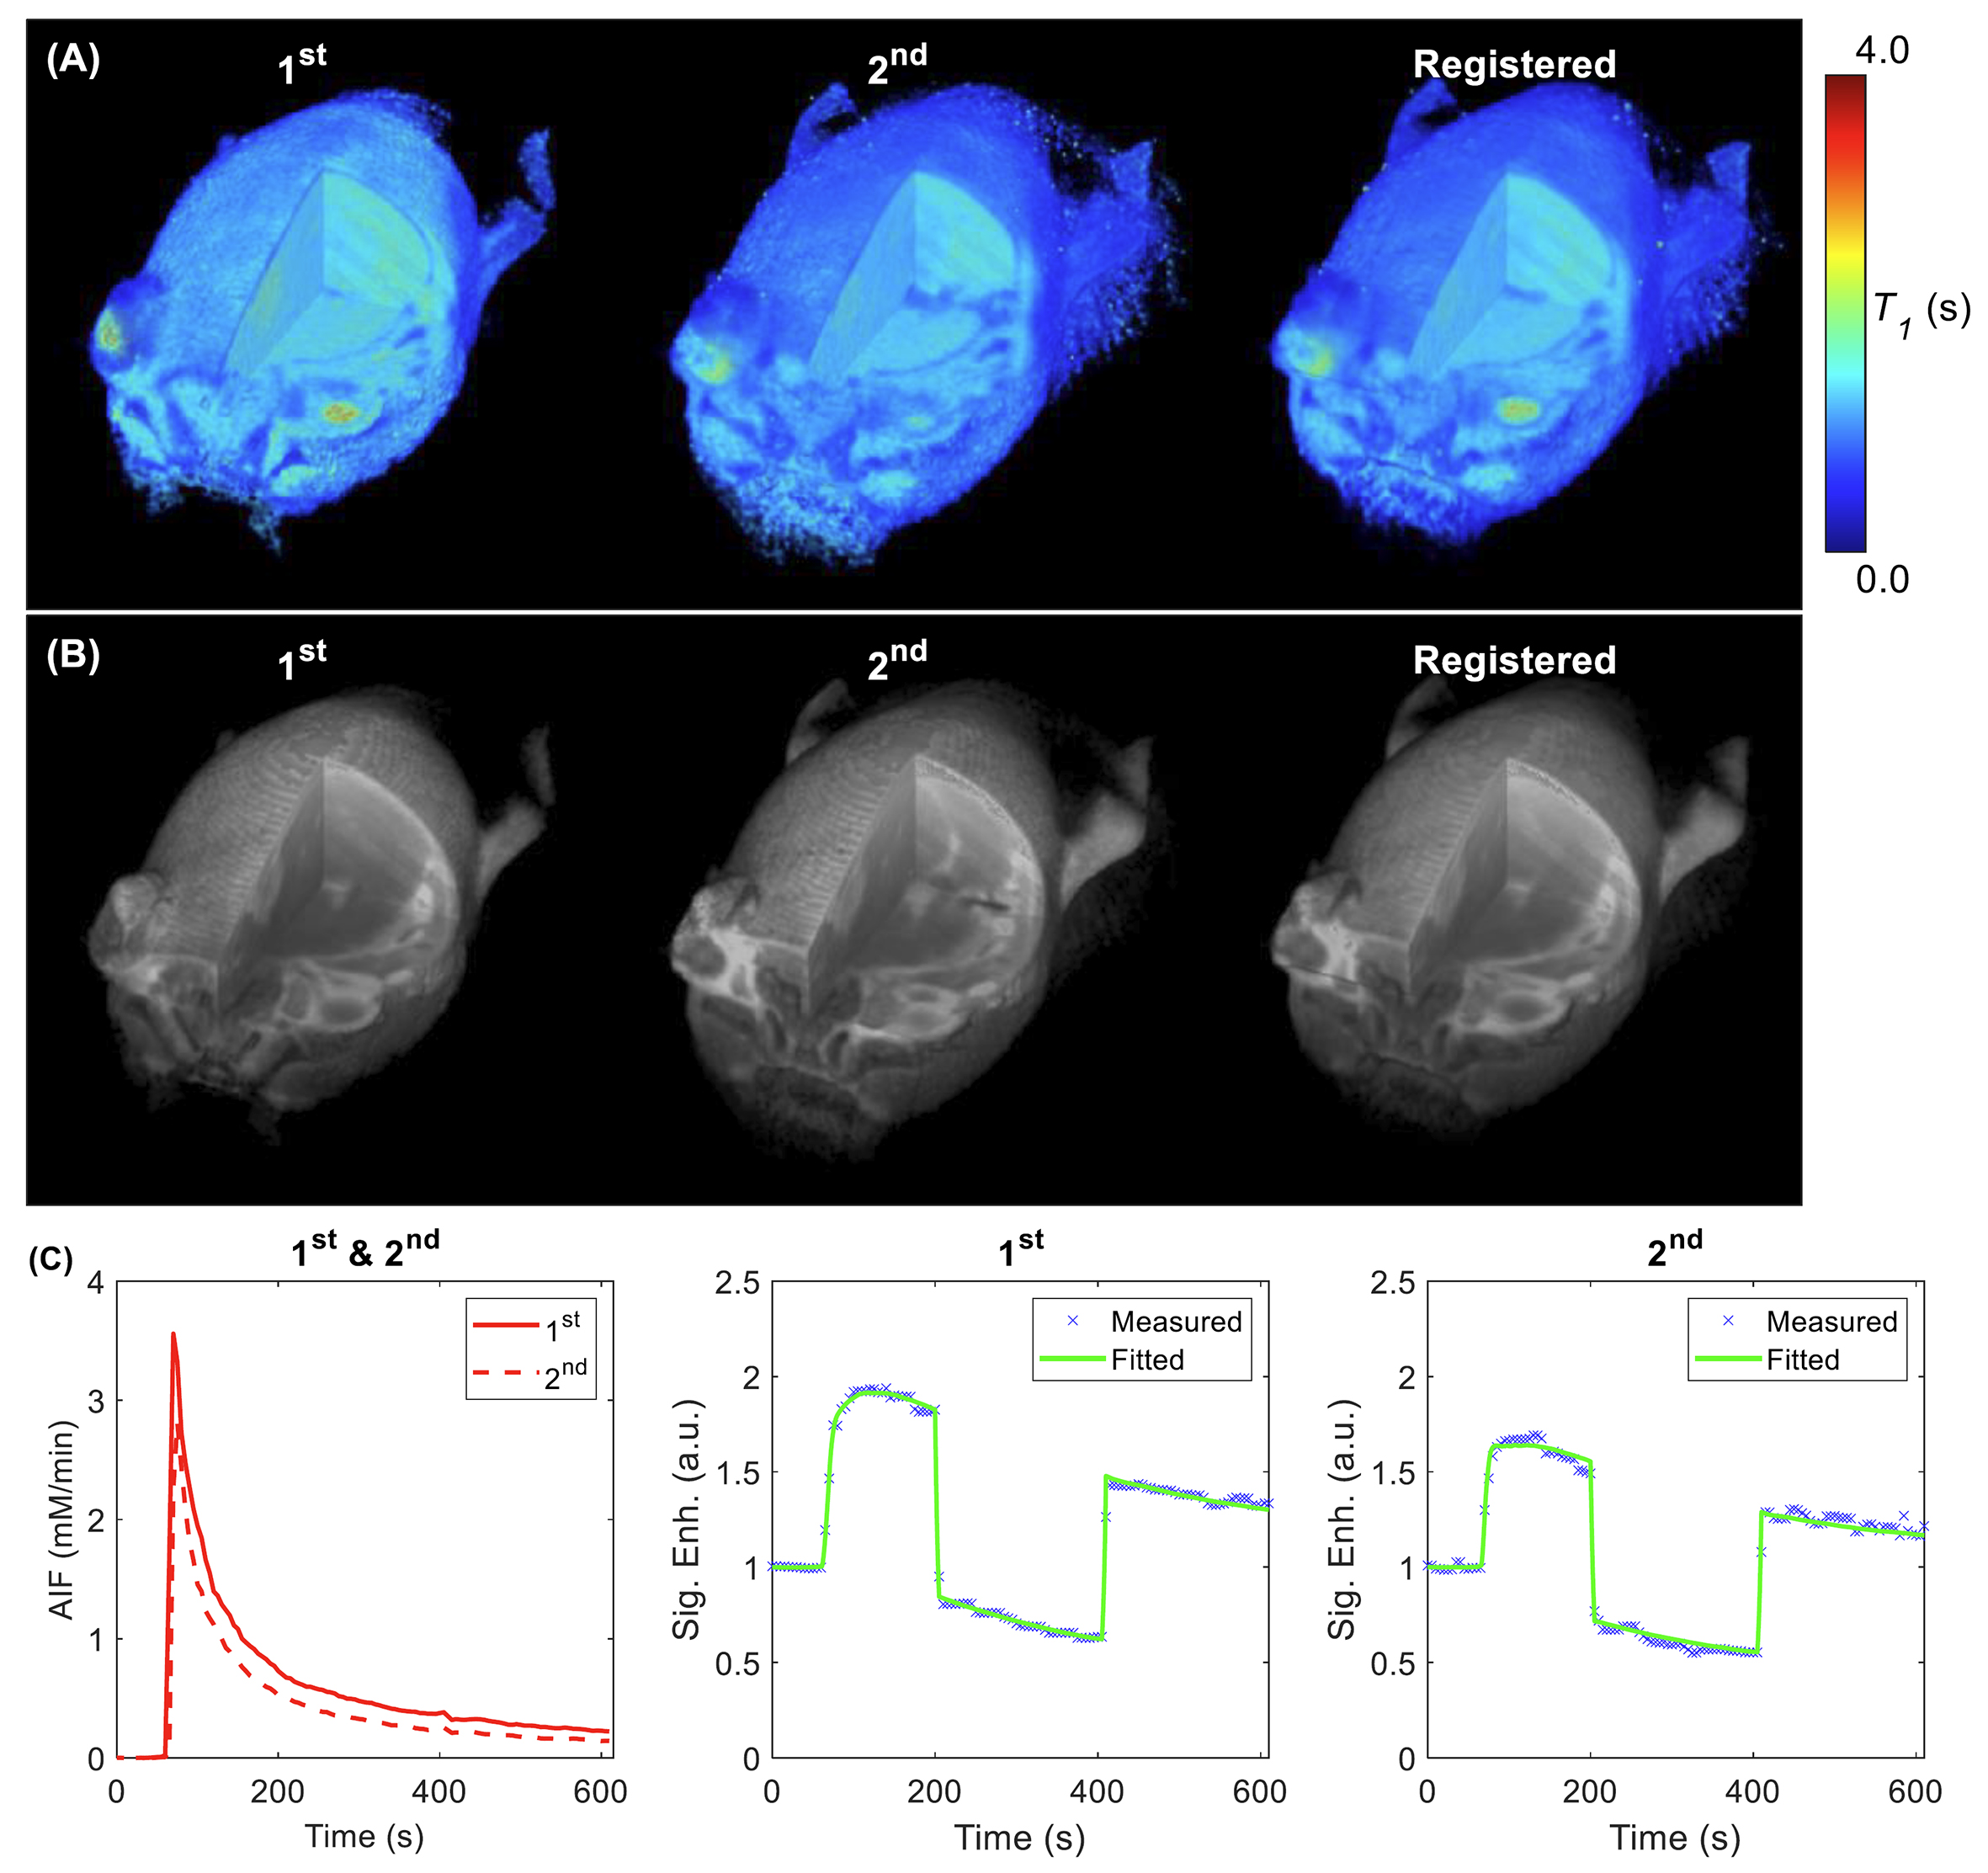
Figure 1. (A) T1 volume from 1st
and 2nd DCE-MRI and register the 2nd T1
volume to the 1st. (B) DCE-MRI frame (2 min after contrast
injection) from 1st and 2nd DCE-MRI and register the 2nd
DCE-MRI frame to the 1st. (C) Sample AIFs and signal enhancement curves of one tumor voxel from the 1st
and the 2nd scans.
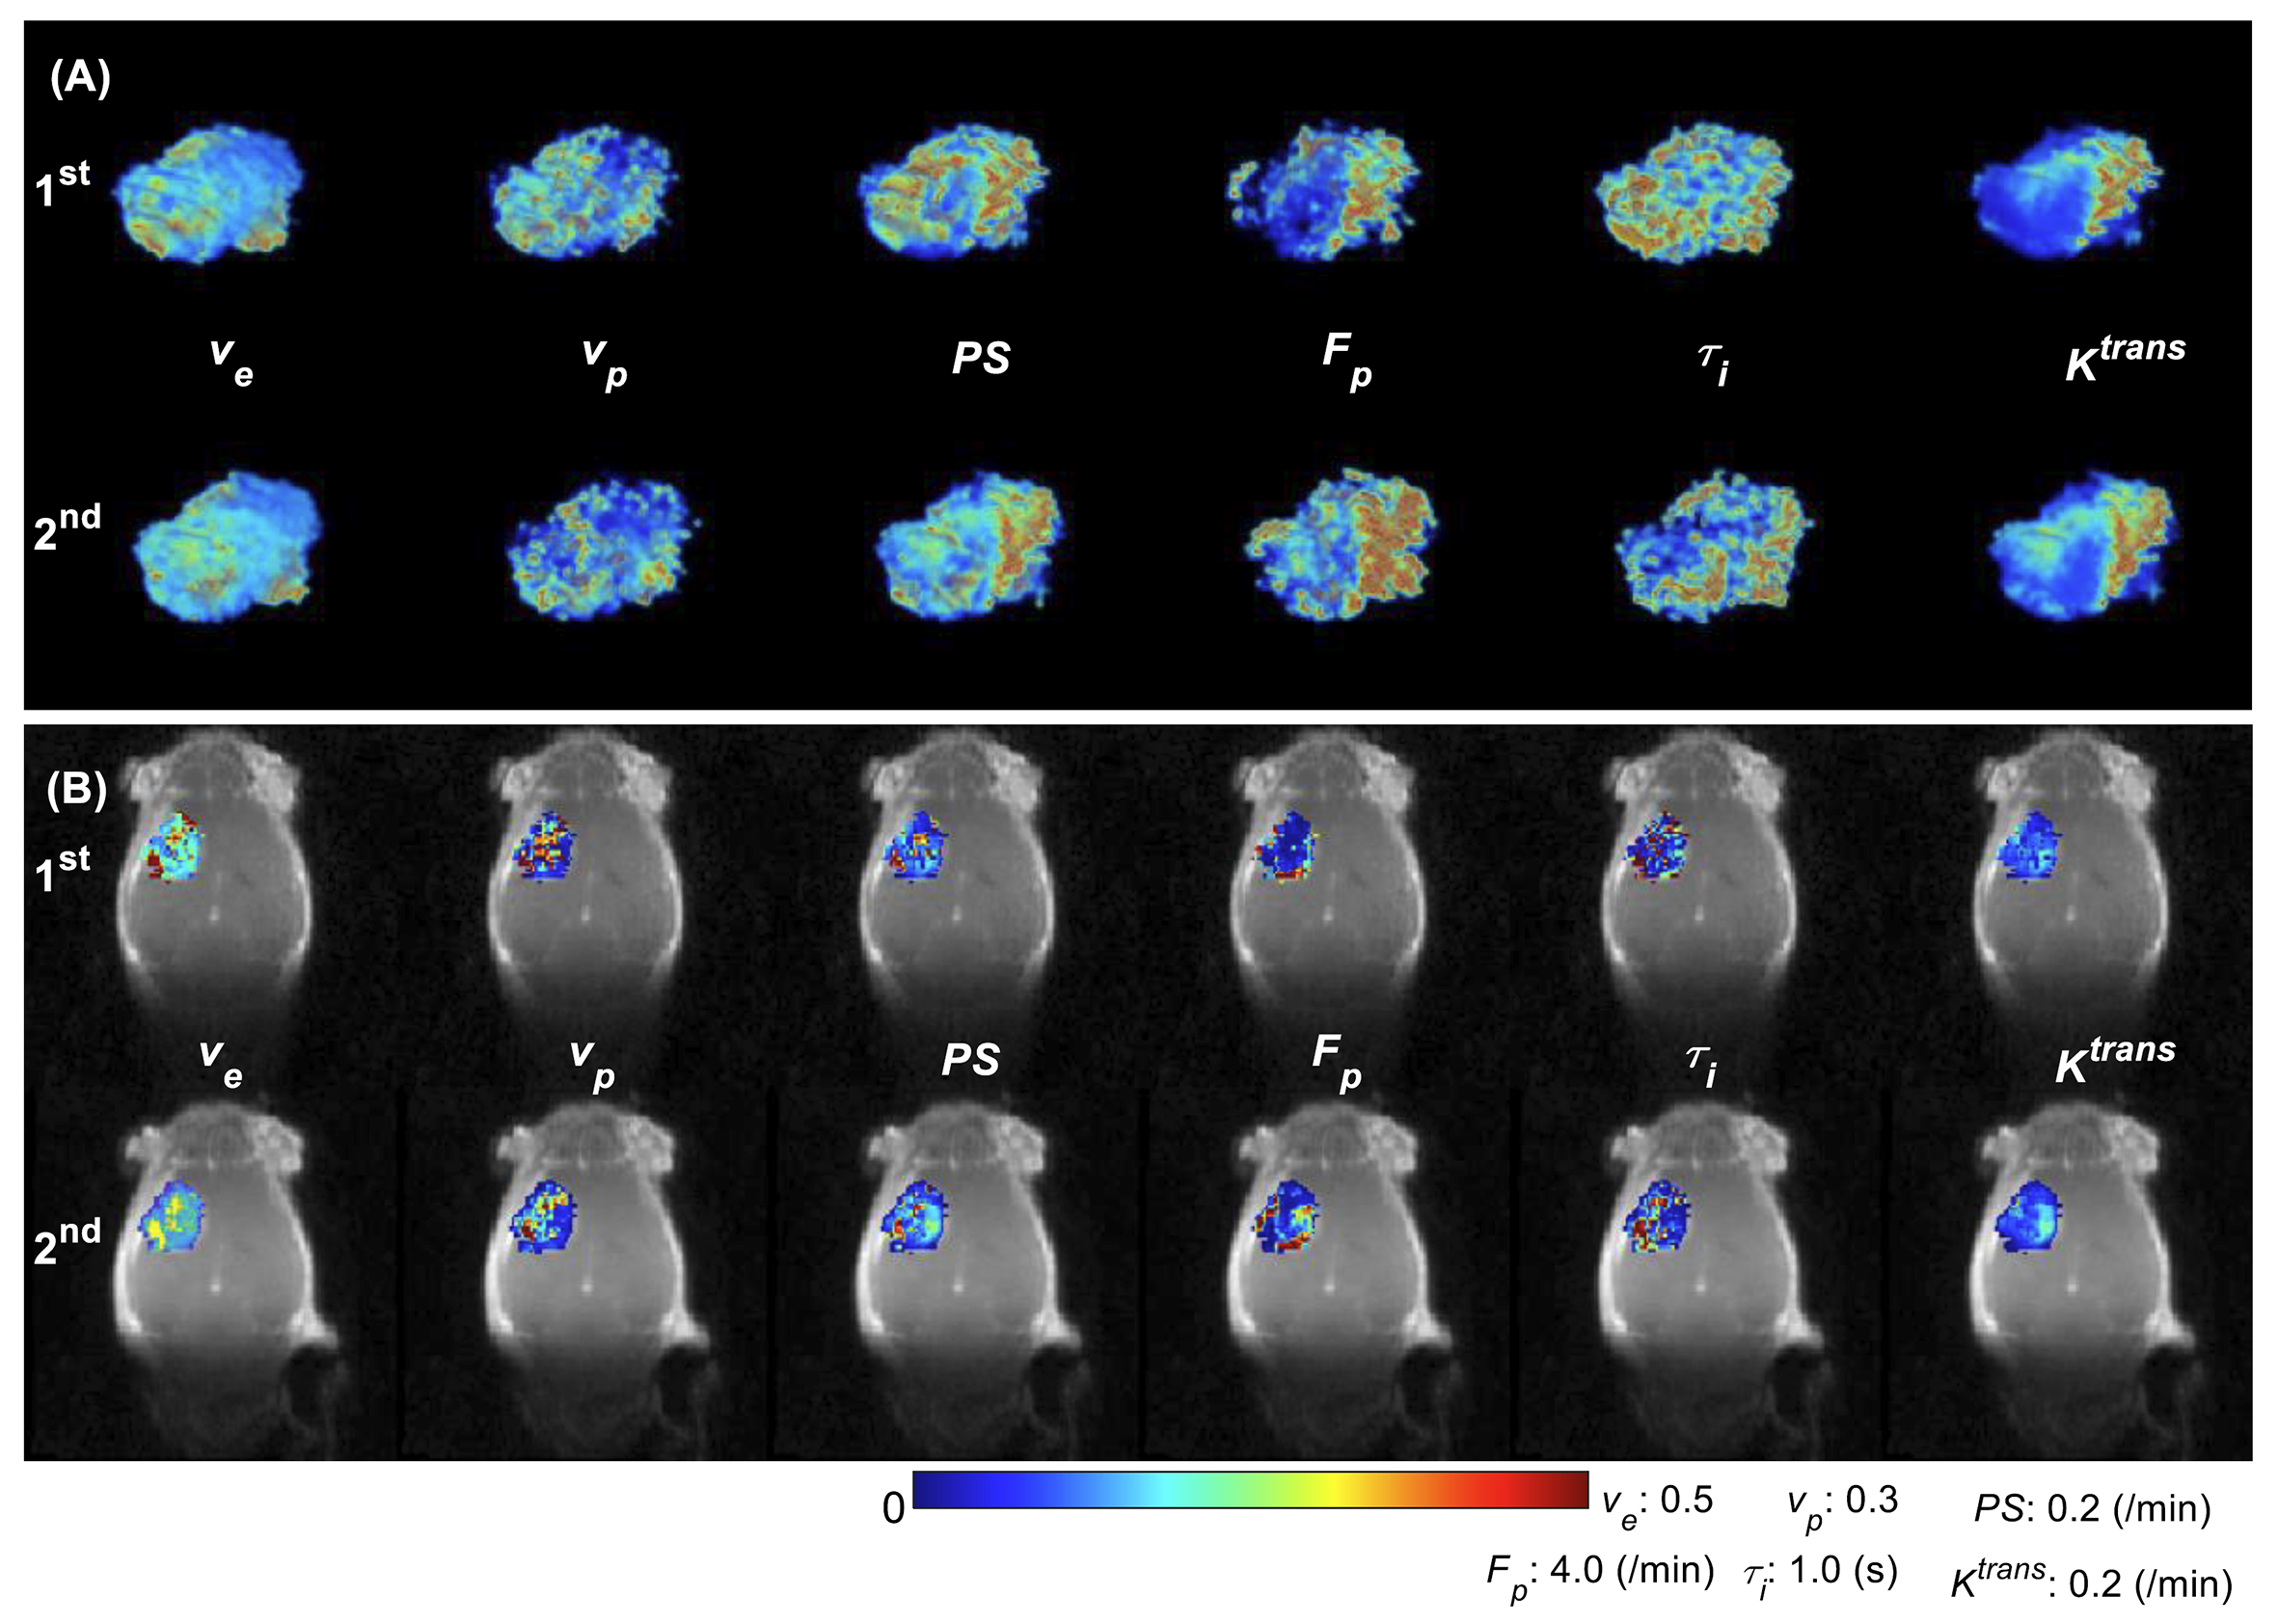
Figure 2. Comparison of the tumor pharmacokinetic model
parameters between the 1st and the 2nd scans for one
mouse. (A) 3D volume rendering of whole tumor high resolution pharmacokinetic parameters.
(B) Tumor center slice parameter colormaps overlay on DCE-MRI images in coronal
direction.
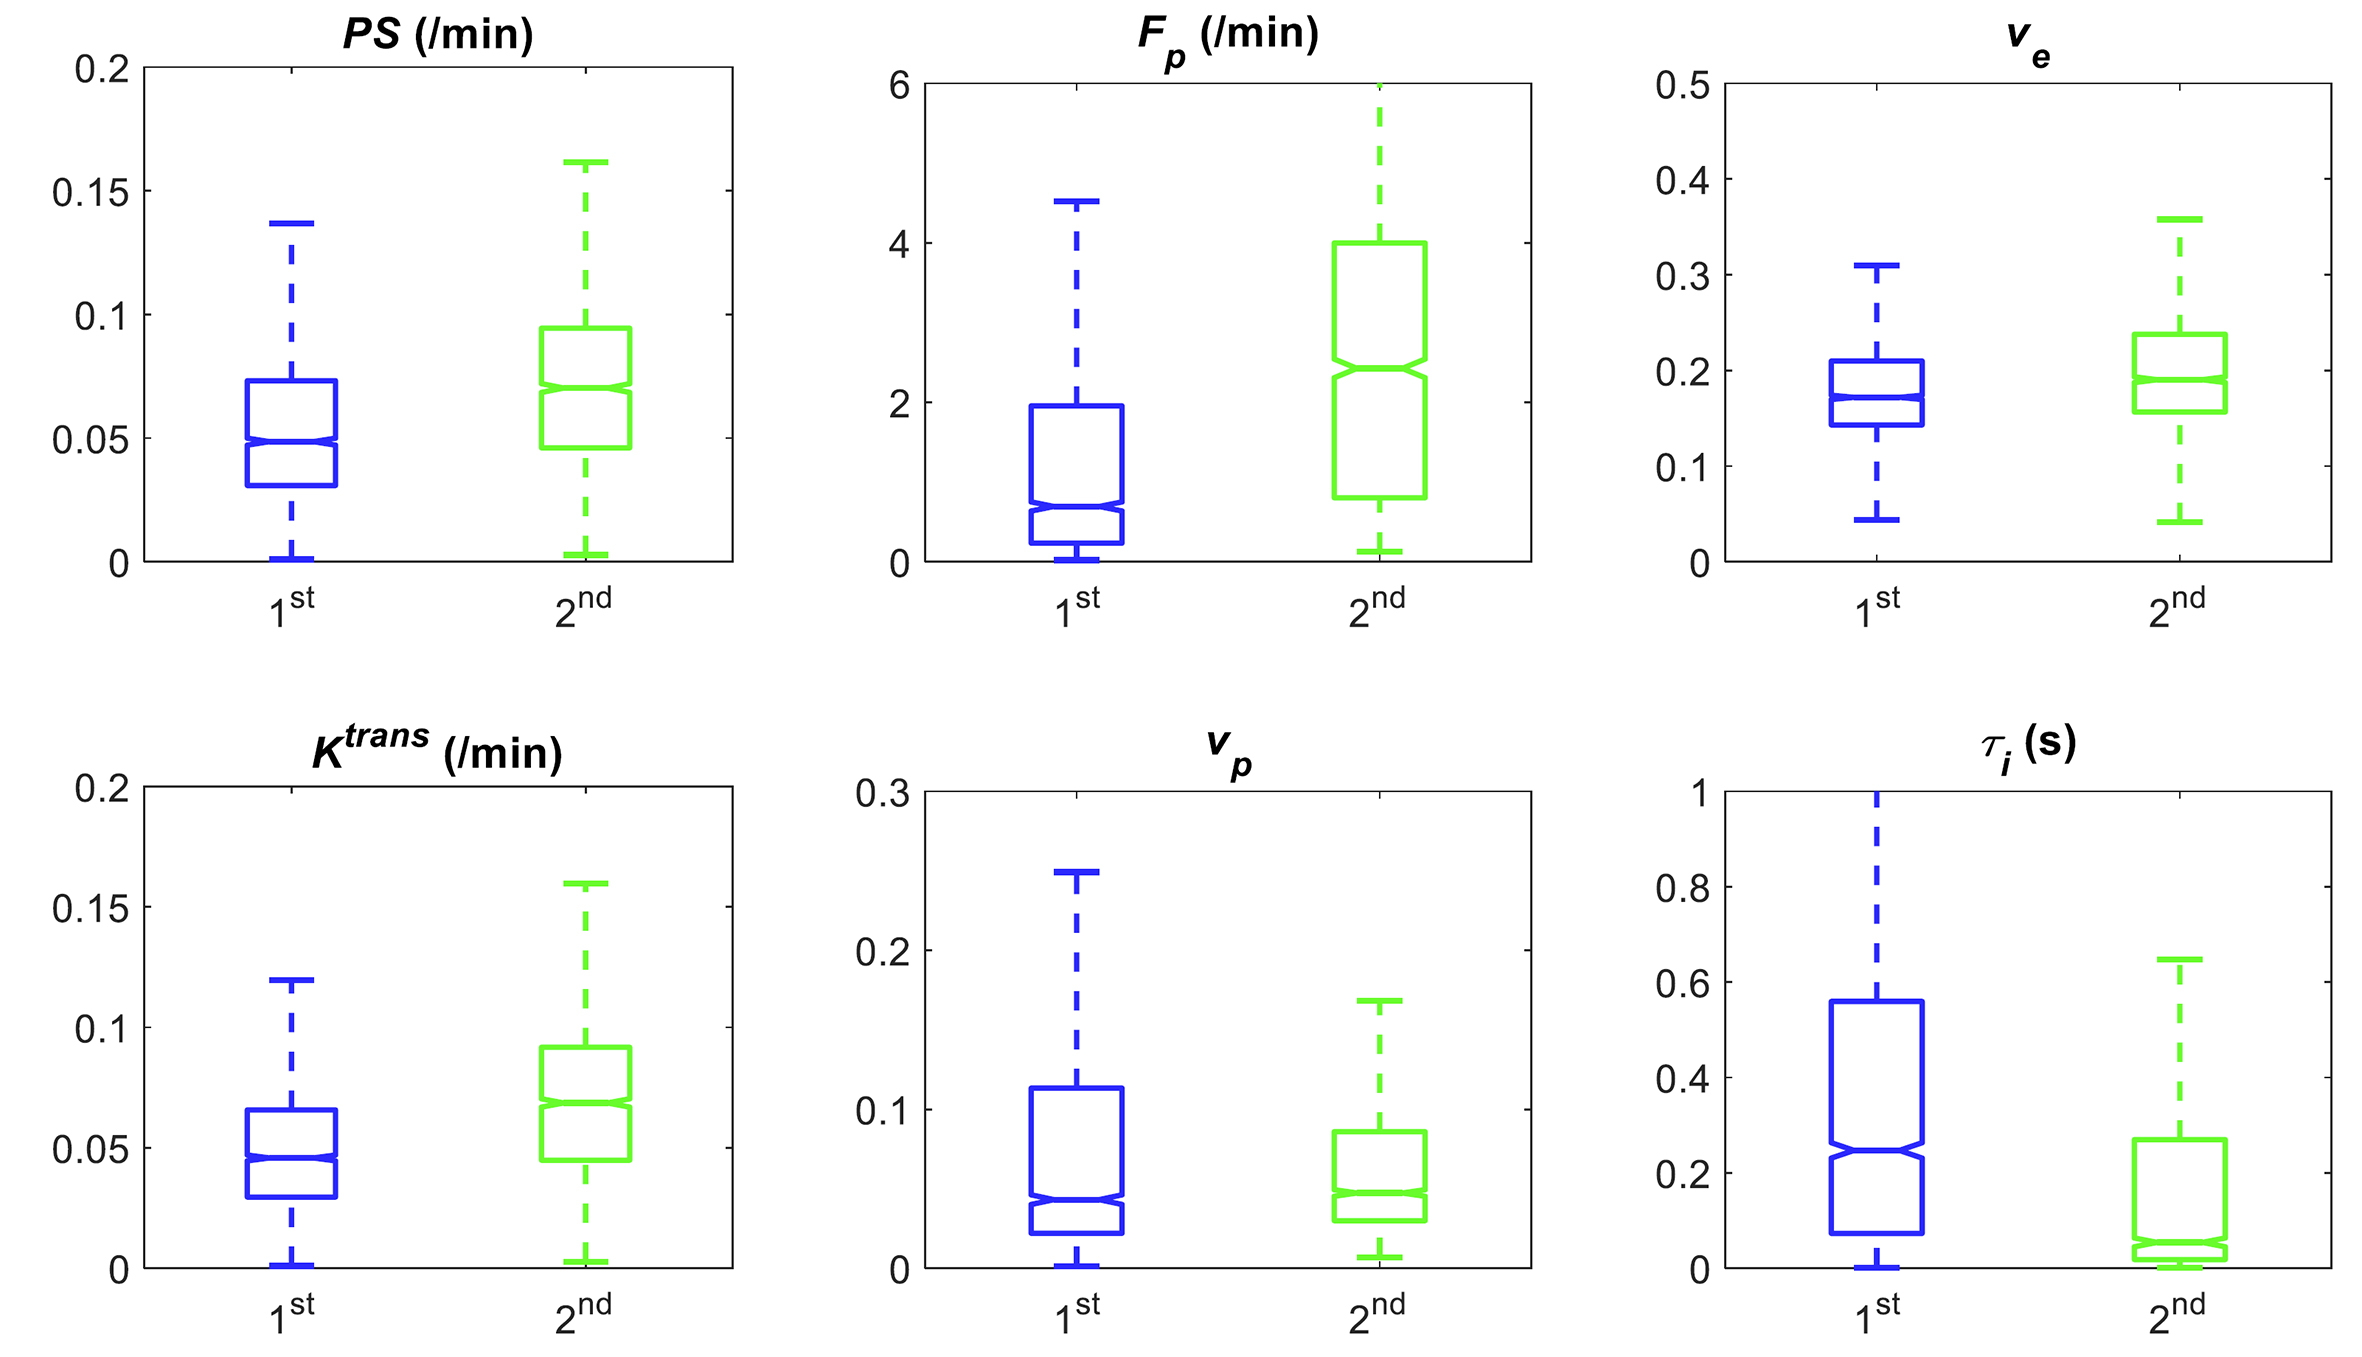
Figure 3. Box plots comparison of estimated tumor
parameters from all the tumor voxels in one mouse.
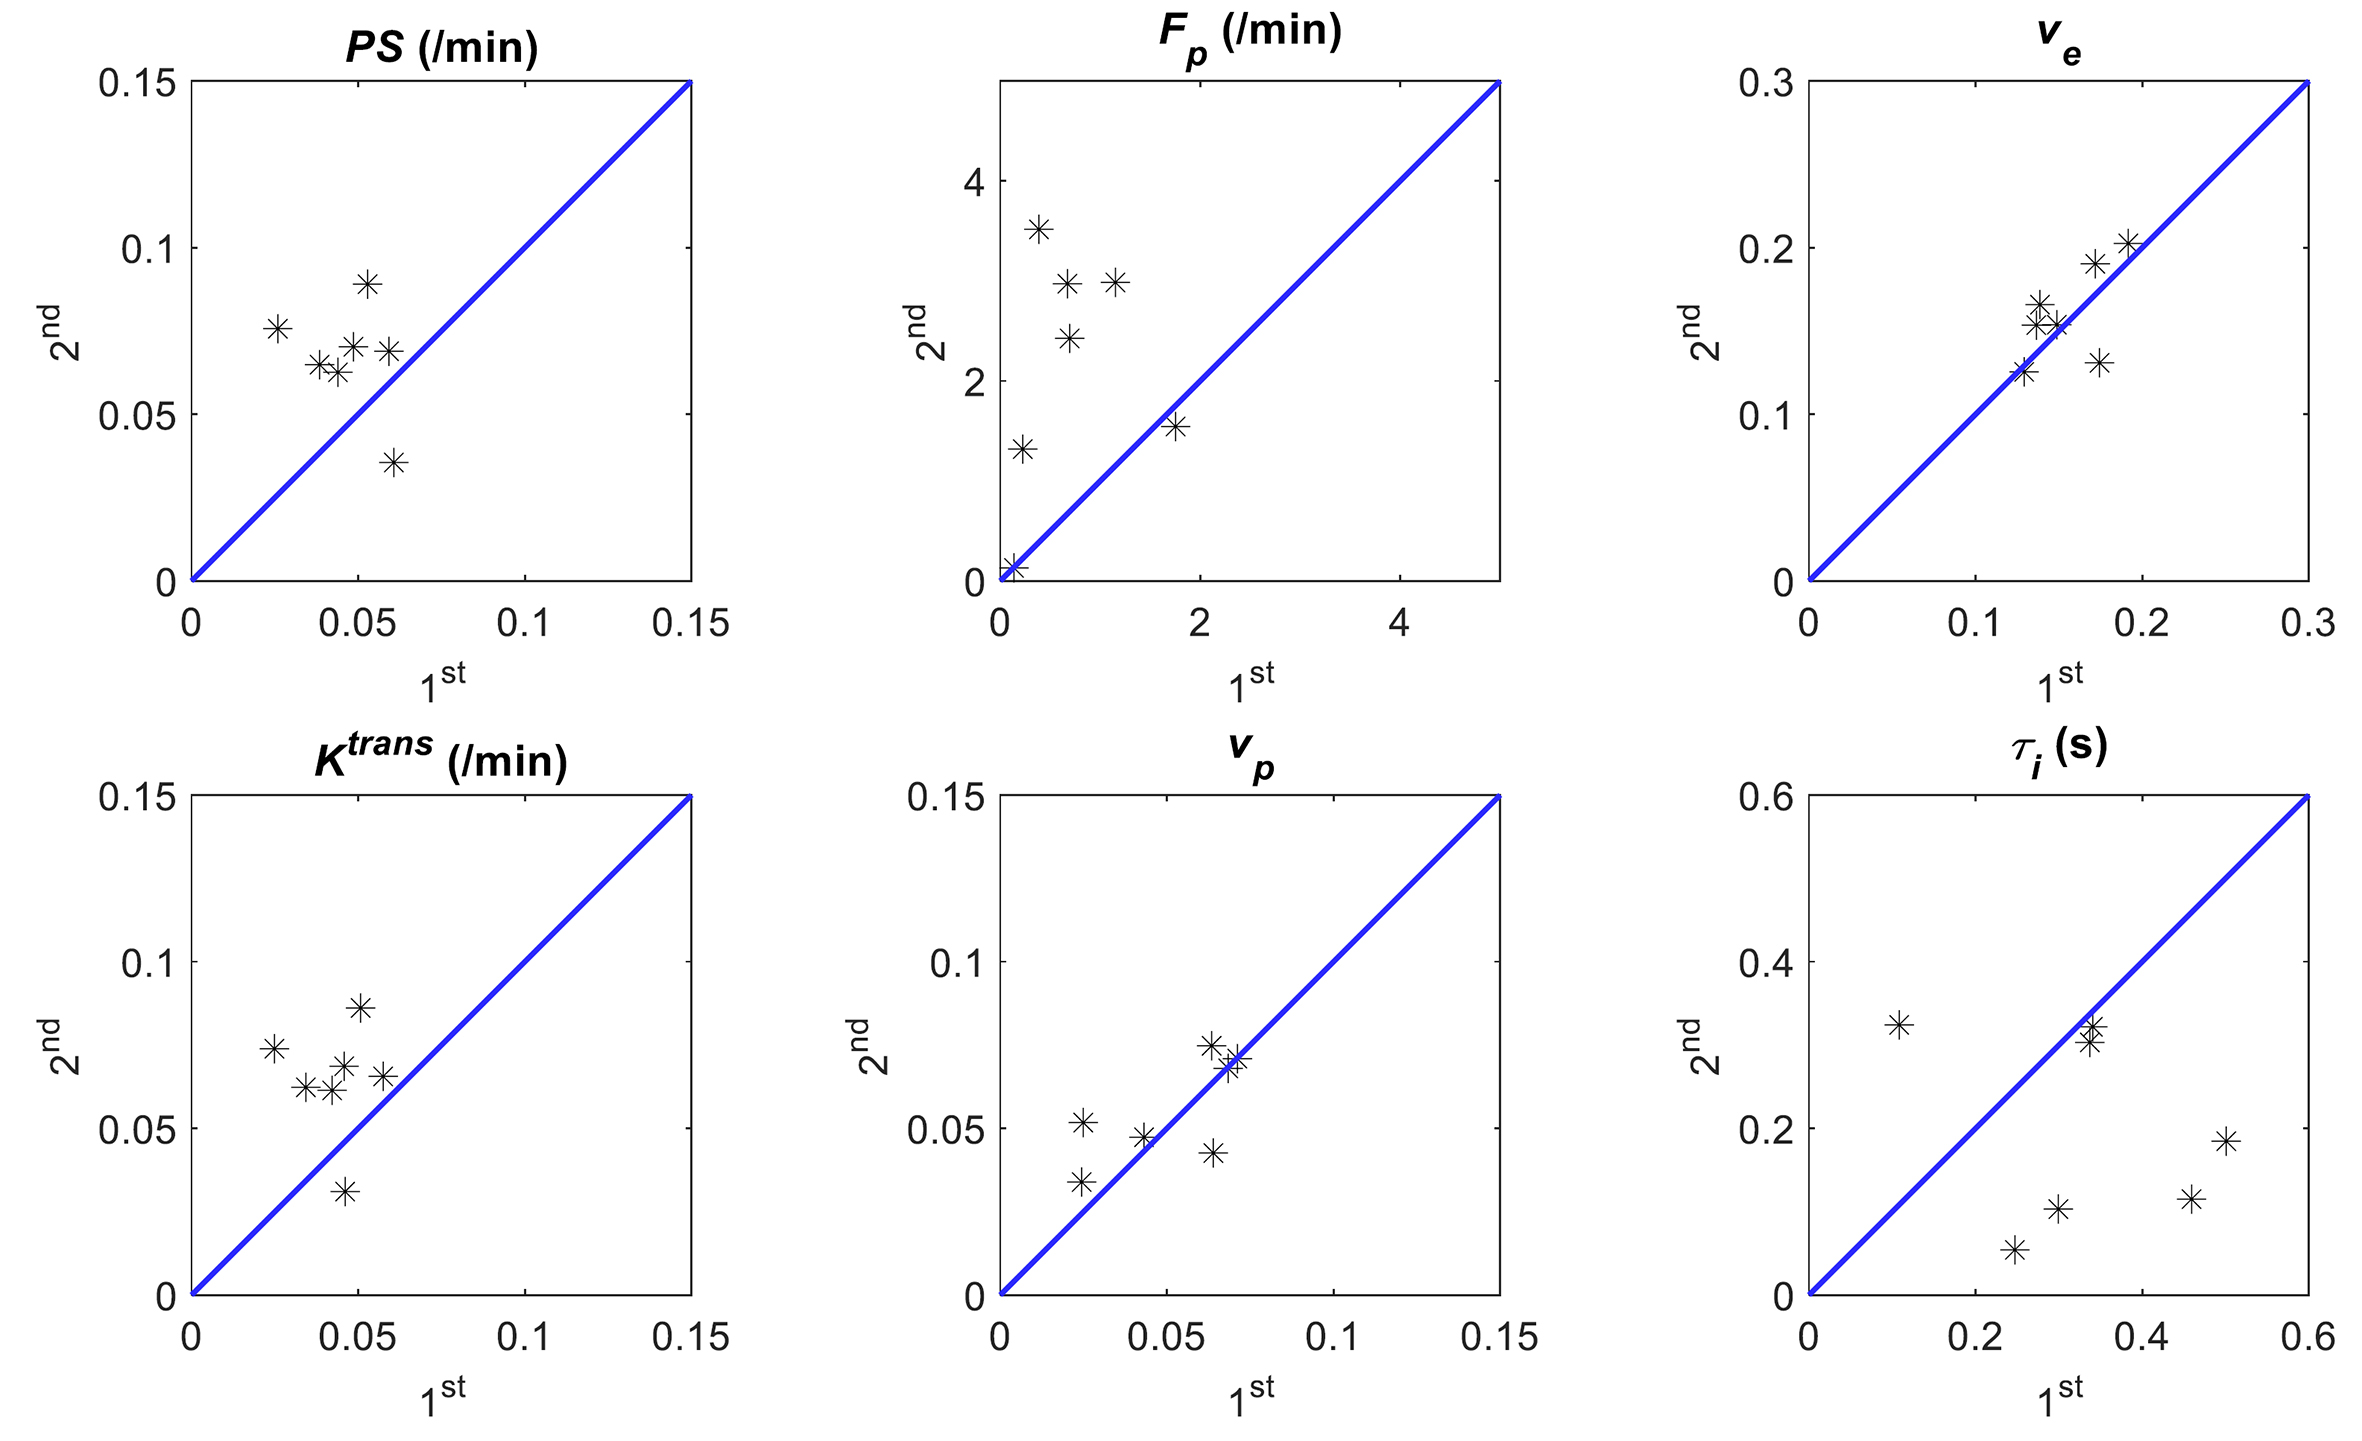
Figure 4. Scatter plots comparison of tumor median pharmacokinetic
model parameters estimated from the 1st and the 2nd
DCE-MRI for all the 7 animals.
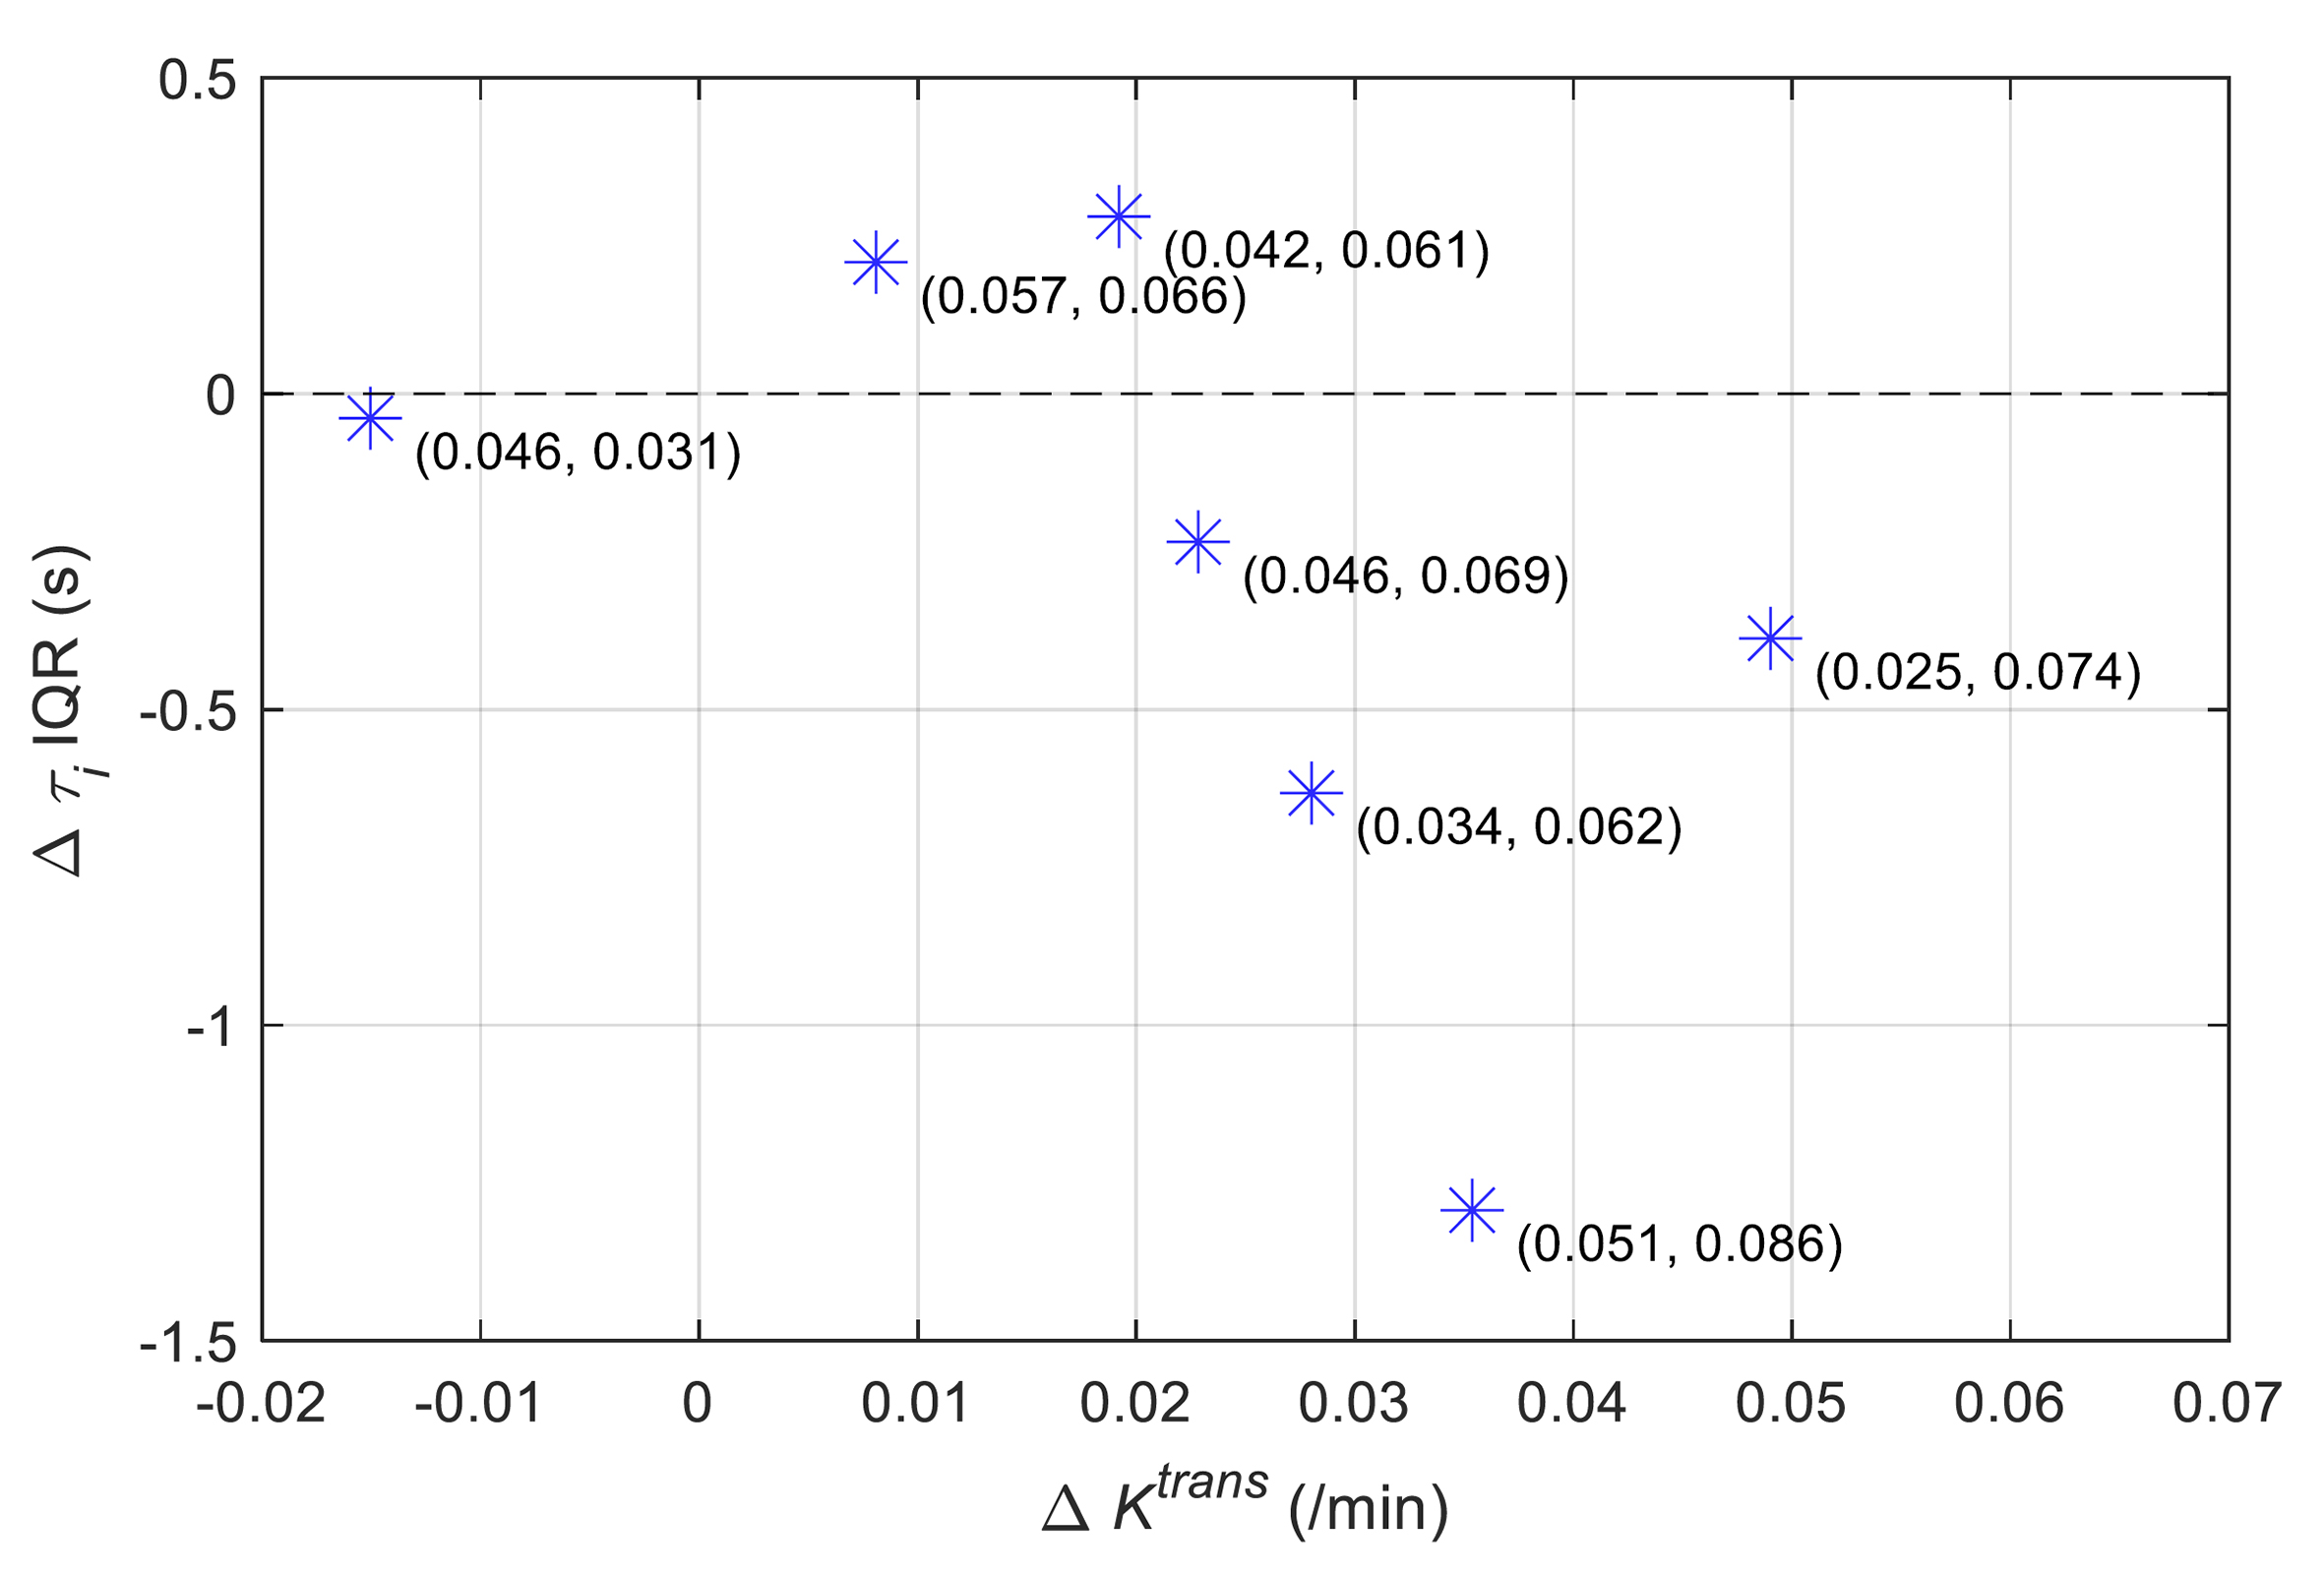
Figure 5. Scatter plot comparison between tumor median Ktrans
change and whole tumor τi estimation interquartile
range (IQR) change of the 1st and the 2nd scans. The
numbers in brackets indicates (tumor median Ktrans
from 1st scan, tumor median Ktrans
from 2nd scan).