1096
Effect of Normalization of DCE-MRI derived Tracer Kinetic Parameters on Glioma Grading1Indian Institute of Technology Delhi, New Delhi, India, 2Fortis Memorial Research Institute, Gurugram, India, 3All India Institute of Medical Science, New Delhi, India
Synopsis
Arterial-Input-Function(AIF) is a pre-requisite in fitting generalized-tracer-kinetic-model(GTKM) to dynamic-contrast-enhanced(DCE) MRI data for computing tracer-kinetic-parameters(TKP). TKP are highly sensitive to peak and shape of AIF, and this results in variation in computed parameter values across studies. These variations can reduce accuracy of TKP in glioma grading. We hypothesize that propagation of these AIF related errors to TKP can be mitigated using normalization w.r.t. corresponding average TKP values of healthy tissue and normalized TKP might improve glioma grading. The proposed normalization w.r.t. healthy gray-matter tissue has significantly reduced variations of TKP and improved accuracy of glioma grading particularly using Ktrans.
Introduction
Dynamic-contrast-enhanced MRI(DCE-MRI) derived trace- kinetic-parameters(TKP) computed from generalized-tracer-kinetic-model(GTKM) has shown its potential in diagnosis, treatment planning and grading of glioma1–3. Arterial-input-function(AIF) is a prerequisite in fitting GTKM to the voxel-wise concentration-time curve(C(t)). Different manual, semi-automatic and automatic segmentation of arterial voxels have been reported previously4–6. Depending on different parameters like contrast injection dose, partial volume effect, heart output rate, etc., AIF shows high inter-subject and intra-subject variability(during follow-up) in its peak and shape6. Since TKP are highly sensitive to these variations, parameters reported across different studies show variation in their magnitude scales6,7. It was hypothesized that normalization can play a key role to minimize these variations. The objective of this study was to compare four different normalization approaches to minimize the variations of TKP and evaluate effect of normalization on differentiating high-grade-glioma(HGG) vs. low-grade-glioma(LGG).Methods
This retrospective study included 31-HGG, 22-LGG and 33 follow-up data from 10 subjects (pre and post-operative) histologically confirmed with glioma(WHO 2016 classification). MRI data included conventional MRI images(2D T1-W, dual PD-T2-W, 3D FLAIR) and DCE-MRI data acquired at 3T(Ingenia, Philips Healthcare, The Netherlands). DCE-MRI data protocol: 20 slices,6mm thickness,TR/TE=6.15/3ms, 10o FA, 230×230mm2 FOV, 32 time-points with 3.8s temporal-resolution. Contrast(Gd-BOPTA) of dose 0.1 mmol/kg body weight was injected at 4th time point at 3.0ml/sec injection rate Voxel-wise conversion of signal-intensity time curve to C(t) was perfomed using a T1 map computed from 3-point TSE method1. A piece-wise linear model was fitted to each C(t) to estimate features like bolus arrival time(BAT), wash-out slope etc7. and these parameters were used as features to segment AIF voxels. A mean AIF across all slices were used in this study to compute TKP. In this study, we have proposed TKP normalization based on the perfusion in contralesional mean gray-matter(GM) and mean white-matter(WM) curves(Type-1 and Type-3) and compared this with the previously reported technique to normalize hemodynamic parameters(rCBV, rCBF)8 on TKP(Type-2 and Type-4). The steps for Type-1,2,3 and 4 normalizations are given below:i.Segment the contralesional GM and WM tissues of multiple slices(In this study, we have considered the central 25% of total spatial coverage).
ii.Compute the mean C(t) of the segmented GM and WM mask to obtain GM-C(t) and WM- C(t) (to compute the mean curves, C(t) were co-registered with respect to BAT to avoid dispersion effect).
iii.Fit the GTKM to the mean GM-C(t) and WM-C(t) to compute the parameters corresponding to mean C(t)(α1,β1,γ1,α2,β2,γ2). α1,β1,γ1 corresponds to Ktrans, ve, and vp of GM-C(t), and α2,β2,γ2 corresponds to Ktrans, ve, and vp of WM-C(t)
iv.For Type-1 and Type-3 normalization, divide the Ktrans, ve, and vp maps(estimated from equation(1)) with the corresponding parameter value obtained from step(iii)
v. Compute the mean value corresponding to GM and WM masks (step(i)) of Ktrans (αmean1,αmean2), ve (βmean1,βmean2) and vp (γmean1,γmean2).
vi. For Type-2 and Type-4 normalization, divide the Ktrans, ve, and vp maps(estimated from equation(1)) with the corresponding parameter value obtained from step(v)
In this study, Co-efficient of variation(CoV)(ratio of standard deviation to mean) and relative-percentage-error(RPE) were used to evaluate variation in TKP w.r.t. AIF. A t-test and ROC curve analysis were performed for evaluating differentiation between LGG and HGG.
Results and Discussion
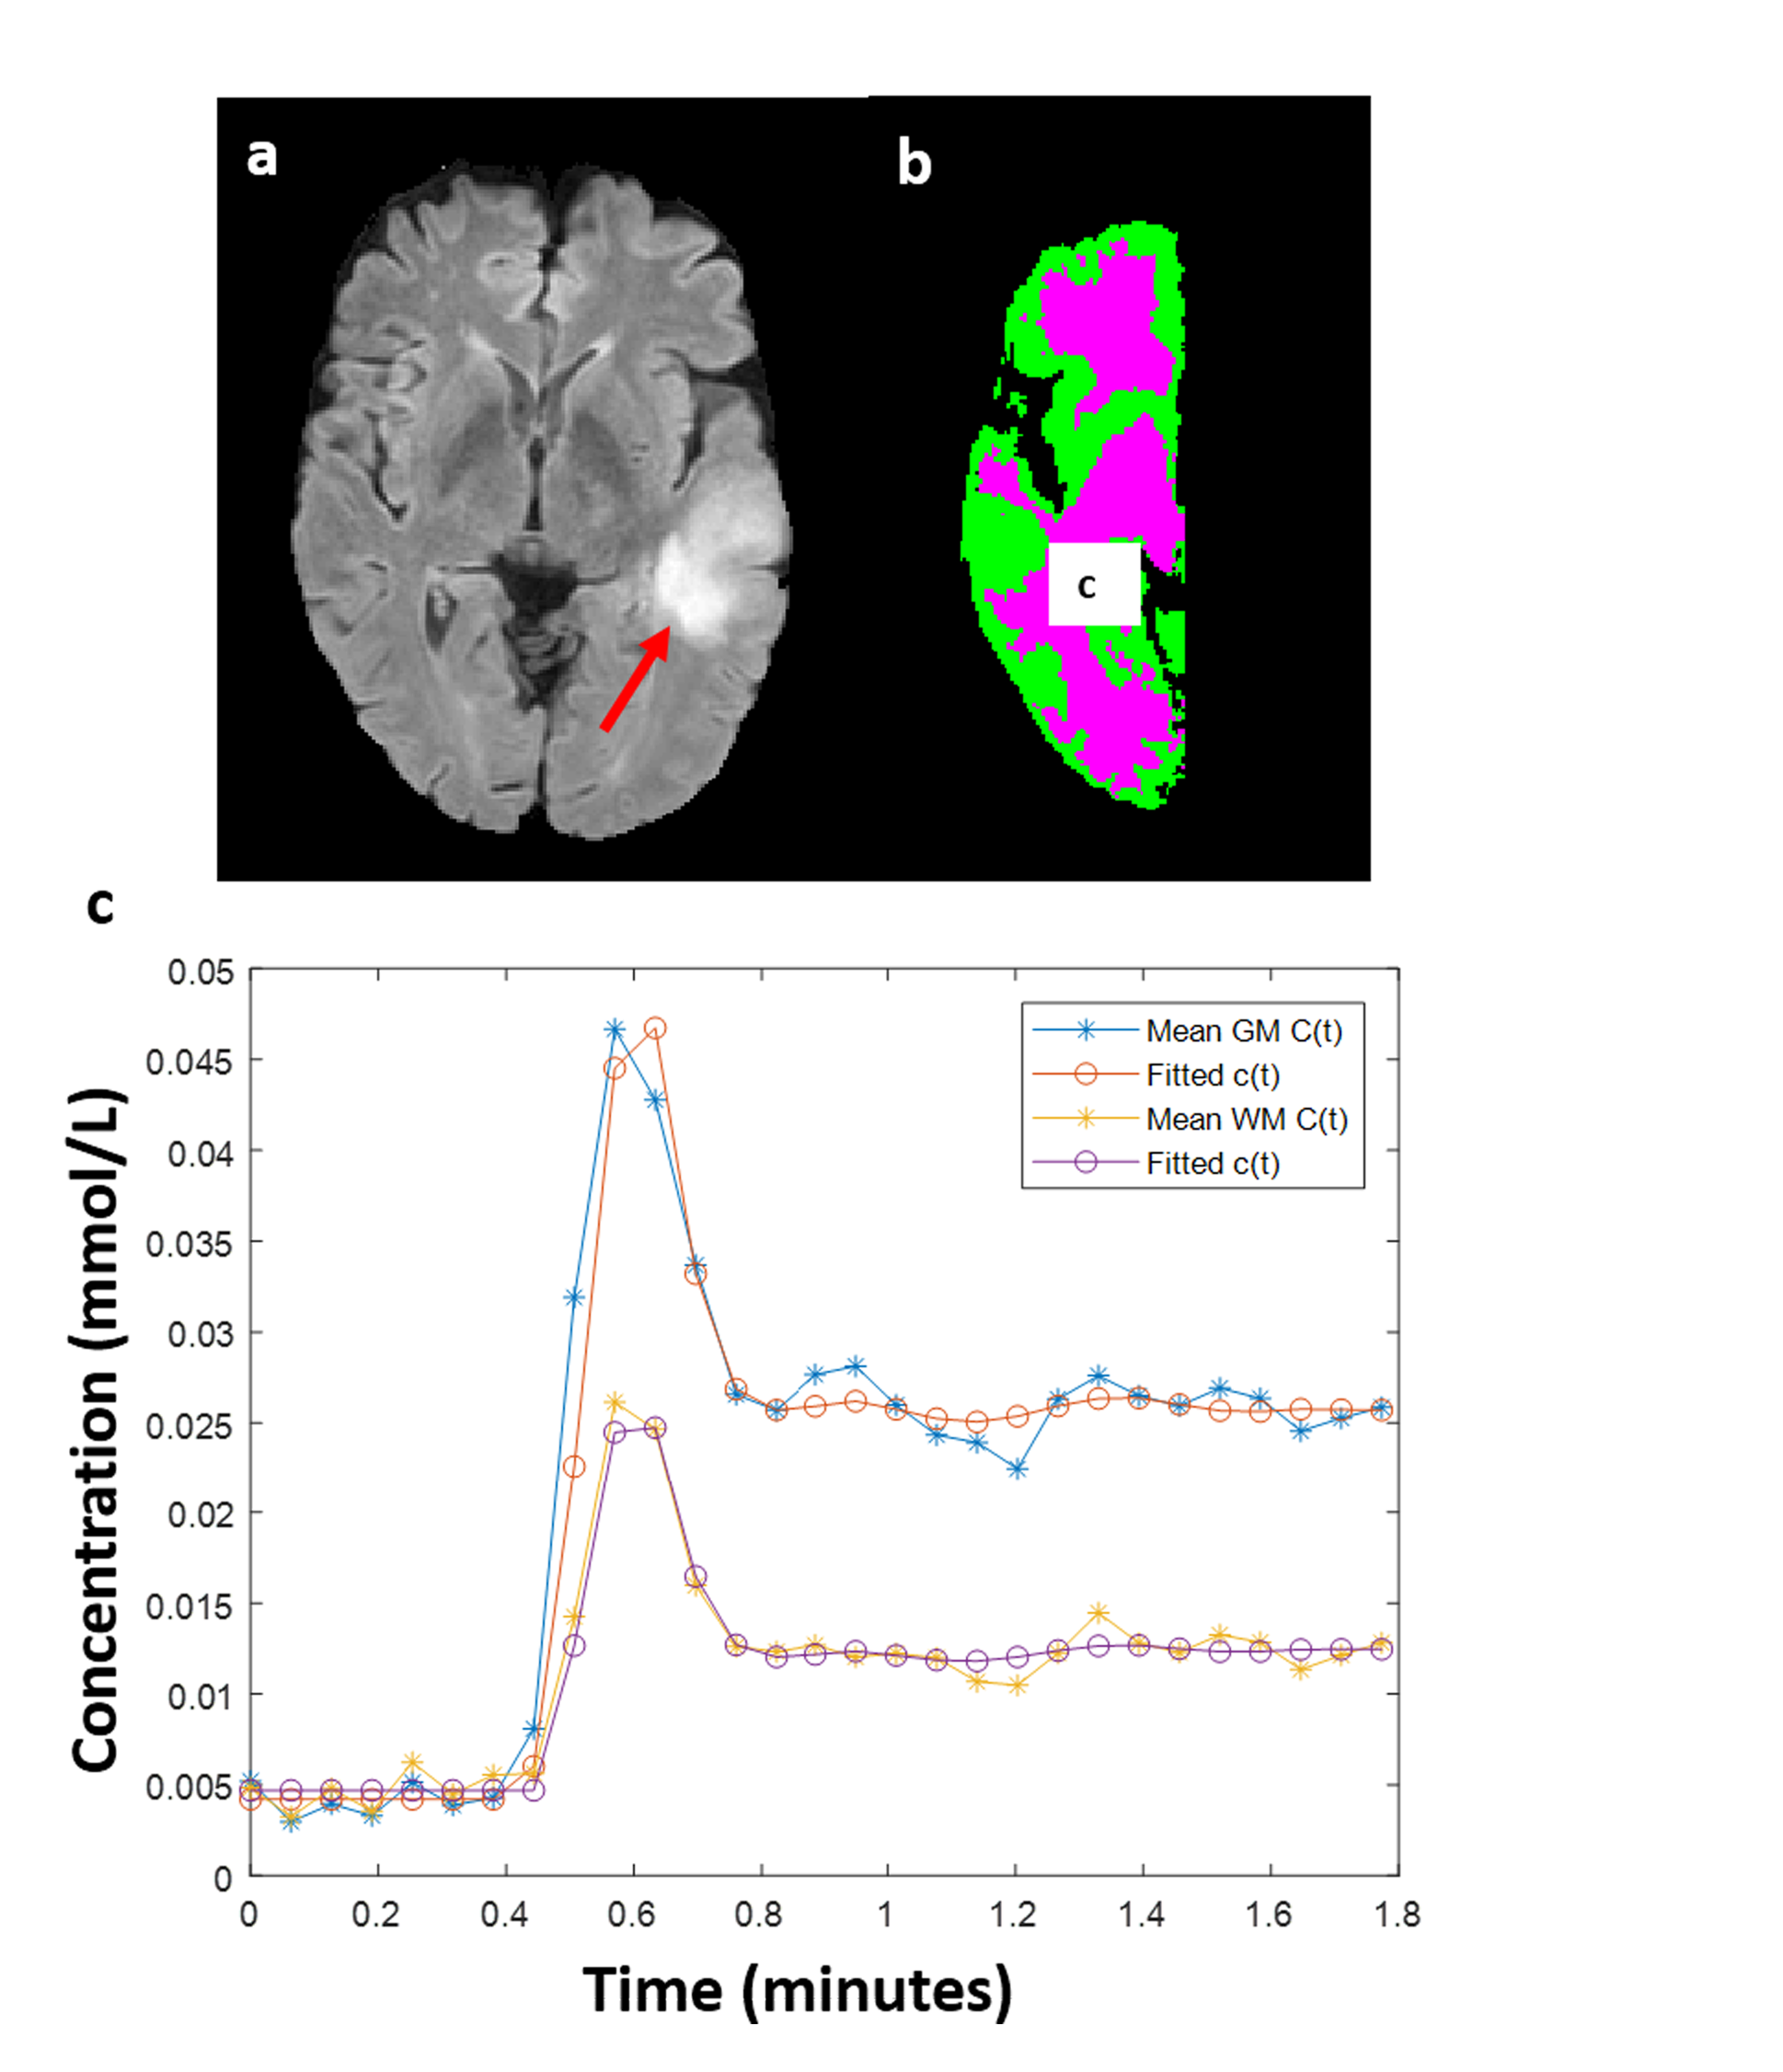
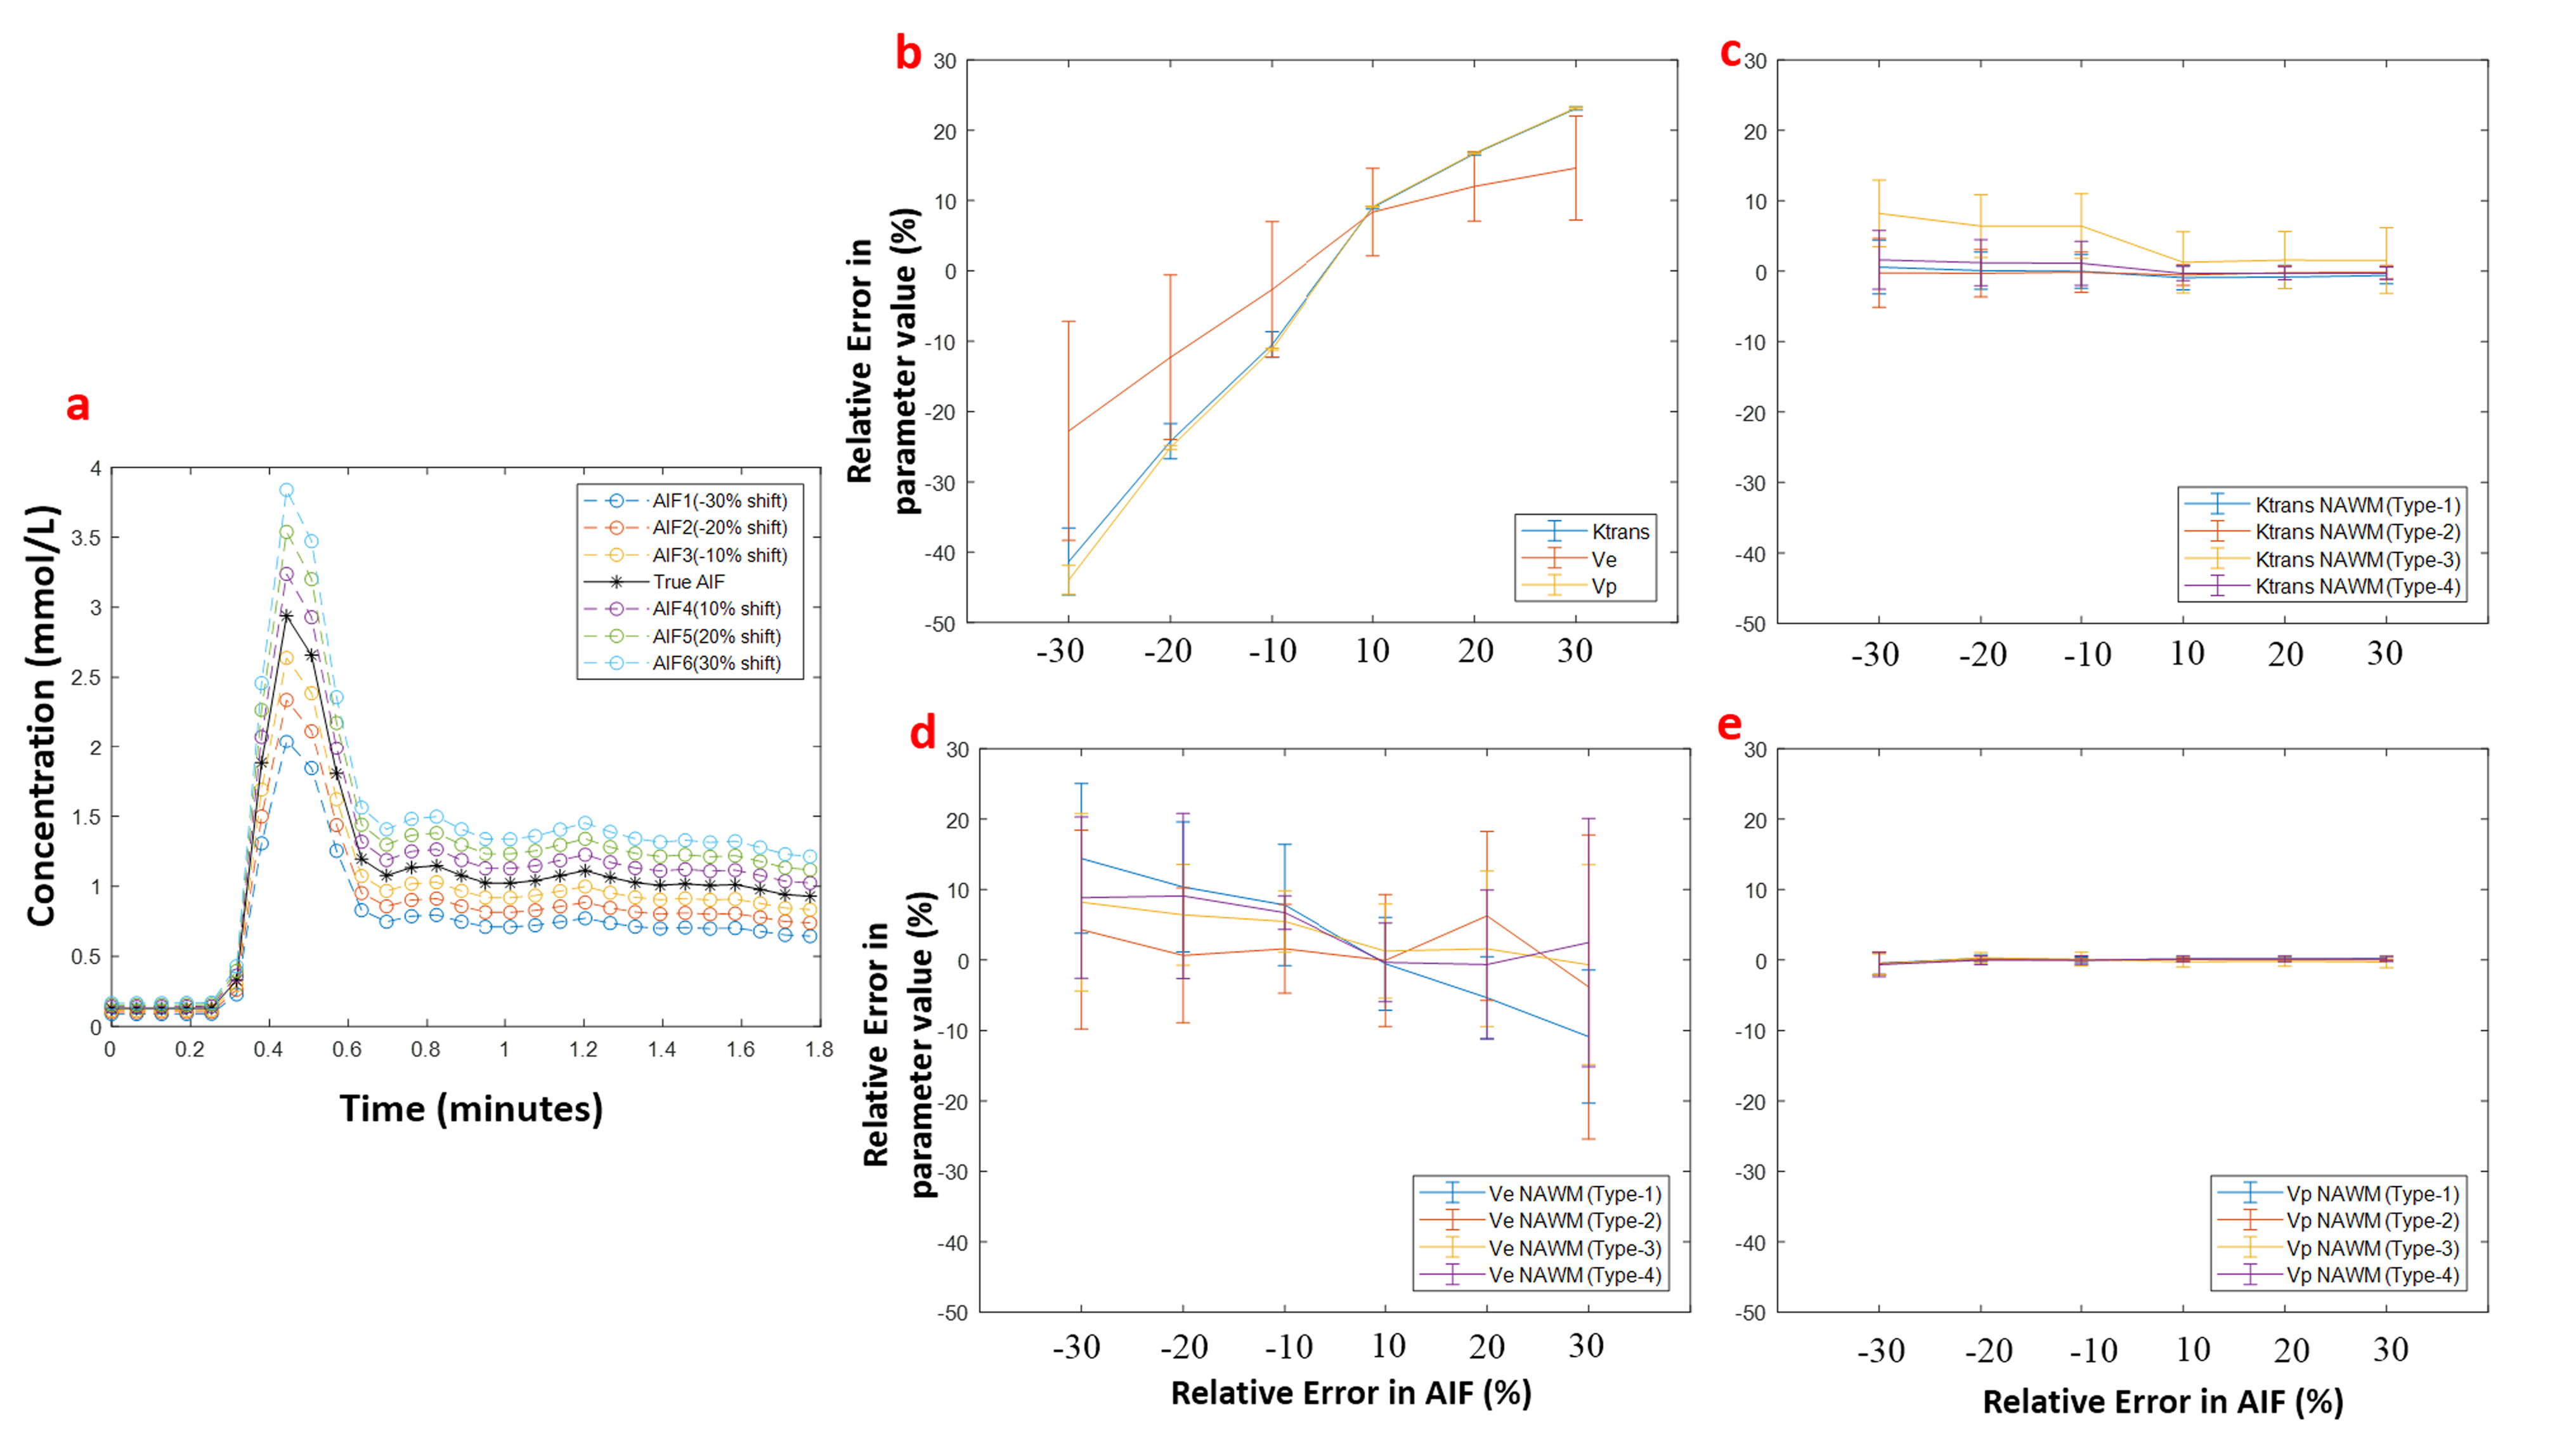
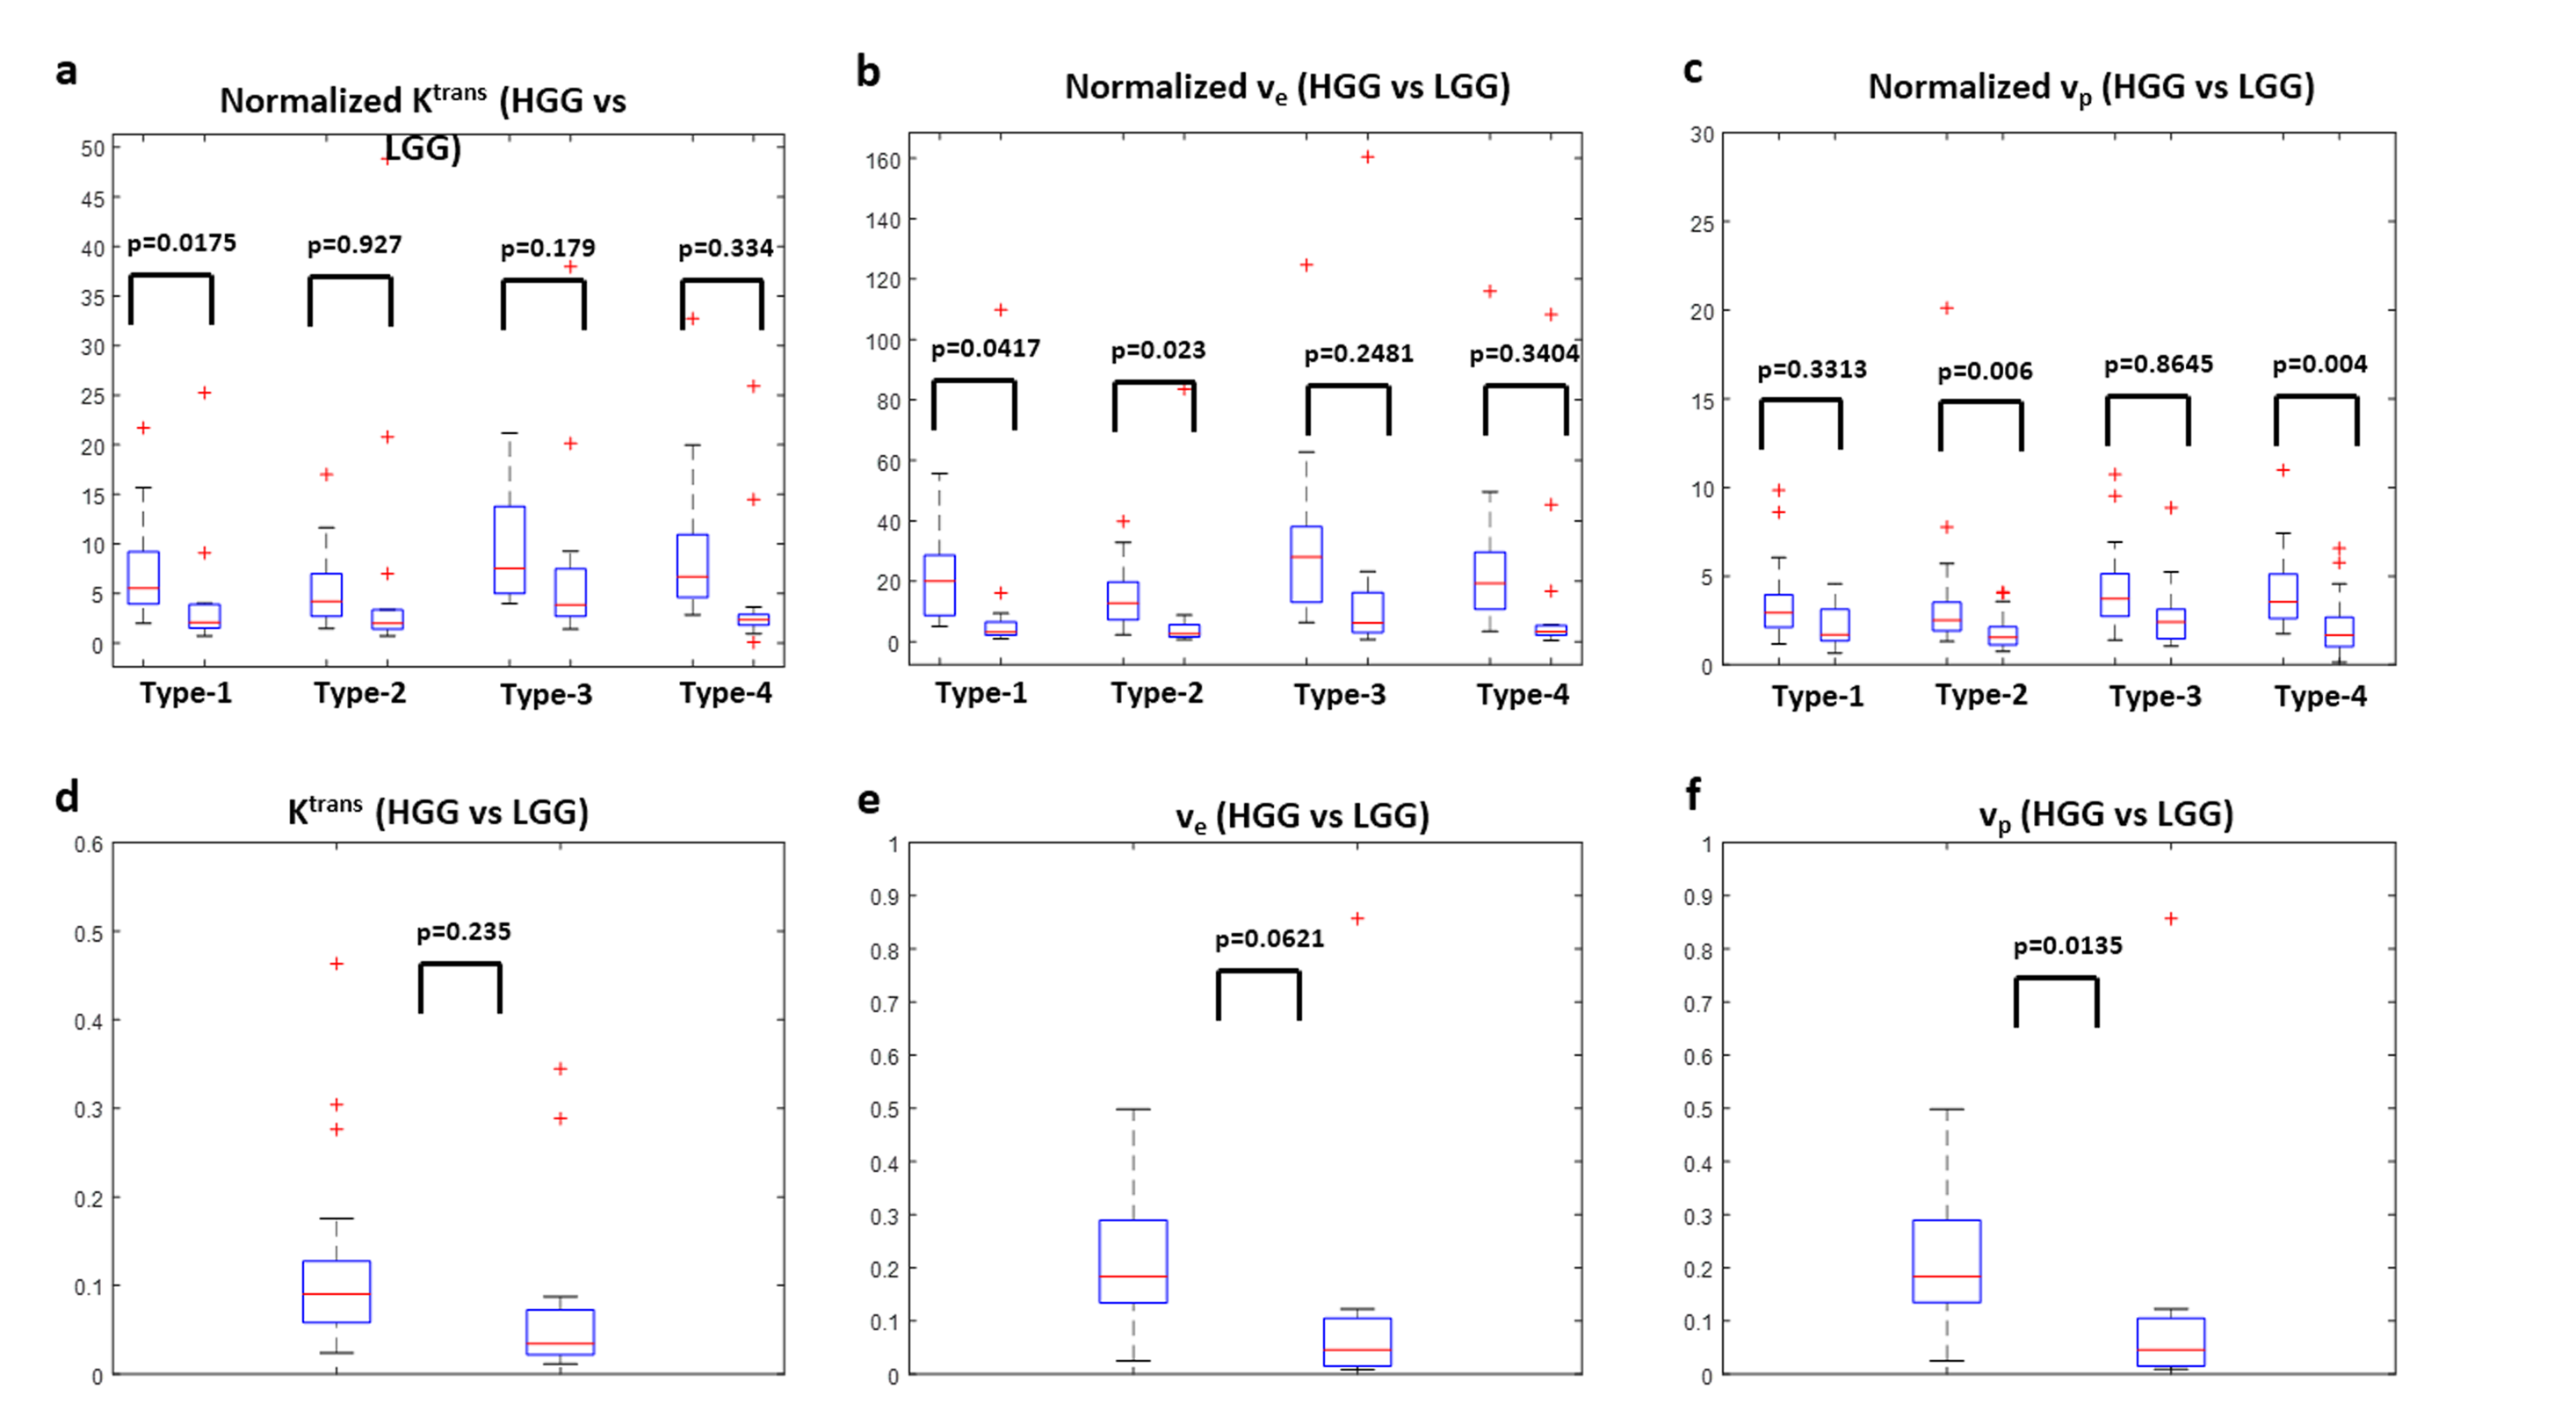
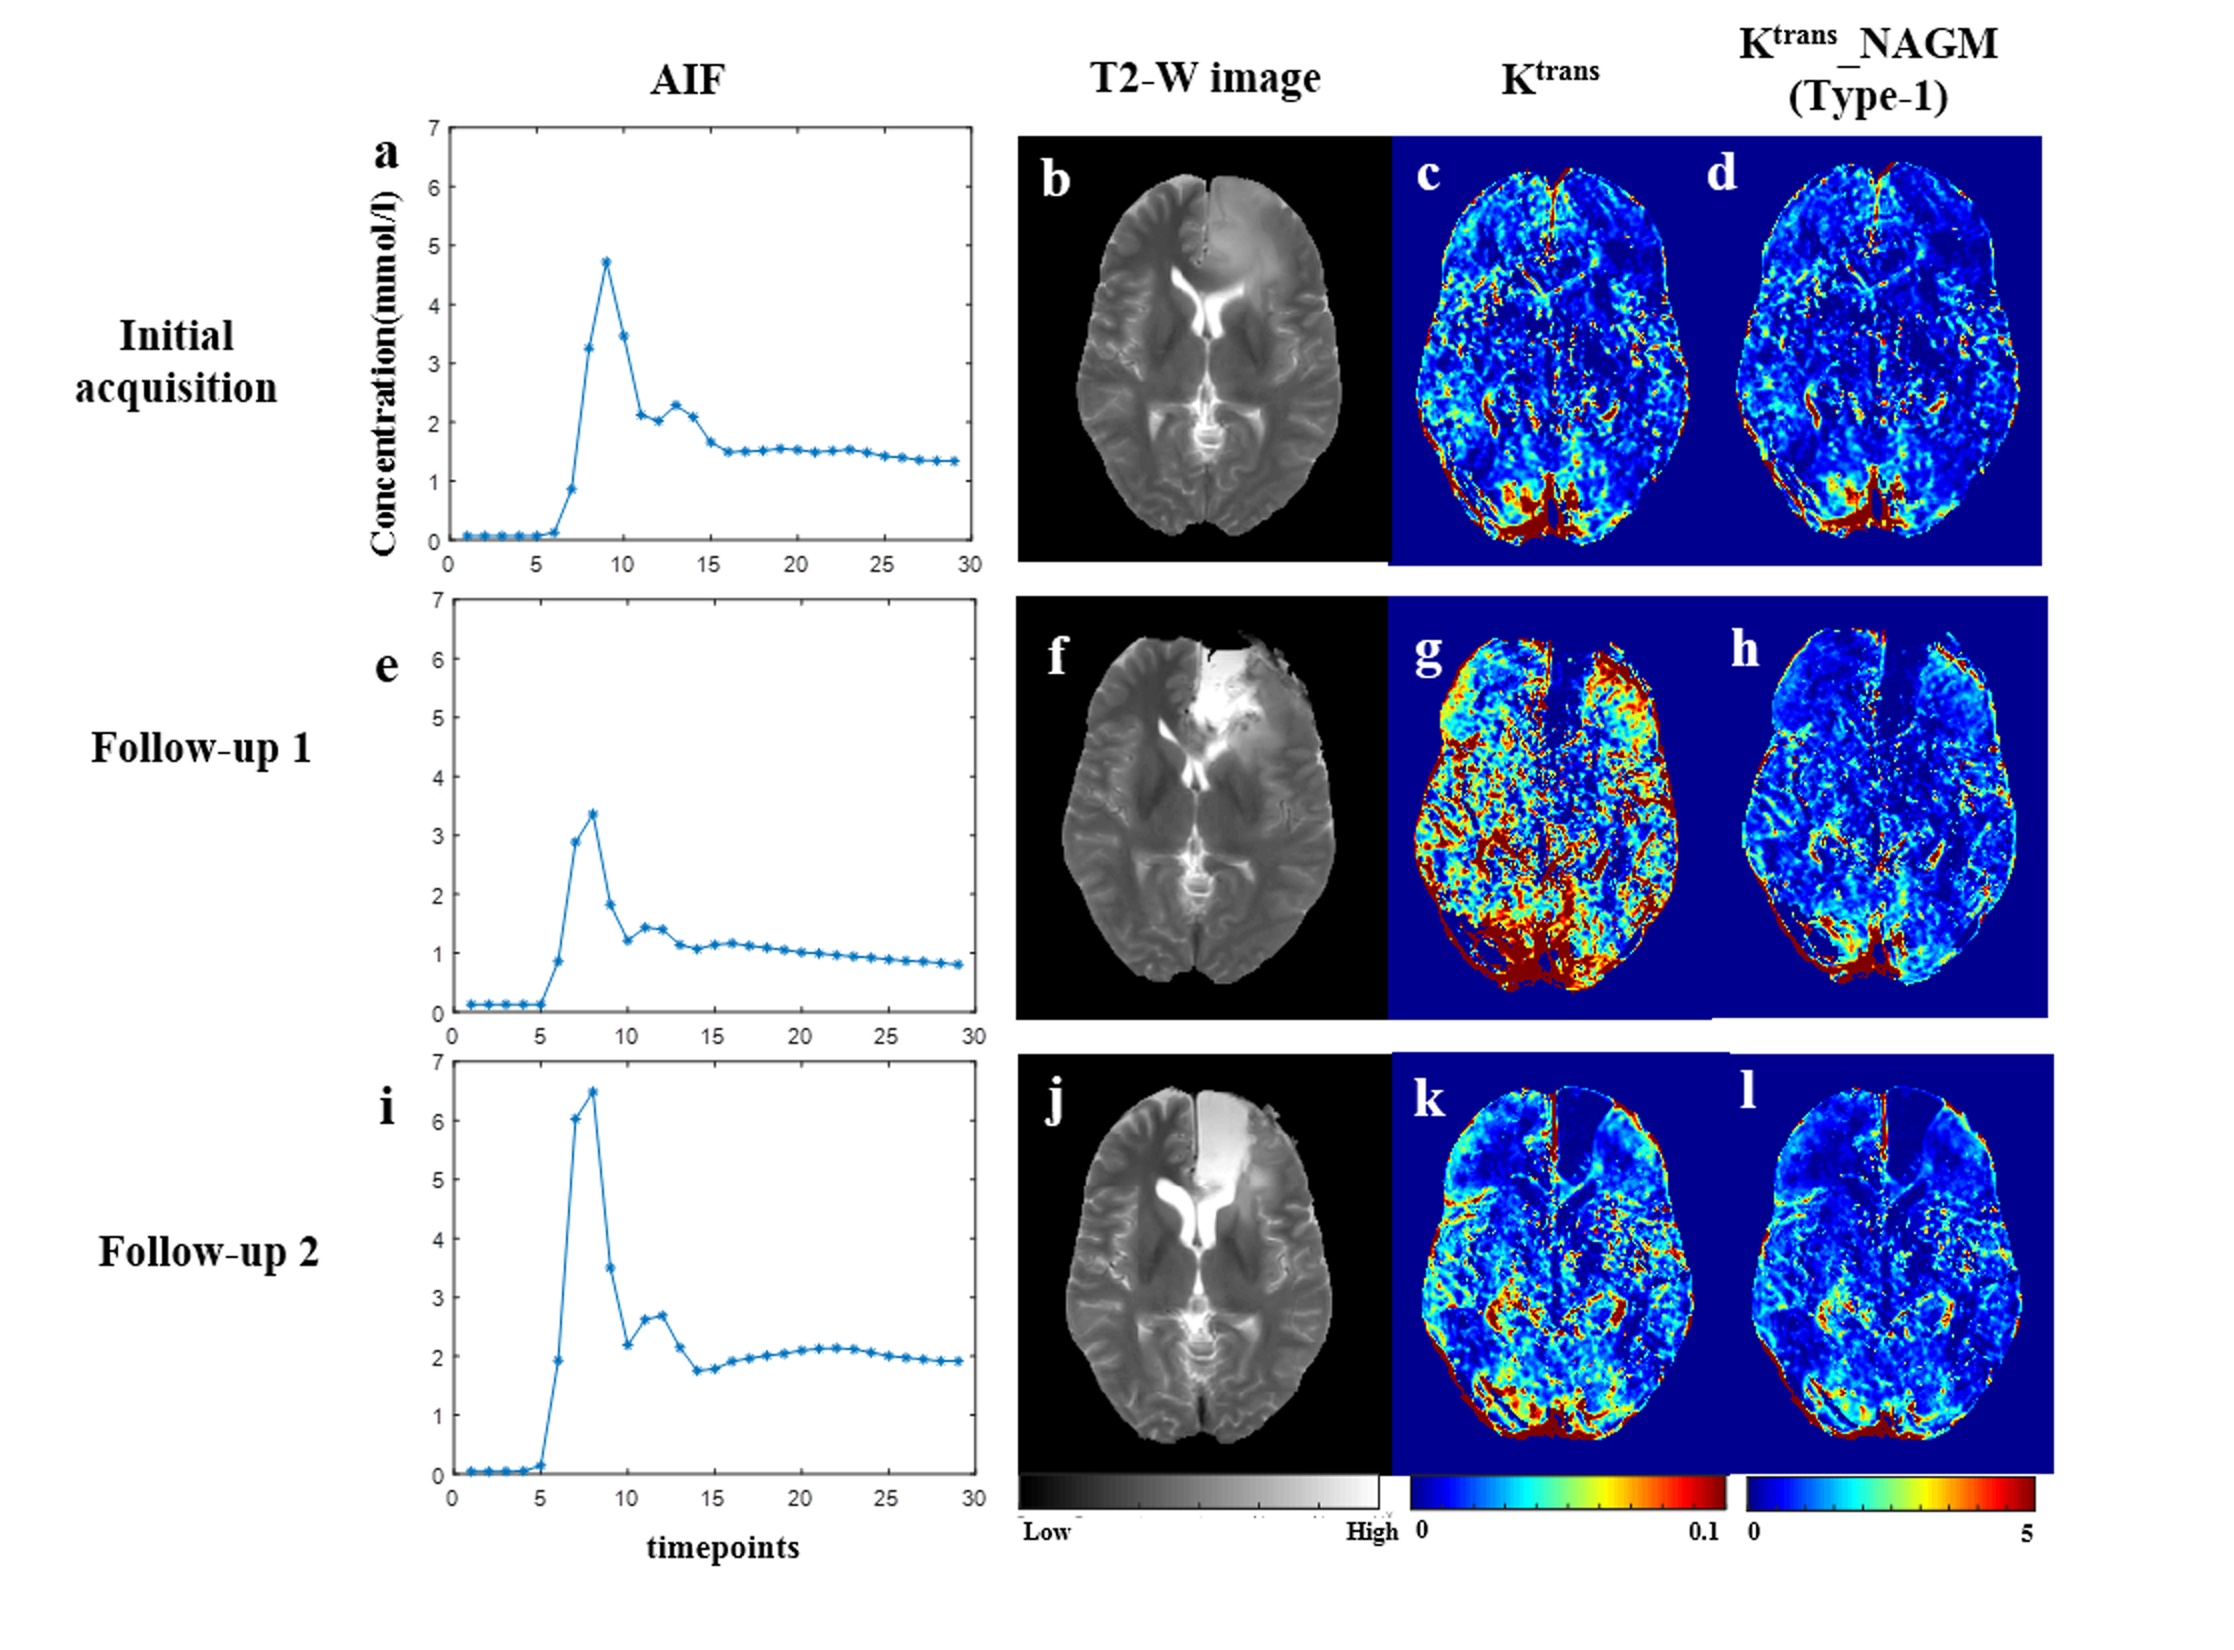
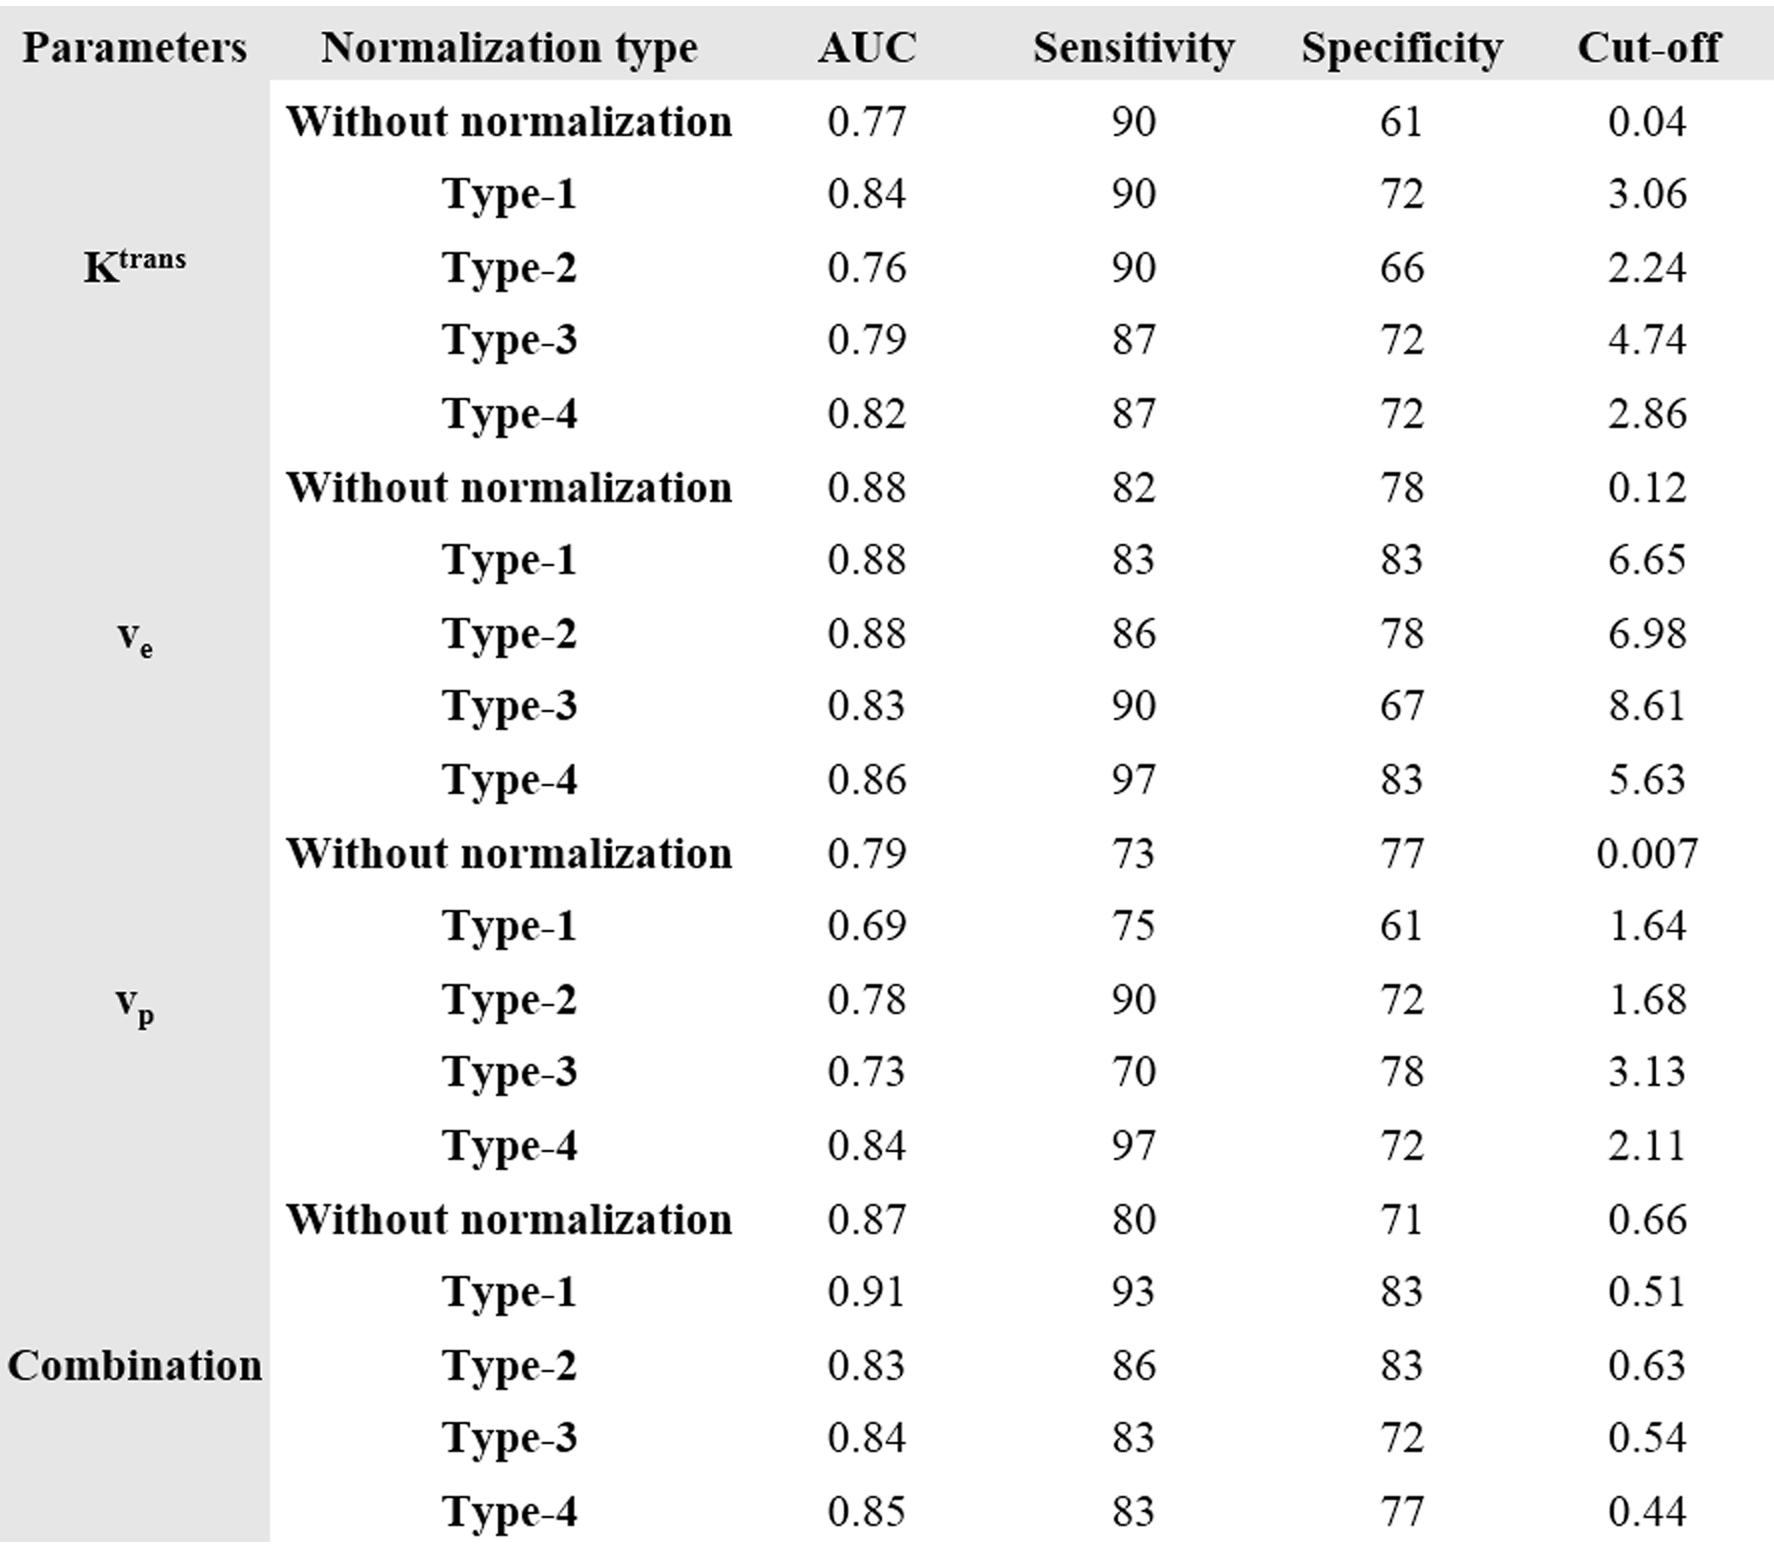
Figure-1 shows a representative FLAIR image, segmented GM and WM tissues, and their corresponding mean curves fitted to GTKM. These reference TKP were used to for Type-1 and Type-3 normalizations. While, mean values of the TKP in segmented GM and WM tissues in are used for Type-2 and Type-4 normalizations. Figure-2 show results of simulation study conducted on 6 subjects to evaluate change in TKP w.r.t AIF. At -30% variation, RPE in Ktrans and vp were -41±5 % and -44±2%, while 30% increase amplitude resulted in 23±0.22% and 23±0.14% respectively. All four normalization techniques have significantly reduced the variations in vp to less than ±1%. For Ktrans, Type-1 and Type-2 normalizations were found to relatively more stable to variations in AIF(RE<±1%). vp exhibited significant difference between grades before normalization(p=0.0135). After normalization, Type-1 normalization produced significant difference for stratification for Ktrans and ve(p=0.0175 and p=0.0417). Type-2 and Type-4 normalization performed better for vp(p=0.006 and p=0.004). Type-2 normalization performed better in grading using ve(p=0.023). Figure-3 and table-1 shows the Box-Whisker plot and results of ROC analysis. Around 9% improvement was observed in AUC with improved specificity for Ktrans after Type-1 normalization. Type-4 normalization has also provided substantial improvement in AUC(~6%). Even though Type-1 and Type-2 variations have minimized the intra-class and inter-class variations after normalizing ve, it is not accounted in improving the differentiation of glioma grades. However, Type-1 normalization has improved the sensitivity and specificity(table-1).More than 100% change in amplitude was observed across single subject in multiple follow-up data(figure-4). CoV(%) in Ktrans, ve and vp without normalization were 37.1±18.1,24.6±10 and 24.3±14.3 and, after Type-1 normalization, CoV reduced to 20.2±10.2,15.6±5.8 and 16.9±8.6 respectively.Limitations: This study included single centre data and same protocol. A test of proposed normalization techniques should be conducted on large mutli-center data set with different acquisition parameters such as acquisition time and temporal resolution.
Conclusion
Type-1 normalization has outperformed all other normalization techniques for Ktrans and ve and Type-4 normalization was found to be optimum for normalizing vp in quantitatively differentiating HGG and LGGAcknowledgements
The authors thank Dr. Mamta Gupta for data handling, Neha Vats, Manish Awasti and Virender Yadav for assistance in data processing.References
1. Singh, A. et al. Quantification of Physiological and Hemodynamic Indices Using T 1 Dynamic Contrast-Enhanced MRI in Intracranial Mass Lesions. 880, 871–880 (2007).
2. Sasi S, D. et al. Evaluating feasibility of high resolution T1-perfusion MRI with whole brain coverage using compressed SENSE: Application to glioma grading. Eur. J. Radiol. 129, (2020).
3. Zhao, M. et al. Quantitative analysis of permeability for glioma grading using dynamic contrast-enhanced magnetic resonance imaging. Oncol. Lett. 14, 5418–5426 (2017).
4. Kershaw, L. E. & Cheng, H. M. Temporal Resolution and SNR Requirements for Accurate DCE-MRI Data Analysis Using the AATH Model. 1780, 1772–1780 (2010).
5. Hadizadeh, D. R. et al. Effects of arterial input function selection on kinetic parameters in brain dynamic contrast-enhanced MRI. Magn. Reson. Imaging 40, 83–90 (2017).
6. Knutsson, L. et al. Reduction of arterial partial volume effects for improved absolute quantification of DSC-MRI perfusion estimates: Comparison between tail scaling and prebolus administration. J. Magn. Reson. Imaging 41, 903–908 (2015).
7. Singh, A. et al. Improved bolus arrival time and arterial input function estimation for tracer kinetic analysis in DCE-MRI. J. Magn. Reson. Imaging 29, 166–176 (2009).
8. Sahoo, P. et al. Diagnostic accuracy of automatic normalization of CBV in glioma grading using T1- weighted DCE-MRI. Magn. Reson. Imaging 44, 32–37 (2017).
Figures