1095
Differentiation Between Active Tumor and Radiation Necrosis in Patients with Glioblastoma Based on Model Free DCE Analysis1Sagol Brain Institute, Tel Aviv Sourasky Medical Center, Tel Aviv, Israel, 2The Iby and Aladar Fleischman Faculty of Engineering Tel Aviv University, Tel Aviv, Israel, 3Sackler Faculty of Medicine, Tel Aviv University, Tel Aviv, Israel, 4Sagol School of Neuroscience, Tel Aviv University, Tel Aviv, Israel, 5Division of Radiology, Tel Aviv Sourasky Medical Center, Tel Aviv, Israel, 6Division of Oncology, Tel Aviv Sourasky Medical Center, Tel Aviv, Israel, 7Neuro-Oncology Service, Tel Aviv Sourasky Medical Center, Tel Aviv, Israel
Synopsis
A DCE based method for differentiation between active tumor tissue and radiation necrosis in patients with Glioblastoma is proposed. The study included 31 MRI scans of patients with Glioblastoma (6 patients with 4 longitudinal scans and 7 scans with biopsy results). The system is comprised of automatic, feature based discrimination of DCE dynamic data based on population analysis. Differentiation results show correlation to theoretical DCE models, and agreement with biopsy results in in the majority of cases. RANO based assessment of the differentiated results demonstrate potential for early detection of tumor progression.
Introduction
Glioblastoma (GBM) is a highly malignant brain tumor, and the most lethal central nervous system tumor1. Treatment of GBM includes surgical intervention, radiotherapy, chemotherapy, biological treatment and other means2. Conventional MRI allows assessment of tumor response to treatment using the Response Assessment in Neuro-Oncology (RANO) criteria3, which relies heavily on measurement of changes in the enhancing lesion area. However differentiation between treatment-related changes, such as radiation necrosis and progressive disease in those patients remains a major clinical challenge due to their similar appearance on conventional MRI. Dynamic Contrast Enhanced (DCE) MRI measures T1 changes in tissues over time after bolus administration of gadolinium. Several studies have demonstrated the ability to distinguish between active tumor and necrotic tissue based on DCE based on pharmacokinetic models or model free analysis in animal models4-8, and humans9-11. However, no standardization exists, and these analyses are heavily dependent on the model used, the AIF selection and feature extracted. In this work we propose the use of population based time (artificial) time course, which can serve as a “template”, representing arteries, active tumor and necrotic tissue. Using this template, we longitudinally evaluated patients with GBM and compared the results to RANO criteria.Methods
Datasets: Included 31 MRI scans from patients with GBM, of them: 6 patients with longitudinal MRI data (4 time points scanned ~3 months apart), and 7 patients with one scan each. Scans were performed on a 3.0 Tesla MRI scanner (Siemens MAGNETOM Prisma) and included T1WI, T1WI+c and DCE sequences.Data Preprocessing: Included co-registration of the T1WI and DCE to the T1WI+c images at each time point, and co-registration of all time points to the first time point, bias field correction, brain extraction, and semi-automatic segmentation of enhancing lesion by ITK-SNAP12 validated by an expert neuro-radiologist.
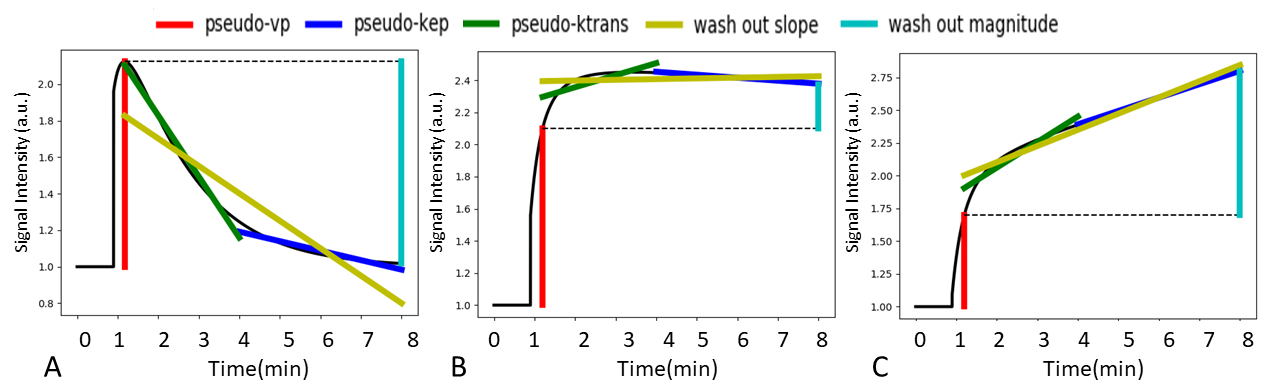
Generation of DCE population based time course: Based on theoretical DCE behavior as previously described in animal models4-8 artificial time courses were created, representing arteries, active tumor and necrotic tissue (Figure 1).
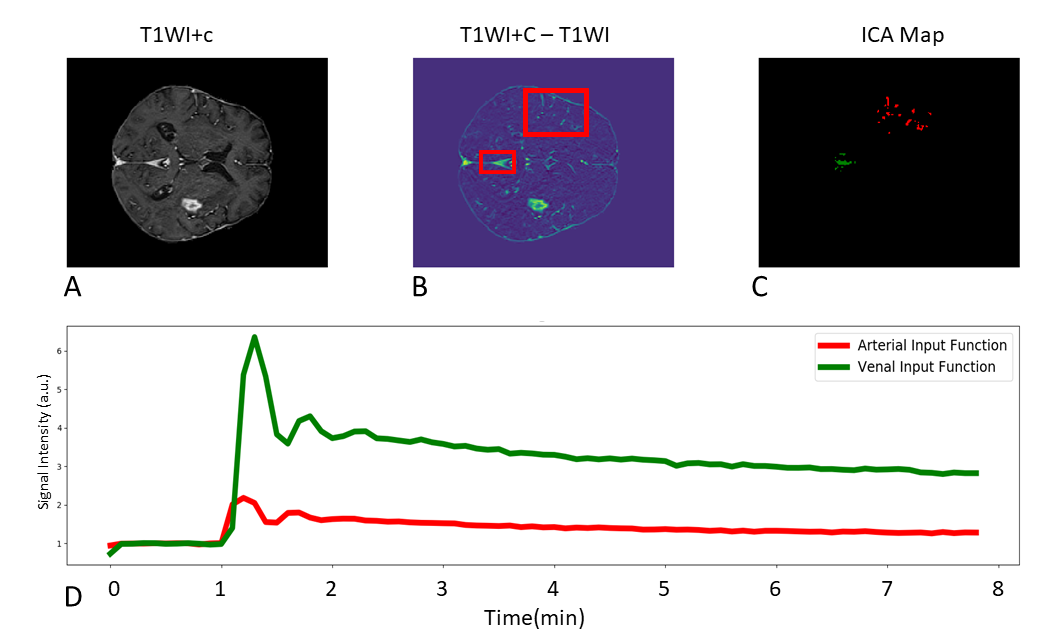
Arterial Input Function (AIF) extraction: A semi-automatic method to extract arterial AIF was used (Figure 2). Two ROIs were selected on a T1WI+c-T1WI subtraction map, an intensity threshold was used to select relevant voxels, then voxels were separated via independent component analysis (ICA) based separation. The proposed method automatically extracts arterial and venal input functions. This study used the AIF.
DCE parameter extraction from the enhancing lesion area: The following parameters were calculated based on the DCE time course: pseudo-kep, pseudo-ktrans, pseudo-vp, wash out magnitude and wash out slope (Figure 1). The pseudo-vp and wash out magnitude were normalized relative to the extracted AIF.
Classification of the enhanced lesion area: voxel based classification into necrotic (Nec) and active tumor (AT) was performed as following:
Population based cluster seeding: Based on theoretical behaviour, clusters were defined as: AT = voxels with high pseudo-vp and low / absent pseudo-kep, and Nec = low pseudo-vp and high pseudo-kep.
Voxel-wise classification: was performed for each scan by using the cluster seeds. Based on the extracted DCE parameters, following noise and AIF like voxel filtering, all voxels were classified to one of the two classes based on the Euclidean distance from each seed in the feature space. Each voxel was assigned a confidence score based on the inverse of that distance. Based on this score voxels were assigned to one of three classes: Nec, AT, and uncertainty.
Evaluation of the classification results was performed as following:
1. Correlation score relative to artificial population based time course: For each scan the AT and Nec voxels’ time course were correlated to the theoretical AT and Nec time courses.
2. Comparison to biopsy: Seven scans included post op biopsy results of the tumor mass. The differentiation results were compared to the biopsy report.
3. Longitudinal clinical evaluation: A RANO like assessment was made in two manners, volumetric measurement of changes: (1) in the entire enhancing volume, and (2) based only on the detected active tumor tissue.
Results
Correlation score relative to artificial population based time course: For the entire patient dataset, a correlation of 82% was achieved for the AT component, and 90% for the Nec component.Correlation with biopsy: Six biopsy results demonstrated active GBM, and one was radiation necrosis. Classification results were consistent with biopsy results in the majority of cases (5/7) while two cases demonstrated a mixed pattern of necrosis and active tumor.
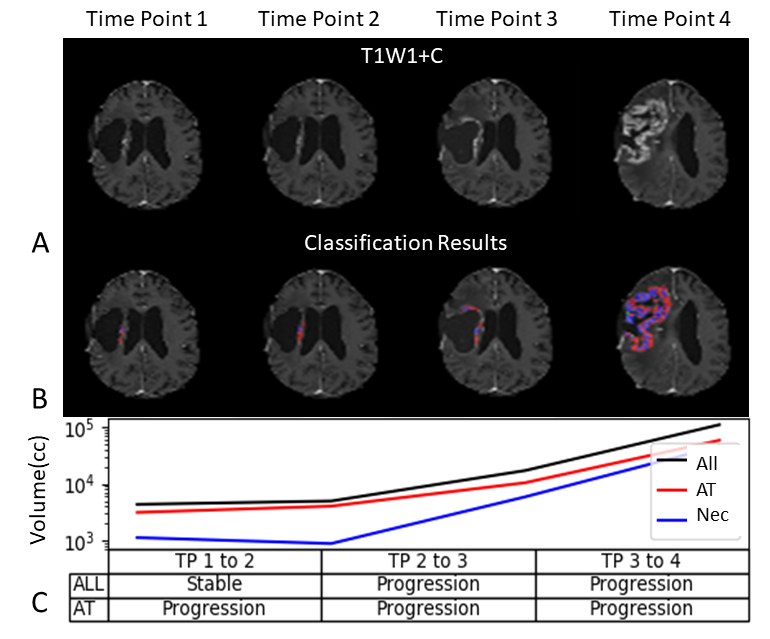
Clinical evaluation: Figure 3 shows longitudinal classification results in a patient with GBM over 4 scans, demonstrating changes in volume for the entire enhancing area as well as AT and NT segmented volumes. Note that between time points 1 and 2 the proposed method shows progression rather than a stable result. The method matched the overall progression pattern in this case and thereby demonstrating potential for early detection.
Conclusion
This study proposed the use of DCE MRI model free parameters for differentiation between active tumor and necrotic tissue. The method enables visualization and provides quantitative tool for therapy response assessment in patients with GBM. Preliminary results of using the method for longitudinal therapy response assessment demonstrated its potential for early identification of tumor progression as compared to conventional MRI.Acknowledgements
No acknowledgement found.References
1. Ahmed R, Oborski MJ, Hwang M, Lieberman FS, Mountz JM. Malignant gliomas: current perspectives in diagnosis, treatment, and early response assessment using advanced quantitative imaging methods. Cancer Manag Res. 2014 Mar 24;6:149-70. doi: 10.2147/CMAR.S54726. PMID: 24711712; PMCID: PMC3969256.
2. Omuro A, DeAngelis LM. Glioblastoma and Other Malignant Gliomas: A Clinical Review. JAMA. 2013;310(17):1842–1850. doi:10.1001/jama.2013.280319
3. P. Y. Wen et al., “Updated response assessment criteria for high-grade gliomas: Response assessment in neuro-oncology working group,” J. Clin. Oncol., vol. 28, pp. 1963–1972, 2010.
4. Kumar AJ, Leeds NE, Fuller GN, et al: Malignant gliomas: MR imaging spectrum of radiation therapy- and chemotherapy-induced necrosis of the brain after treatment. Radiology 217:377-384, 2000
5. Gordon Y, Partovi S, Müller-Eschner M, et al. Dynamic contrast-enhanced magnetic resonance imaging: fundamentals and application to the evaluation of the peripheral perfusion. Cardiovasc Diagn Ther. 2014;4(2):147-164. doi:10.3978/j.issn.2223-3652.2014.03.01
6. Stoyanova R, Huang K, Sandler K, et al. Mapping Tumor Hypoxia In Vivo Using Pattern Recognition of Dynamic Contrast-enhanced MRI Data. Transl Oncol. 2012;5(6):437-447. doi:10.1593/tlo.12319
7. Barnes SL, Whisenant JG, Loveless ME, Yankeelov TE. Practical Dynamic Contrast Enhanced MRI in Small Animal Models of Cancer: Data Acquisition, Data Analysis, and Interpretation. Pharmaceutics. 2012; 4(3):442-478.
8. J. Deng and Y. Wang, “Quantitative magnetic resonance imaging biomarkers in oncological clinical trials: Current techniques and standardization challenges.,” Chronic diseases and translational medicine, vol. 3, pp. 8–20, Mar 2017.
9. Artzi M, Liberman G, Nadav G, Blumenthal DT, Bokstein F, Aizenstein O, Ben Bashat D. Differentiation between treatment-related changes and progressive disease in patients with high grade brain tumors using support vector machine classification based on DCE MRI. J Neurooncol. 2016 May;127(3):515-24. doi: 10.1007/s11060-016-2055-7. Epub 2016 Jan 11. PMID: 26754857.
10. Artzi M, Blumenthal DT, Bokstein F, Nadav G, Liberman G, Aizenstein O, Ben Bashat D. Classification of tumor area using combined DCE and DSC MRI in patients with glioblastoma. J Neurooncol. 2015 Jan;121(2):349-57. doi: 10.1007/s11060-014-1639-3. Epub 2014 Nov 5. PMID: 25370705.
11. J.D. Hamilton, J. Lin, C. Ison, N.E. Leeds, E.F. Jackson, G.N. Fuller, L. Ketonen and A.J. Kumar Dynamic Contrast-Enhanced Perfusion Processing for Neuroradiologists: Model-Dependent Analysis May Not Be Necessary for Determining Recurrent High-Grade Glioma versus Treatment Effect American Journal of Neuroradiology April 2015, 36 (4) 686-693; DOI: https://doi.org/10.3174/ajnr.A4190
12. Paul A. Yushkevich, Joseph Piven, Heather Cody Hazlett, Rachel Gimpel Smith, Sean Ho, James C. Gee, and Guido Gerig. User-guided 3D active contour segmentation of anatomical structures: Significantly improved efficiency and reliability. Neuroimage 2006 Jul 1;31(3):1116-28.
Figures