1092
Diffusion-filtered exchange measurements of blood-brain barrier permeability to water
Elizabeth Powell1, Marco Battiston2, and Geoff JM Parker1,3,4
1Centre for Medical Image Computing, Department of Computer Science, University College London, London, United Kingdom, 2Queen Square MS Centre, Department of Neuroinflammation, UCL Queen Square Institute of Neurology, Faculty of Brain Sciences, University College London, London, United Kingdom, 3Department of Neuroinflammation, Queen Square Institute of Neurology, University College London, London, United Kingdom, 4Bioxydyn Limited, London, United Kingdom
1Centre for Medical Image Computing, Department of Computer Science, University College London, London, United Kingdom, 2Queen Square MS Centre, Department of Neuroinflammation, UCL Queen Square Institute of Neurology, Faculty of Brain Sciences, University College London, London, United Kingdom, 3Department of Neuroinflammation, Queen Square Institute of Neurology, University College London, London, United Kingdom, 4Bioxydyn Limited, London, United Kingdom
Synopsis
We propose a method for quantifying water exchange across the blood-brain barrier (BBB) using diffusion-filtered exchange imaging. Careful design of the diffusion filter mitigates confounding effects from in-flowing blood water spins, and use of a two-compartment model aims to avoid known biases in the apparent exchange rate approximation. Using this approach, we optimise an acquisition protocol to provide maximum sensitivity to BBB water exchange and estimate the expected accuracy and precision of the method using simulations. The technique is then validated in a human volunteer.
Introduction
The blood-brain barrier (BBB) plays an important role in maintaining normal brain function by regulating the passage of molecules into and out of the brain. Disruption to the BBB is indicated in a majority of neurodegenerative diseases, as well as in stroke, MS, epilepsy and ageing1-3. Detecting subtle BBB breakdown is therefore important for better understanding the manifestation and progression of a wide range of pathologies. Recently, water exchange measurements across the BBB have shown greater sensitivity to subtle damage than conventional approaches using gadolinium-based contrast agents (GBCA)1.We present here the theory and optimisation of a diffusion-filtered exchange imaging (FEXI)4-6 method for measuring BBB permeability to water (coined BBB-FEXI). We propose using a two-compartment model to avoid biases associated with the apparent exchange rate approximation (AXR)5,7 and a non-selective diffusion filter to mitigate confounding effects from in-flowing unfiltered blood water spins. For this new approach, we optimise an acquisition protocol for maximum sensitivity to BBB water exchange and use simulations to provide an indication of the expected accuracy and precision of measurements. The method is then demonstrated in a healthy volunteer.
Theory
Tissue microstructure is modelled as a two-compartment system representing intra- and extravascular tissue properties (Fig. 1a); key parameters are the intra- and extravascular diffusivities Di,e, intravascular blood volume fraction fieq and exchange rate k. The diffusion filter suppresses the signal from fast-dephasing intravascular spins, which recovers via exchange from the extravascular space during the mixing time. Varying the diffusion weighting in the filter and encoding blocks, bf and b, and the mixing time, tm, allows the contribution of each compartment to be separated. The signal at readout is4:$$S\left(b_f,b,t_m\right)=S_f\left(f_{e}\left(t_m\right)e^{-bD_{e}}+f_{i}\left(t_m\right)e^{-bD_{i}}\right),$$
where the volume fractions fi,e(tm) have been modulated by exchange during tm as4
$$f_{i,e}\left(t_m\right)=f_{i,e}^{eq}+\left(f_{i,e}^0-f_{i,e}^{eq}\right)e^{-kt_m}$$
and Sf is the signal at b=0s/mm2. Volume fractions at equilibrium and after perturbation by the filter block are denoted feq and f0 respectively.
Methods
Sequence optimisation was performed using D-optimal design8 principles for two systems with different gradient characteristics (G=62mT/m and G=300mT/m, giving D-opt62 and D-opt300 protocols). A heuristic, manually-adapted design was constructed based on published protocols4,7 for comparison (Table 1).For each protocol, simulations were performed using a range of tissue parameters (Fig. 1c) to: (i) assess the accuracy and precision of k estimates as a function of underlying ground truth k and fieq; (ii) evaluate the impact of gradient characteristics and optimised protocols, and; (iii) infer SNR requirements for measuring k. For each experiment, 1500 signals with added zero-mean Gaussian noise were generated and the model in Eqs. 1-2 fitted using 25 initialisations. Noise was defined based on the b=0s/mm2 signal at TE=82ms.
Proof-of-concept data from a healthy volunteer (male, 24 years) were acquired on a 3T Philips Ingenia CX system (G=62mT/m) with the D-opt62 protocol (Table 1) using an in-house implementation of the FEXI sequence with a non-selective diffusion filter, EPI readout, 3×3mm2 in-plane resolution, 1 slice with thickness 3mm, TEf/TE/TR=38.9/66/5000ms and 3 orthogonal diffusion gradient directions. Scan time was ∼16min.
Results
Table 1 presents the optimised protocols. For nearly all k and fieq combinations, simulations showed that the D-optimal protocol outperformed the manually-adapted protocol (Fig. 2). Fig. 2 also shows that estimates of k were highly influenced by underlying ground truth parameters at SNR=25: k was overestimated at low k and underestimated at high k, while precision increased with higher k and fieq. Accuracy and precision were generally improved using D-opt300 over D-opt62 protocols.Fig. 3 demonstrates that biases observed in k at low SNR (Fig. 2) were mitigated at higher SNR.
In vivo data is shown in Fig. 4 (SNR∼30). A number of fit failures (fitted values within 1% of bounds) were apparent in the parameter maps; however, mean estimates across the whole brain were in line with literature values9-11, with De=0.9μm2/ms, Di=12.7μm2/ms, fieq=0.04 and k=3.8s-1.
Discussion
This work demonstrates the feasibility of a new approach to water exchange measurements that utilises a non-selective diffusion filter to avoid blood flow effects and a two-compartment model to reduce known biases in the AXR5 approximation. We present an optimised BBB-FEXI protocol that enabled more accurate and precise estimation of model parameters than a manually-adapted protocol, and showed using simulations that the method could provide unbiased estimates of k if SNR requirements were fulfilled.At clinical SNR levels (SNR∼25), simulations predicted an over-estimation in k of ∼35% in the healthy brain (reported mean value across studies kref=2.7s−1 12). In vivo measurements were similarly overestimated, with a globally-averaged k approximately 40% higher than kref. Utilising SNR benefits associated with shorter TEs in systems with enhanced gradient characteristics, e.g. via the D-opt300 protocol, could reduce this bias to 17%, as well as improve precision and reduce the number of fit failures.
Future work will aim to extend this biophysical model, considering factors such as T1 relaxation during the mixing time and exchange between cellular compartments.
Conclusions
New imaging techniques and biophysical models are needed to help address the low SNR and poor reproducibility of current methods for BBB water exchange. We propose a method that addresses some of the biases in previous approaches7, and demonstrate proof-of-concept in vivo with estimates of k in line with published values12.Acknowledgements
Thanks to Dr Damien McHugh for help and advice on D-optimal designs, to Dr Laura Parkes and Dr Ben Dickie for useful discussions, and to Dr David Higgins for Philips MR Clinical Science support. Thanks to the UK MS Society and the UCL-UCLH Biomedical Research Centre for ongoing support. This work was supported by EPSRC grant number EP/S031510/1; MB was supported by the UK Multiple Sclerosis Society grant number 77/2017.References
- Dickie BR, Vandesquille M, Ulloa J, et al. Water-exchange MRI detects subtle blood-brain barrier breakdown in Alzheimer’s disease rats. NeuroImage. 2019;184:349–358.
- Kim YR, Tejima E, Huang S, et al. In vivo quantification of transvascular water exchange during the acute phase of permanent stroke. Magn Reson Med. 2008;60(4):813–821.
- Sweeney MD, Sagare AP and Zlokovic BV. Blood–brain barrier breakdown in Alzheimer disease and other neurodegenerative disorders. Nat Rev Neurol. 2018;14(3):133–150.
- Aslund I, Nowacka A, Nilsson M, et al. Filter-exchange PGSE NMR determination of cell membrane permeability. J Magn Reson. 2009;200(2):291–295.
- Lasic S, Nilsson M, Latt J, et al. Apparent exchange rate mapping with diffusion MRI. Magn Reson Med. 2011;66(2):356–365.
- Nilsson M, Latt J, Van Westen D, et al. Noninvasive mapping of water diffusional exchange in the human brain using filter-exchange imaging. Magn Reson Med. 2013;69(6):1573–1581.
- Bai R, Li Z, Sun C, et al. Feasibility of filter-exchange imaging (FEXI) in measuring different exchange processes in human brain. NeuroImage. 2020.
- McHugh DJ, Hubbard Cristinacce PL, Naish JH, et al. Towards a ‘resolution limit’ for DW-MRI tumor microstructural models: a simulation study investigating the feasibility of distinguishing between microstructural changes. Magn Reson Med. 2019;81(4):2288–2301.
- Vos SB, Jones DK, Jeurissen B, et al. The influence of complex white matter architecture on the mean diffusivity in diffusion tensor MRI of the human brain. NeuroImage. 2012;59(3):2208–2216.
- Perrone D, Aelterman J, Pizurica A, et al. The effect of Gibbs ringing artifacts on measures derived from diffusion MRI. NeuroImage. 2015;120:441–455.
- Le Bihan D. What can we see with IVIM MRI? NeuroImage. 2018:1–12.
- Dickie BR, Parker GJM and Parkes LM. Measuring water exchange across the blood-brain barrier using MRI. Prog Nucl Magn Reson Spectrosc. 2019;116:19-39.
Figures

Figure 1. Signal model and pulse diagram. (a). Tissue microstructure is modelled using intra- and extravascular compartments, with diffusivities Di,e, volume fractions fi,eeq and exchange rate k. (b). The double-diffusion encoded FEXI sequence. (c). Parameter values used in simulations.
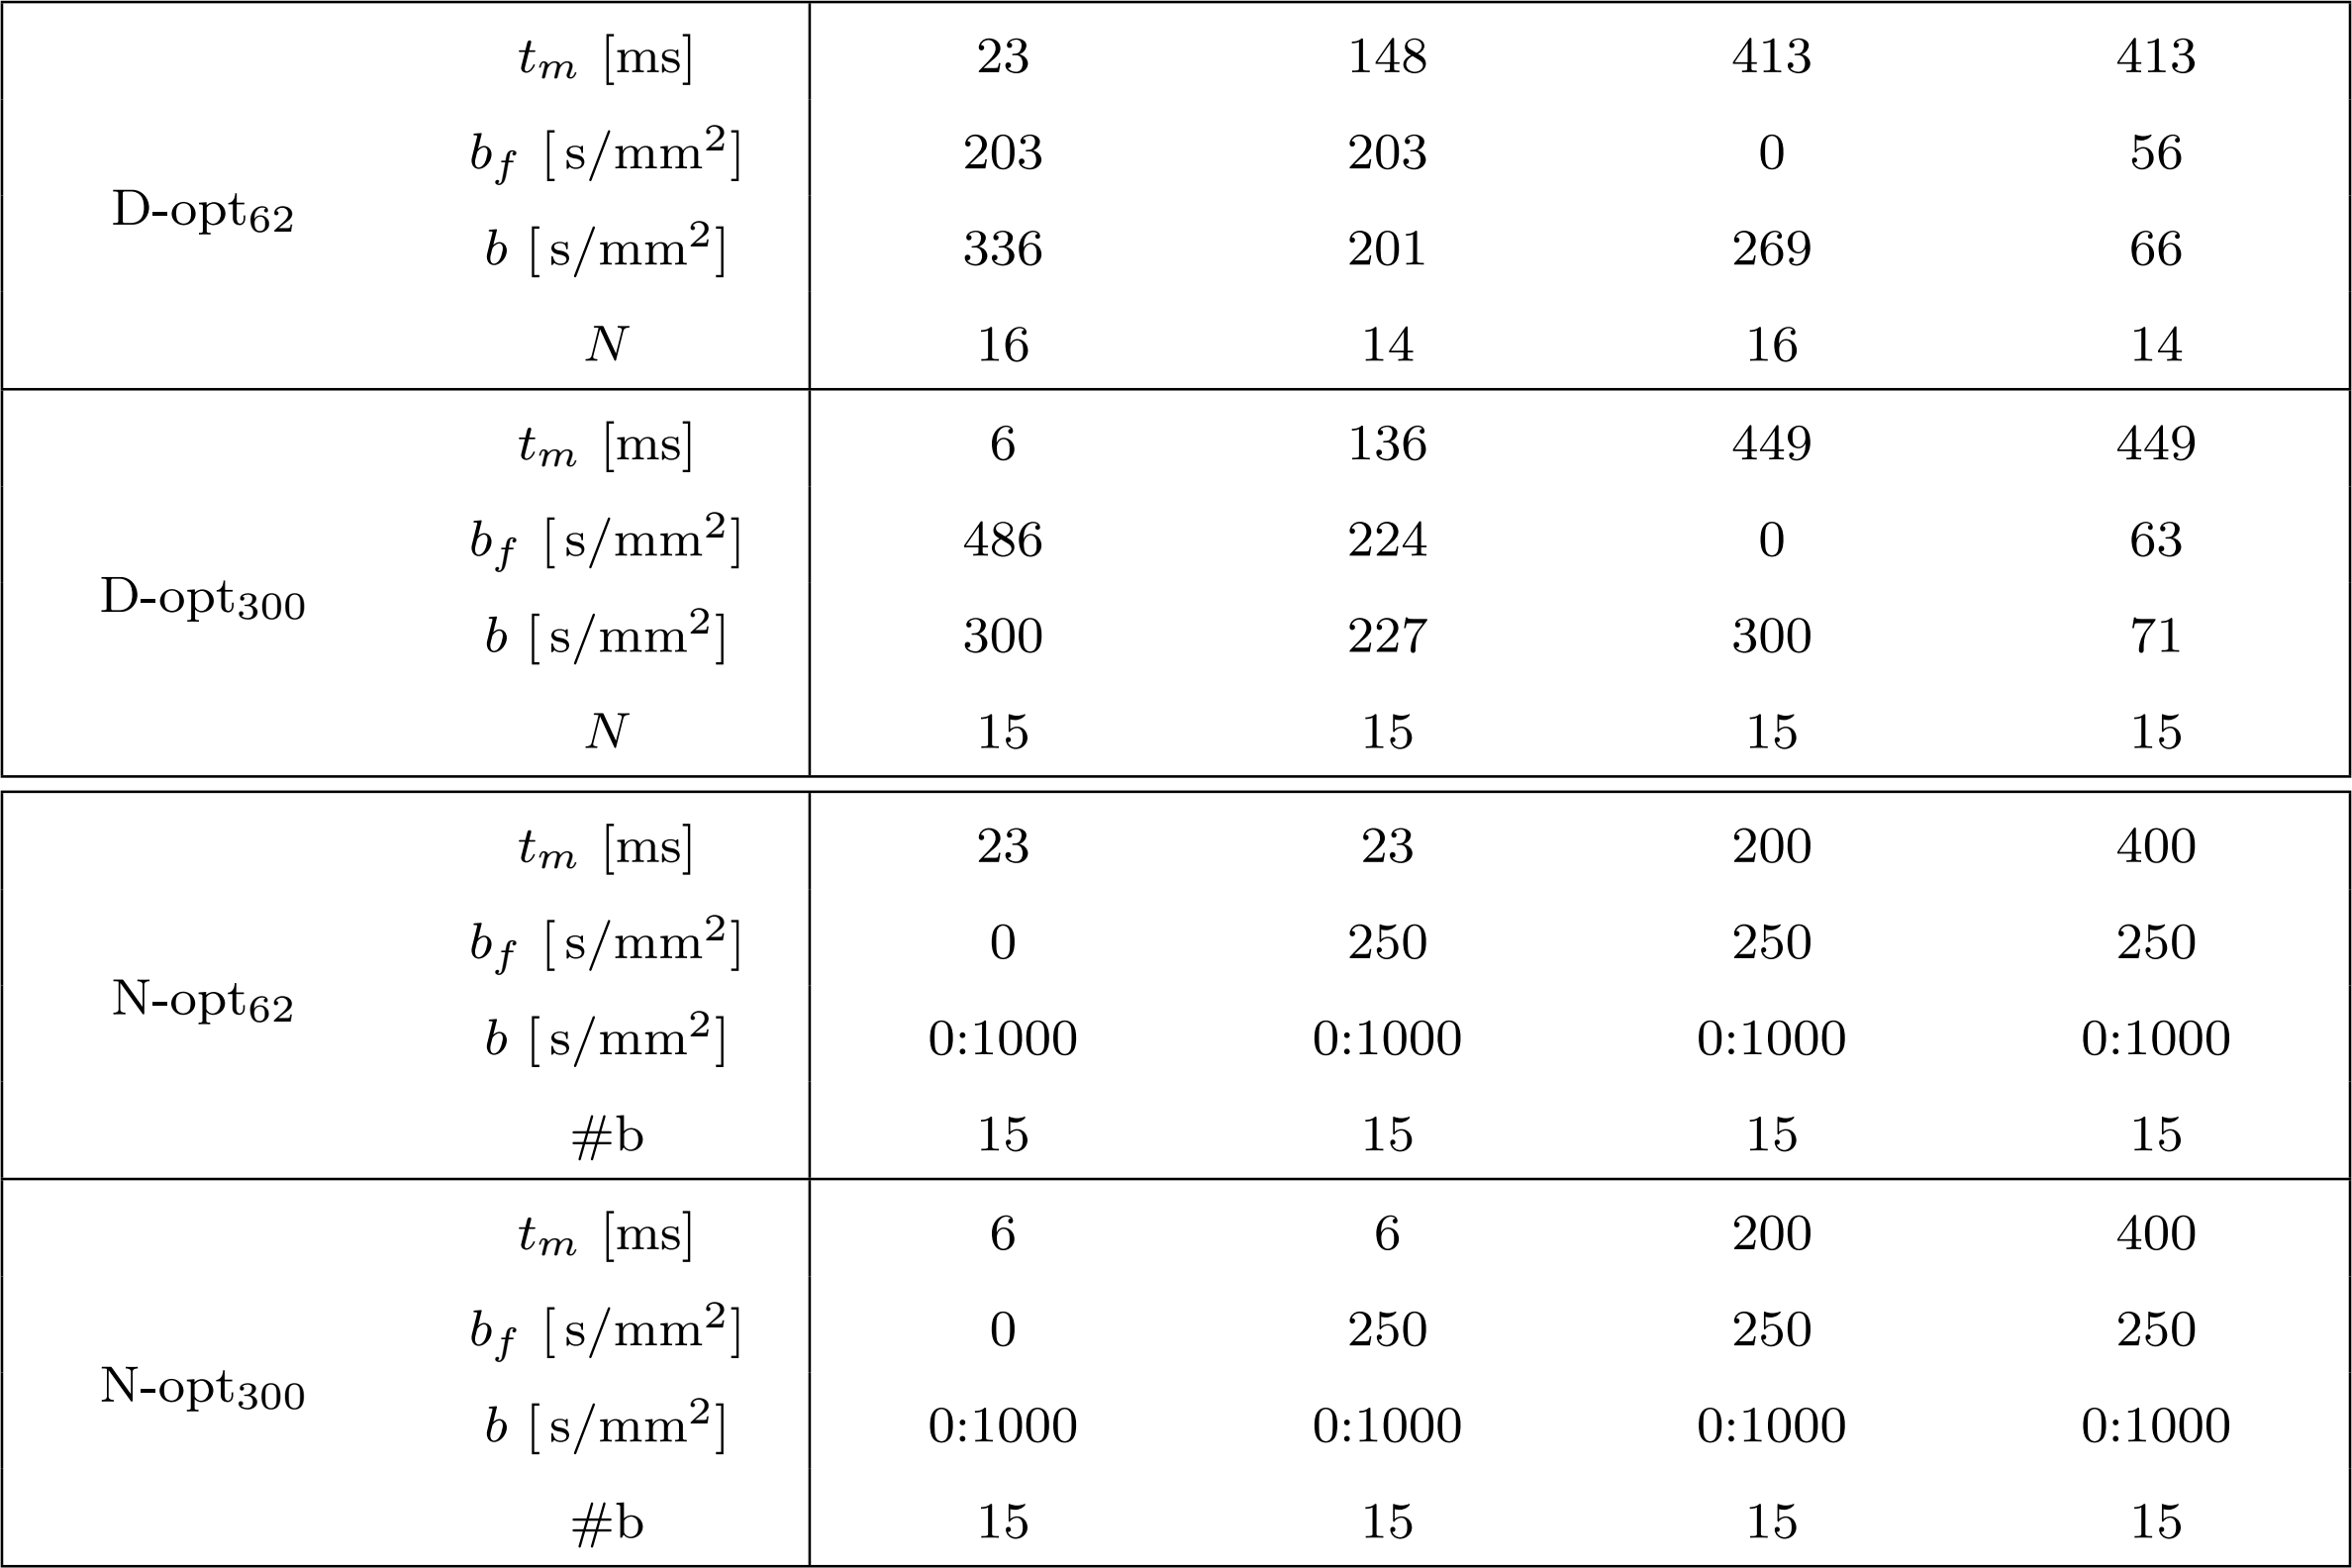
Table 1. Sequence protocols. D-opt62 and D-opt300 are the protocols optimised for BBB water exchange measurements; N-opt62 and N-opt300 are the manually-adapted protocols. N is the number of averages of each bf/tm/b combination in D-opt protocols; #b is the number of b-values for each bf/tm combination in N-opt protocols. An additional b=0s/mm2 image was acquired for each bf/tm combination of the D-opt protocols.

Figure 2. Accuracy and precision of k for SNR=25. (a). Accuracy (mean relative error, MRE) and precision (standard deviation of the relative errors, SRE) of k estimates as a function of ground truth k (x-axis) and fieq (y-axis). Results with MRE>1 or SRE>1 are marked in grey. (b).Comparison between D-opt and manually-adapted protocols. Red→D-opt performs better; blue→manually-adapted performs better.

Figure 3. SNR requirements. (a). Accuracy (mean relative error, MRE) as a function of SNR for a subset of tissue parameters (De=1.1μm2/ms, Di=10μm2/ms, fieq=0.05). (b). Precision (standard deviation of the relative errors, SRE) as a function of SNR for the same subset of tissue parameters.

Figure 4. In vivo data. A representative image is shown for each combination of bf/tm/b along with the corresponding b=0s/mm2 images.