1091
Blood-brain barrier water exchange estimation using optimised contrast-enhanced ASL
Elizabeth Powell1, Ben Dickie2, Yolanda Ohene2, Geoff JM Parker1,3,4, and Laura M Parkes2
1Centre for Medical Image Computing, Department of Computer Science, University College London, London, United Kingdom, 2Division of Neuroscience and Experimental Psychology, Faculty of Biology, Medicine and Health, The University of Manchester, Manchester, United Kingdom, 3Department of Neuroinflammation, Queen Square Institute of Neurology, University College London, London, United Kingdom, 4Bioxydyn Limited, Manchester, United Kingdom
1Centre for Medical Image Computing, Department of Computer Science, University College London, London, United Kingdom, 2Division of Neuroscience and Experimental Psychology, Faculty of Biology, Medicine and Health, The University of Manchester, Manchester, United Kingdom, 3Department of Neuroinflammation, Queen Square Institute of Neurology, University College London, London, United Kingdom, 4Bioxydyn Limited, Manchester, United Kingdom
Synopsis
Contrast-enhanced ASL (CE-ASL) has been proposed as a method for measuring blood-brain barrier (BBB) water exchange. Altering the T1 of blood using a gadolinium-based contrast agent should allow the label location to be identified as a function of post-labelling delay time; however, the shorter T1 of blood water leads to a trade-off between contrast dose and SNR. We show using simulations that there is an optimal T1 of blood post-contrast that balances this trade-off. Using this information we estimate the expected accuracy and precision of BBB water exchange measurements using CE-ASL. Finally, we demonstrate the method in vivo.
Introduction
Blood-brain barrier (BBB) dysfunction is increasingly recognised in a number of neurological conditions, including stroke, multiple sclerosis and neurodegeneration1-3. Estimates of water exchange across the BBB have demonstrated greater sensitivity to subtle damage than conventional approaches that use leakage of gadolinium-based contrast agents (GBCA)4 , thus presenting the possibility of detecting disease earlier.Contrast-enhanced arterial spin labelling (CE-ASL) has recently been proposed5 as a method for quantifying the permeability surface area product of the BBB to water (PS). Acquiring ASL images in the presence of an intravascular contrast agent should in theory enable the label location, in either the intra- or extravascular space, to be determined as a function of post labelling delay (PLD) time due to the difference in blood and tissue T1. However, the shorter blood water T1 relaxation time causes the difference signal to decay more quickly, leading to an inherent trade-off between GBCA dose and signal-to-noise ratio (SNR). In this work, we: (i) investigate the optimal T1 of blood post-contrast for quantifying BBB water exchange; (ii) use simulations to assess the accuracy and precision of PS at various SNRs, and; (iii) demonstrate the optimised method in a healthy volunteer.
Methods
SimulationsSignals were generated using a two-compartment model accounting for finite water exchange between intra- and extravascular compartments6 (see Fig. 1). Optimal sensitivity to water exchange was explored by varying the relaxation time of blood post-contrast between 0.1<$$$\text{T}_{\text{1,b}}^{\text{post}}$$$[s]<1.7. Other parameters were1,7: relaxation time of blood pre-contrast $$$\text{T}_{\text{1,b}}^{\text{pre}}$$$=1.7s; relaxation time in extravascular space T1,e=1.5s; blood flow f=60ml blood(min)-1(100ml tissue)-1; PS=6.6ml water(min)-1(ml tissue)-1; blood volume vbw=0.05ml blood(ml tissue)-1; arrival time tA=1.2s. Fitting was performed on 2500 noisy signals using a least-squares minimisation; T1 times were fixed to their ground truth values, leaving as free parameters PS/vbw, f and tA. The GBCA dose needed to achieve optimal $$$\text{T}_{\text{1,b}}^{\text{post}}$$$ was explored as a function of time post-injection, and calculated using the mean vascular input function from the saggital sinus of 32 healthy volunteers (mean age 66 years, range 52-81 years) following 0.1mmol/kg injection of Dotarem GBCA.
Data acquisition
Proof-of-concept data were collected in a single volunteer (64 years, female) on a simultaneous PET-MR scanner (GE Healthcare) using Enhanced ASL with pCASL labelling, 3D spiral FSE, 6 PLDs and variable label duration (LD) (Fig. 1), with voxel size 1.7mmx1.7mmx4mm. A 0.1mmol/kg dose of Dotarem GBCA was injected and the ASL acquisition repeated (3 PLDs; Fig. 1) ~20min later. T1 mapping was performed (with B1+ correction) pre- and post-injection using a 3D T1-weighted spoiled gradient echo variable flip angle approach, with flip angles 2, 20, 30 and 40 degrees and TR/TE = 13.5/1.08ms. T1,b was estimated from the superior sagittal sinus. A 1mm isotropic T1-weighted image was acquired to segment grey matter, enabling the mean ASL signal to be extracted for each PLD. The two-compartment model6 was fitted to the data to estimate PS/vbw, f and tA.
Results
Fig. 2a shows that PS/vbw was estimated with the greatest accuracy and precision for 0.7<$$$\text{T}_{\text{1,b}}^{\text{post}}$$$<1.0s; this was particularly evident at low SNR. Minimal bias in PS/vbw was observed by varying T1,e (Fig. 2b).Fig. 3 demonstrates the expected region of interest (ROI) scale at which PS/vbw may be estimated with reasonable accuracy and precision. Using this experimental approach clinically (that is, assuming SNR~25 in the control images), global estimates of PS/vbw across gray matter (GM) could be expected with a CoV~45%. A 4-fold increase in SNR would allow PS/vbw to be quantified in individual cortical regions with a similar level of precision.
Fig. 4 shows how the optimum T1,b may be obtained as a function of GBCA dose and time after injection.
In vivo images are shown in Fig. 5. Images post-contrast show the expected reduction in the ASL subtraction signal, but parenchymal structure remains visible. Averaged across all GM voxels, parameter fits were: f=33.6mL/min/100mL, tA=1.36s and PS/vbw=45min-1.
Discussion
This work evaluates the feasibility of water exchange measurements using CE-ASL. We explored the required reduction in $$$\text{T}_{\text{1,b}}^{\text{post}}$$$ for optimal measurements of PS/vbw, and demonstrated that the method is robust across a range of values. Given the inherently low SNR of ASL-based techniques, it was important to assess the magnitude of measurement errors in order to evaluate experimental design limits. Simulations indicated that global estimates of PS/vbw should be achievable clinically with reasonable accuracy and precision; this finding was corroborated in vivo, where global GM PS/vbw estimates in a healthy volunteer were in line with published values1.A practical application of this method would be its use in conjunction with DCE-MRI, particularly when BBB damage is minimal. Following a DCE-MRI acquisition lasting at least 20min, $$$\text{T}_{\text{1,b}}^{\text{post}}$$$ would have recovered enough to generate suitable contrast for subsequently estimating PS/vbw using CE-ASL.
Conclusions
Measurements of water exchange across the BBB are important for characterising subtle damage early during disease onset. We present a CE-ASL method for clinically-feasible global GM measurements of PS/vbw in 13min. Simulations indicated that maximal accuracy and precision could be obtained across a range of $$$\text{T}_{\text{1,b}}^{\text{post}}$$$ values, thus providing flexibility in experimental set up. By utilising residual T1 relaxation rate changes from conventional DCE-MRI protocols, CE-ASL measurements could offer an efficient approach for assessing BBB permeability.Acknowledgements
Thanks to GE Healthcare for use of the Enhanced ASL sequence. This work was supported by EPSRC grants EP/S031510/1 and EP/M005909/1.References
- Dickie BR, Parker GJM and Parkes LM. Measuring water exchange across the blood-brain barrier using MRI. Prog Nucl Magn Reson Spectrosc. 2019.
- Kim YR, Tejima E, Huang S, et al. In vivo quantification of transvascular water exchange during the acute phase of permanent stroke. Magn Reson Med. 2008;60(4):813–821.
- Sweeney MD, Sagare AP and Zlokovic BV. Blood–brain barrier break-down in Alzheimer disease and other neurodegenerative disorders. Nat Rev Neurol. 2018;14(3):133–150.
- Dickie BR, Vandesquille M, Ulloa J, et al. Water-exchange MRI detects subtle blood-brain barrier breakdown in Alzheimer’s disease rats. NeuroImage. 2019;184:349–358.
- Beaumont H, Pearson A, van Osch MJ, et al. Estimation of water exchange across the blood brain barrier using contrast-enhanced ASL. Proc Intl Soc Mag Reson Med. 2016.
- Parkes LM and Tofts PS. Improved accuracy of human cerebral blood perfusion measurements using arterial spin labeling: accounting for capillary water permeability. Magn Reson Med. 2002;48(1):27–41.
- Carr JP, Buckley DL, Tessier J, et al. What levels of precision are achievable for quantification of perfusion and capillary permeability surface area product using ASL? Magn Reson Med. 2007;58(2):281–289.
Figures
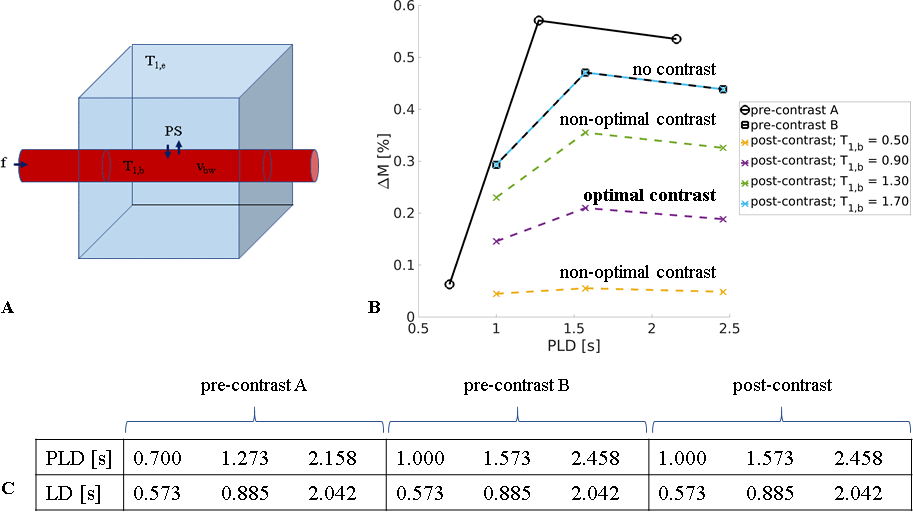
Figure 1. ASL signal model and acquisition scheme. (a). The two-compartment model consists of intra- and extra-vascular spaces (red and blue respectively), with corresponding relaxation rates T1,b, T1,e and volume fractions vbw, ve. (b). Simulated ASL subtraction signals for the label durations (LDs) and post-labelling delay (PLD) times given in (c). Trade-off between GBCA dose and SNR is clear in the post-contrast signal change with $$$\text{T}_{\text{1,b}}^{\text{post}}$$$.
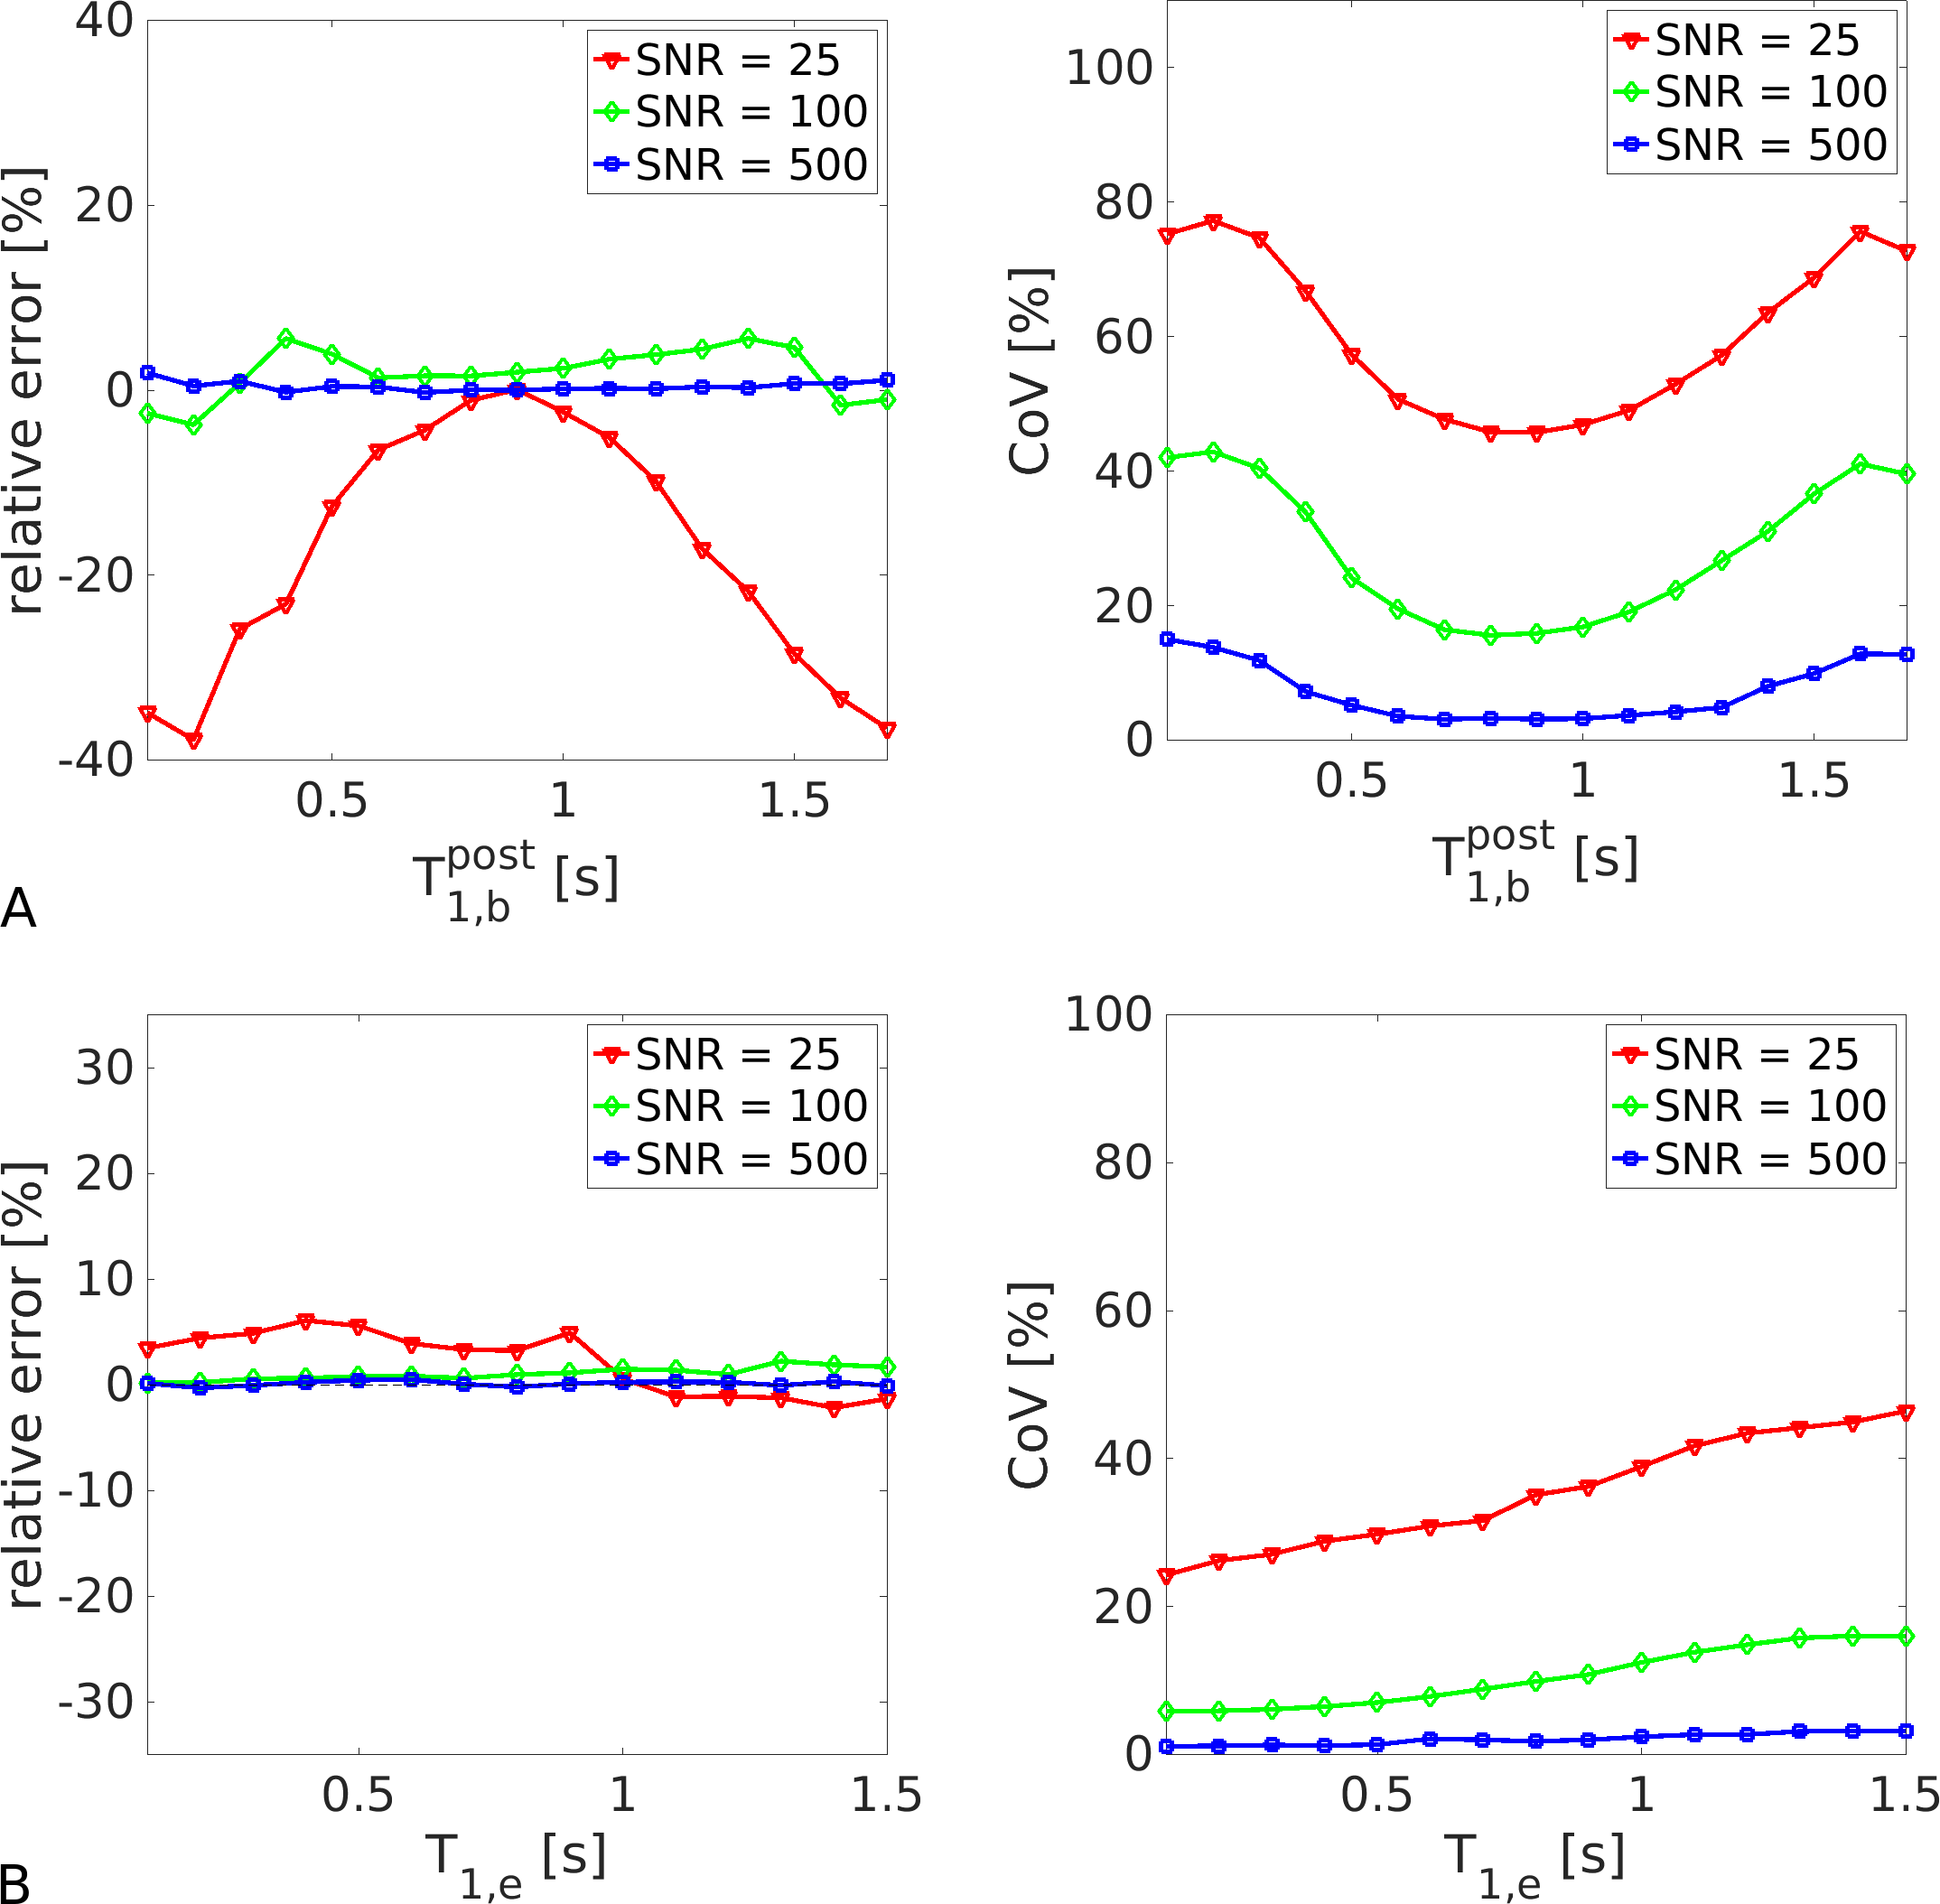
Figure 2. Bias and variance analysis. Simulations show the accuracy and precision of whole-GM PS/vbw estimates for different T1 relaxation conditions; quoted SNRs indicate voxel-wise values in the control signal. (a). Greatest accuracy and precision was observed for 0.7<$$$\text{T}_{\text{1,b}}^{\text{post}}$$$<1.0. (b). Minimal bias in PS/vbw was observed across the range in T1,e, although precision decreased as T1,e approached its equilibrium (no contrast) value.
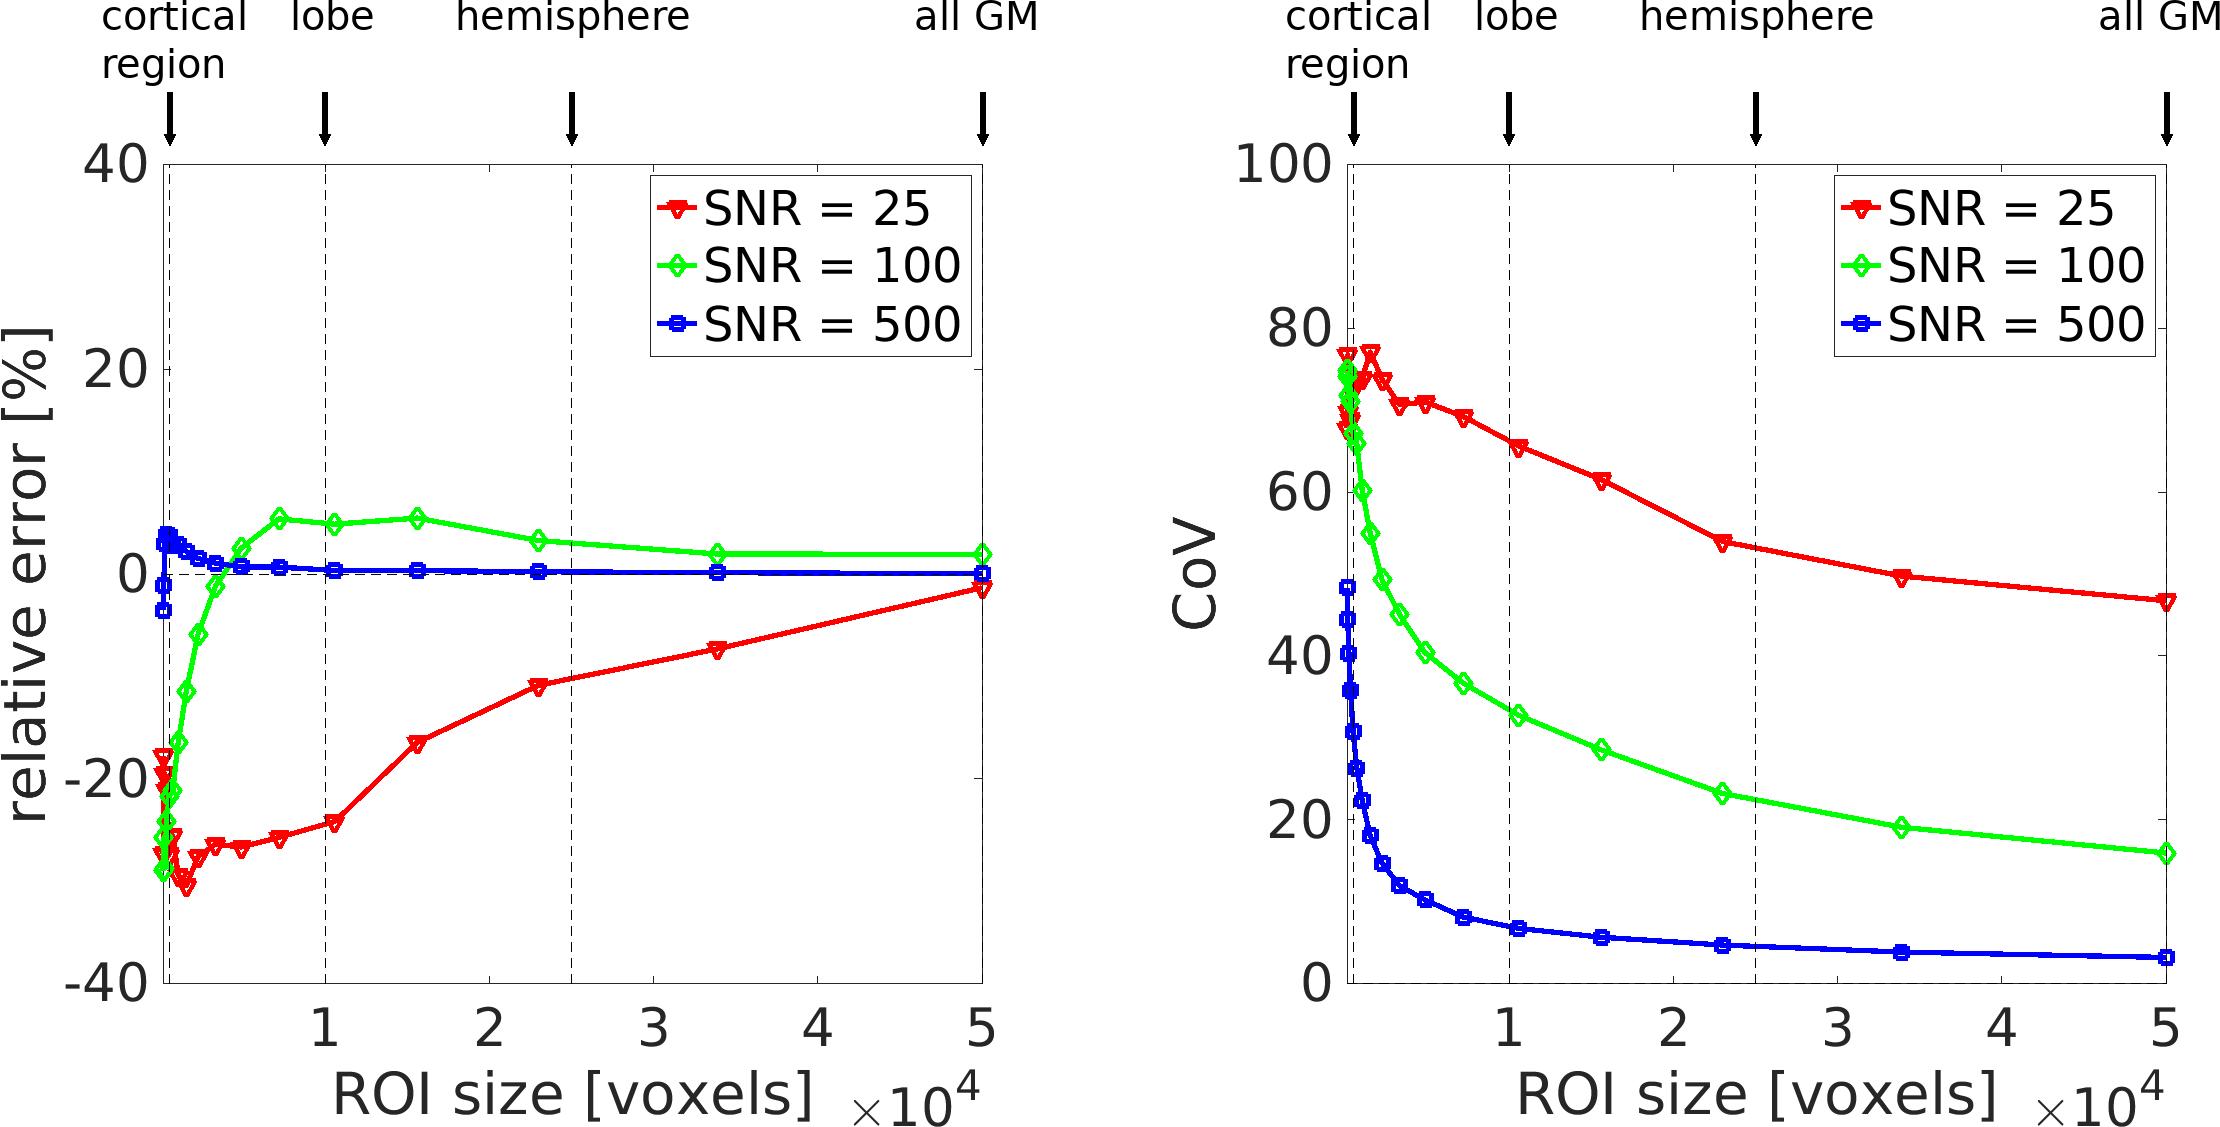
Figure 3. ROI size dependence of PS/vbw estimates. Accuracy and precision estimates from simulations show the feasibility and SNR requirements of regional PS/vbw measurements. Quoted SNRs indicate voxel-wise values in the control signal.
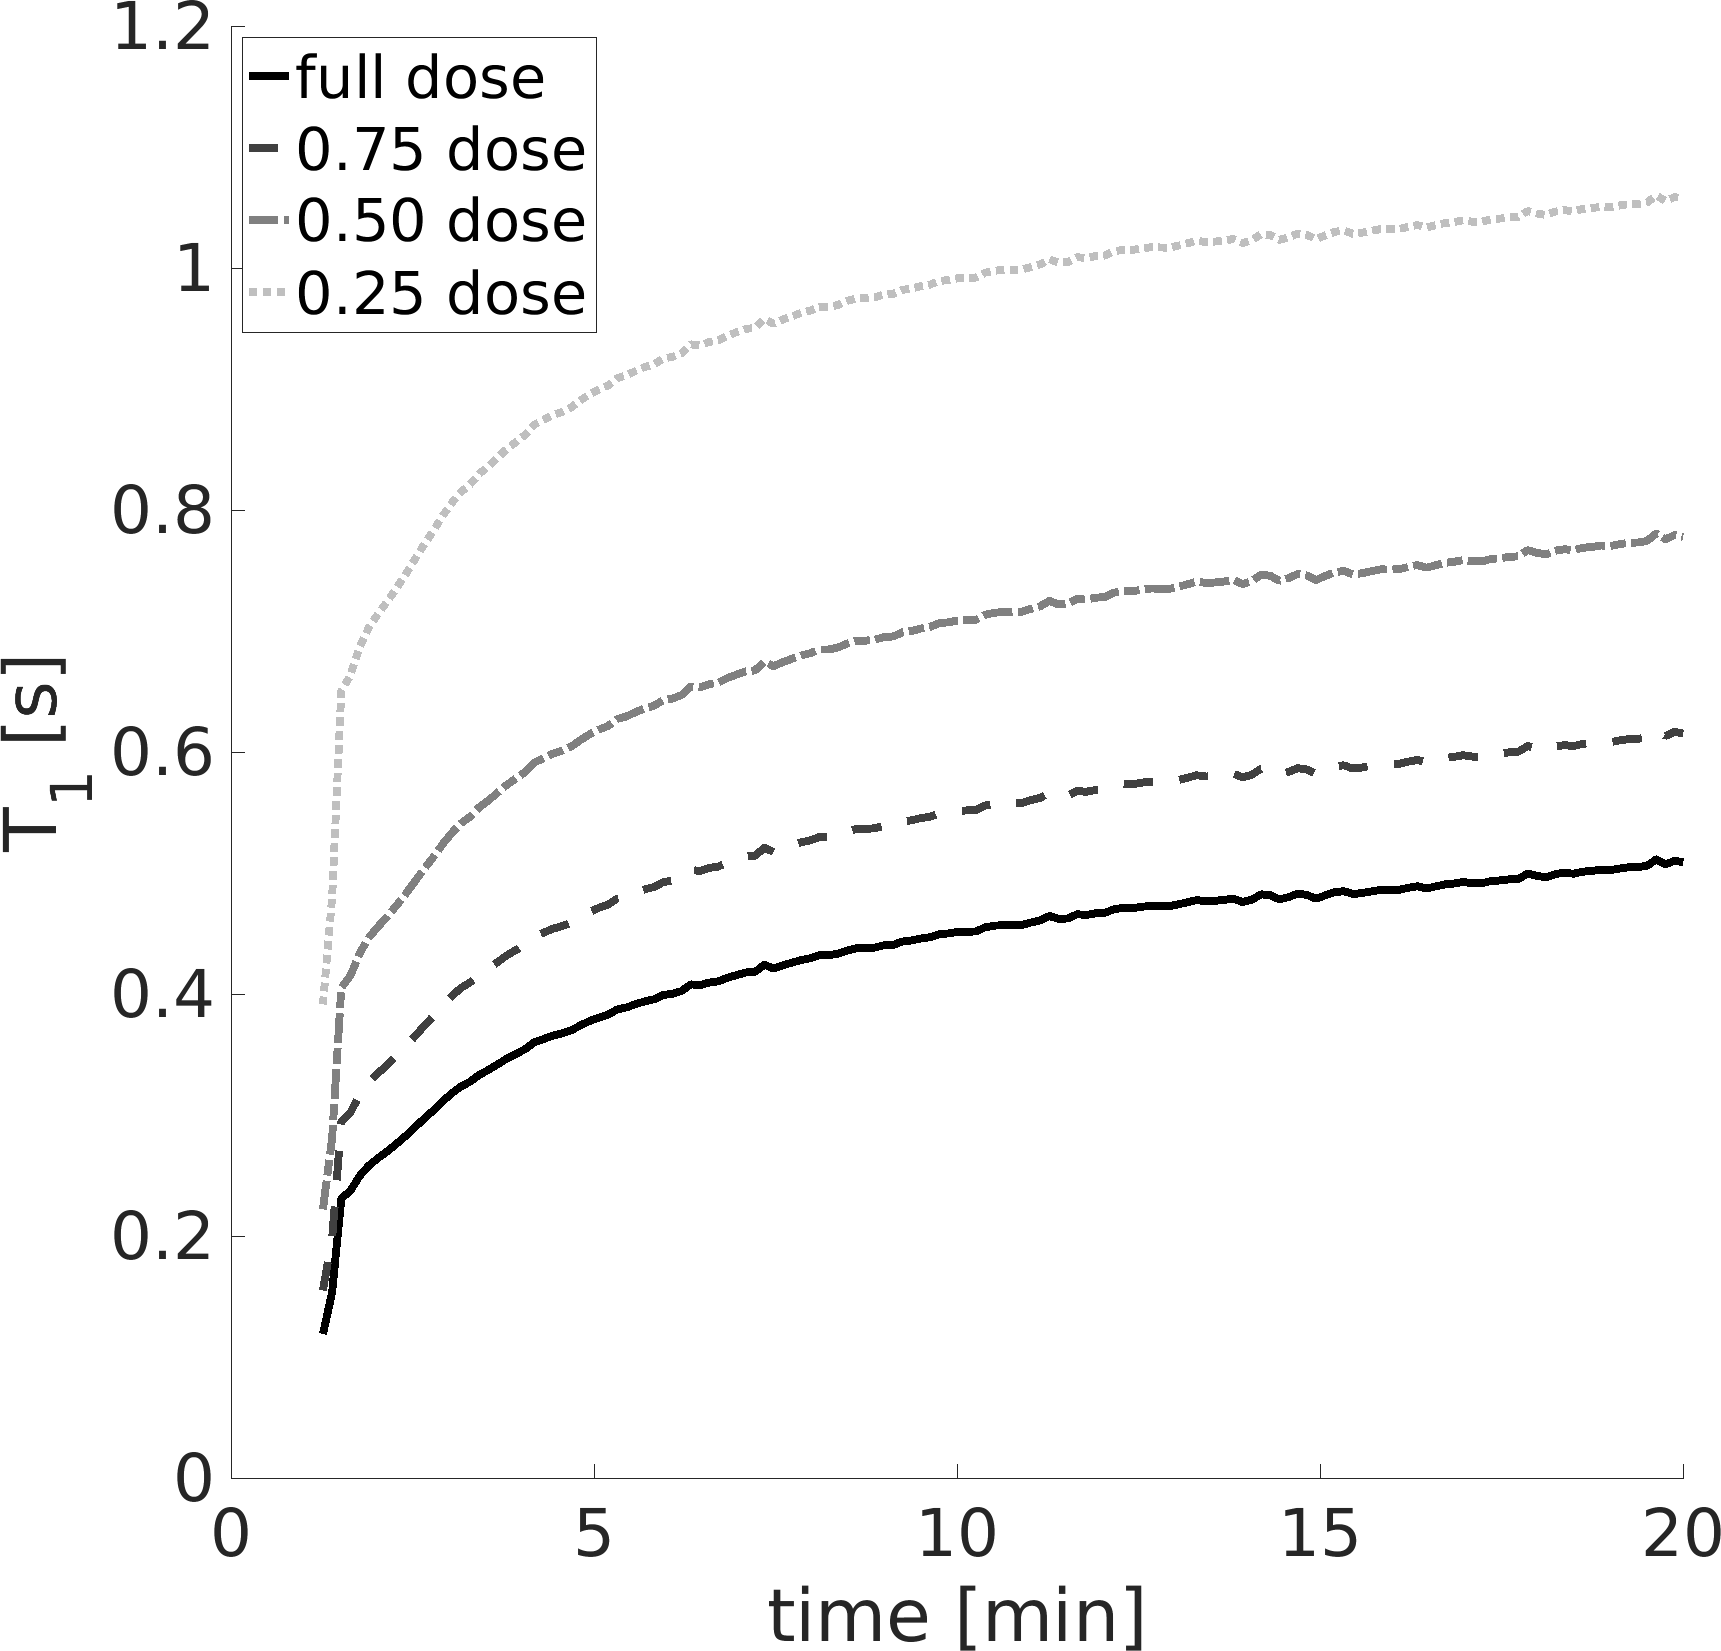
Figure 4. Obtaining optimal $$$\text{T}_{\text{1,b}}^{\text{post}}$$$. Recovery of $$$\text{T}_{\text{1,b}}^{\text{post}}$$$ is plotted as a function of time post-injection for different administered GBCA doses. Optimum $$$\text{T}_{\text{1,b}}^{\text{post}}$$$ values were obtained at ~20min following a half-dose.
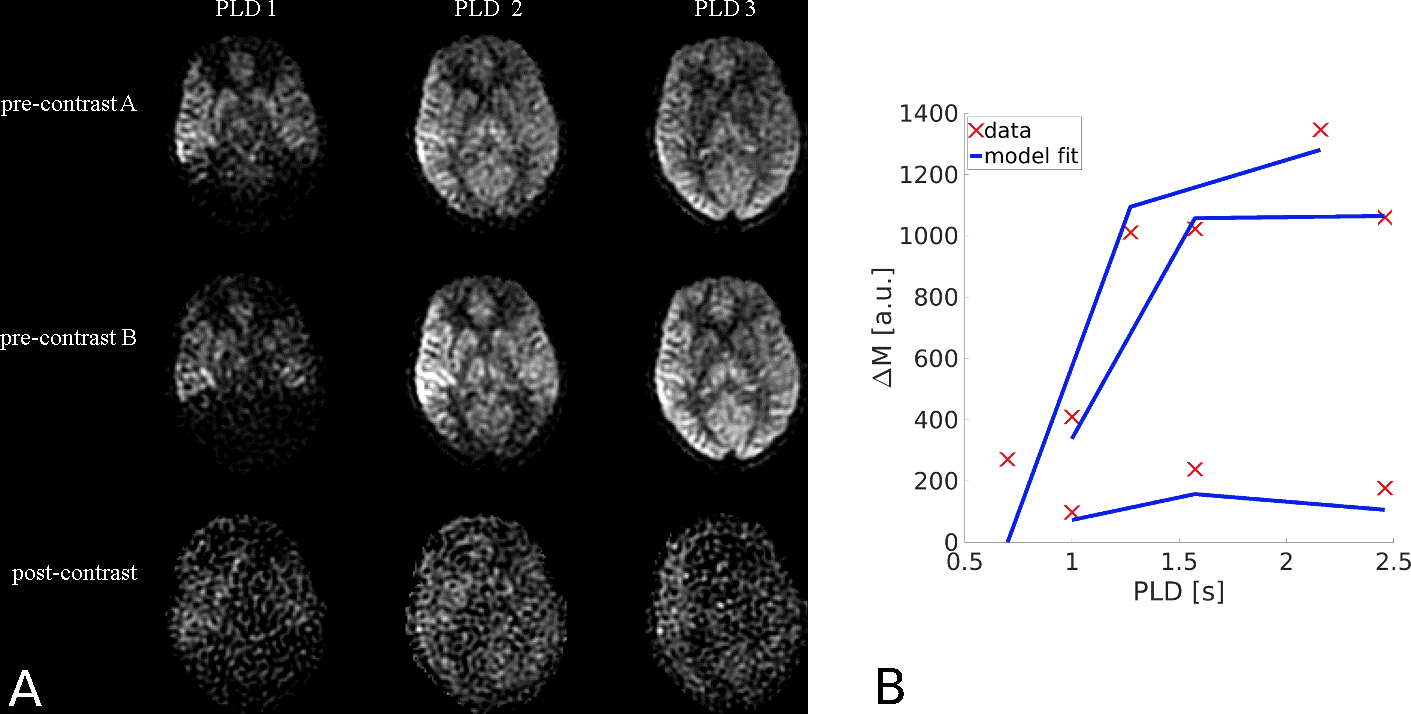
Figure 5. In vivo results. (a). A representative slice acquired for each ASL acquisition scheme. The intensity scale of post-contrast images is adjusted to best visualise the data. (b). Results of model fitting across all GM in vivo. Red crosses show the raw data; blue lines are the model fits.