1090
Comparison of the arterial-voxel discriminatory power of DSC-MRI signal features and creation of a framework for determining optimal thresholds1Norwich Medical School, University of East Anglia, Norwich, United Kingdom, 2C.J. Gorter Centre for High Field MRI, Department of Radiology, Leiden University Medical Centre, Leiden, Netherlands
Synopsis
To estimate brain perfusion from DSC-MRI, tissues’ arterial inputs are detected considering different features of the concentration time curve (CTC) collectively. No study has explored the individual AV-discriminatory power and optimal tissue-voxel-elimination thresholds for these features. Here, the area-under-the-receiver-operating-characteristic(ROC)-curves evaluated the former, while ROC cut-offs gave the latter. Three features were more effective than others: their optimal thresholds discarded tissue-voxels with high specificity and sensitivity. The knowledge of individual AV-discriminatory powers will allow Radiologists to make more informed choices while assessing the arterial candidacy of a CTC; other sites can use this threshold detection technique as a general framework.
Introduction
Perfusion parameters obtained from dynamic susceptibility-contrast magnetic resonance imaging (DSC-MRI) can provide clinicians with crucial insight about the diagnosis, grading, treatment planning, and monitoring of cerebral pathologies, such as glioma1, ischaemic stroke2,3, multiple sclerosis4, and Alzheimer’s disease5. Perfusion estimation requires accurate determination of the arterial input function (AIF)—the concentration time course (CTC) of contrast agent (CA) in an arterial voxel (AV). Automatic searches identify CTCs with typical arterial characteristics, e.g., high peak concentration and area under the curve, fast washout of the bolus, and lower width of the bolus6,7,8.They have the potential to be faster, and more objective and reproducible than manual selection, which involves visual assessment of the CTCs from prospective AVs.Generally, non-arterial voxels are discarded by applying empirical thresholds to different features of the dynamic data. To date, neither the optimal thresholds have been systematically determined for these features, nor have their individual AV-discriminatory powers been compared.
In this study, we compare the individual AV-detection-effectiveness of ten features and systematically determine their optimal tissue-voxel-elimination threshold ranges. Moreover, the feasibility of data-mining for AIF detection is explored.
Methods
DSC-MRI data were acquired from nine subjects at 1.5T (Siemens Vision/Symphony; Germany) with a gradient-recalled-echo echo-planar imaging sequence during the first pass of a 0.1mmol/kg bolus of gadopentetate dimeglumine: TR/TE = 1,000/47ms; 60 dynamics; flip angle=30°; slice thickness=5mm; FOV=220×220mm; matrix=128×128.For each signal-to-concentration converted curve, values were extracted for eight previously proposed features: area under the curve (AUC); full width at half maximum (FWHM); peak concentration (PeakConc); first moment (FM); time to peak (TTP); bolus arrival time (BAT); wash-in rate (MWI); and Mpeak , which combines three features ($$$M_{peak}=PeakConc\div(TTP\times FWHM)$$$)6,7. Further, two new features—duration of first pass (MTD) and rate of concentration drop (MWO)—were proposed (Figure 1).
Nominal AVs (i.e., ground truth) were obtained by a semi-automatic process that included visual inspection of the CTCs left after thresholding and standard k-means clustering9 (Figure 2). To enable rapid detection, raw-data-based clustering was replaced by feature-based clustering, which involved clustering a dimensionality-reduced version of the raw data space created from the ten extracted features.
For each feature, a receiver operating characteristic (ROC) curve was generated. The mean area under this curve (AUCROC) gave the power of each feature in distinguishing AVs from the soft-tissue voxels. The optimal threshold for each feature was the cut-off point on the ROC curve with the highest Youden index10 and was presented as a percentage increase from the mean feature value over all brain voxels. All processing and analyses were performed with MATLAB (R2018a, Natick, MA); ROCs were generated using the statistical package for the social sciences (SPSS) software (IBM Corp. 2017. Armonk, NY.).
Results
AUC, PeakConc, Mpeak and proposed MWO showed AUCROC >0.97 (p>0.001, two-way ANOVA)—proving their effectiveness in AV-detection. All other features had AUCROC <0.5—failing to identify AVs (Figure 3).The mean (SD) of optimal tissue voxel-elimination thresholds for AUC, PeakConc, and Mpeak were 64.23(22.52), 145.82(63.87), and 118.83(69.92)% above their overall mean feature values, respectively (Figure 4). For these thresholds, the sensitivity and specificity of soft-tissue identification were 100% and above 95%, respectively (Table 1). The proposed MWO could identify tissue voxels with high sensitivity and specificity. However, its optimal threshold could not be confirmed; for some subjects, the threshold was found to be lower than its overall mean. The spatial locations of the nominal AVs agreed with those reported in published studies11,12, proving the accuracy of feature-based clustering approach.
Discussion
AUC and PeakConc were individually effective in identifying AVs. Although temporal features, such as TTP, FWHM, BAT, and FM, fail to identify AV individually, they can be combined with other features to produce an effective criterion, which is the case for Mpeak. The proposed MWO can also be used to distinguish AV; but its use in tissue-voxel elimination demands further investigation. The individual effectiveness information will assist Radiologists while assessing the local or global-AIF candidacy of a CTC; the optimal-threshold-detection technique can be used as a general framework for other sites, patient studies, or imaging protocols.The clustering of the dimensionality-reduced feature space simplified and accelerated the automatic search, decreasing the time complexity. This approach will be useful for AIF detection in typical ‘time is brain’ situations like acute stroke, where rapid processing and urgent decision-making are of crucial importance. The work can be extended to facilitate brain segmentation using DSC-MRI time-series by clustering distinctive signal features of different tissue regions.
Conclusion
The individual effectiveness of features can assist global- or local-AIF detection by suggesting the most suitable features or creating a novel, composite feature with high individual AV-discriminatory power. Although the presented optimal thresholds are data-specific, the study contributes towards establishing a general framework for the detection of optimal tissue-voxel elimination thresholds; other sites, patient studies or imaging protocols can use these thresholds as a reference for soft-tissue elimination.Acknowledgements
No acknowledgement found.References
1. Essig, M., et al., MR imaging of neoplastic central nervous system lesions: review and recommendations for current practice. AJNR Am J Neuroradiol, 2012. 33(5): p. 803-17.
2. Law, M., et al., Glioma grading: sensitivity, specificity, and predictive values of perfusion MR imaging and proton MR spectroscopic imaging compared with conventional MR imaging. AJNR Am J Neuroradiol, 2003. 24(10): p. 1989-98.
3. Rempp, K.A., et al., Quantification of regional cerebral blood flow and volume with dynamic susceptibility contrast-enhanced MR imaging. Radiology, 1994. 193(3): p. 637-41.
4. Zivadinov, R., et al., Use of perfusion- and diffusion-weighted imaging in differential diagnosis of acute and chronic ischemic stroke and multiple sclerosis. Neurol Res, 2008. 30(8): p. 816-26.
5. Mattia, D., et al., Quantitative EEG and dynamic susceptibility contrast MRI in Alzheimer's disease: a correlative study. Clin Neurophysiol, 2003. 114(7): p. 1210-6.
6. Yin, J., J. Yang, and Q. Guo, Evaluating the feasibility of an agglomerative hierarchy clustering algorithm for the automatic detection of the arterial input function using DSC-MRI. PLoS One, 2014. 9(6): p. e100308.
7. Yin, J., et al., Automated detection of the arterial input function using normalized cut clustering to determine cerebral perfusion by dynamic susceptibility contrast-magnetic resonance imaging. J Magn Reson Imaging, 2015. 41(4): p. 1071-8.
8. Mouridsen, K., et al., Automatic selection of arterial input function using cluster analysis. Magn Reson Med, 2006. 55(3): p. 524-31.
9. Raykov, Y.P., et al., What to Do When K-Means Clustering Fails: A Simple yet Principled Alternative Algorithm. PLOS ONE, 2016. 11(9): p. e0162259.
10. Krzanowski, W.J. and D.J. Hand, ROC Curves for Continuous Data. 2009: Chapman & Hall/CRC. 11. Wismuller, A., et al., Cluster analysis of dynamic cerebral contrast-enhanced perfusion MRI time-series. IEEE Trans Med Imaging, 2006. 25(1): p. 62-73.
12. Zaro-Weber, O., et al., Influence of the Arterial Input Function on Absolute and Relative Perfusion-Weighted Imaging Penumbral Flow Detection. Stroke, 2012. 43(2): p. 378-385.
Figures
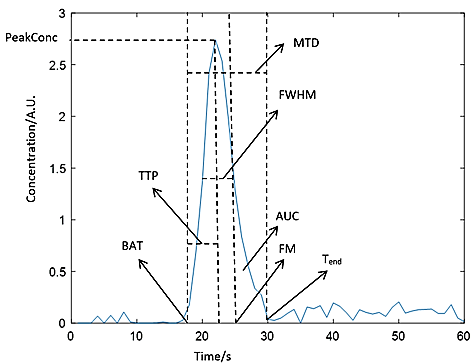
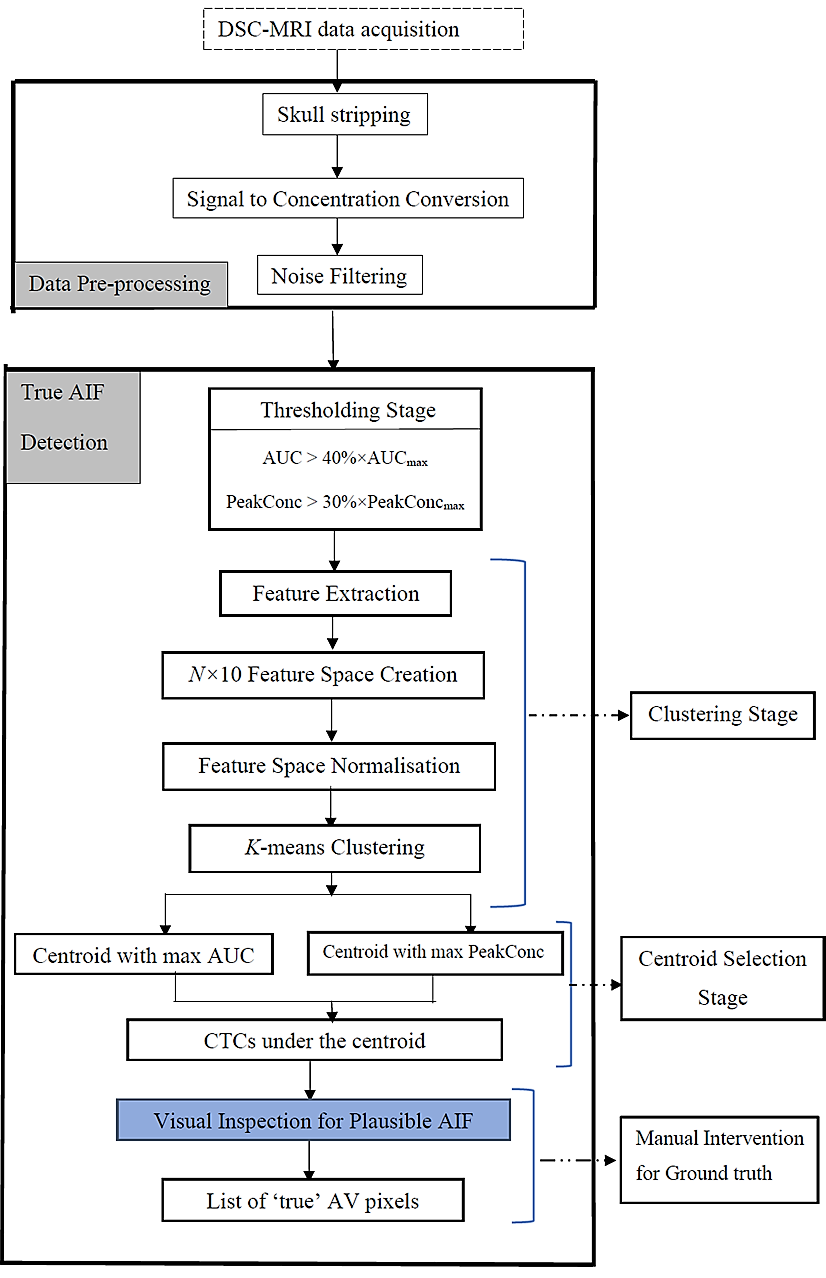
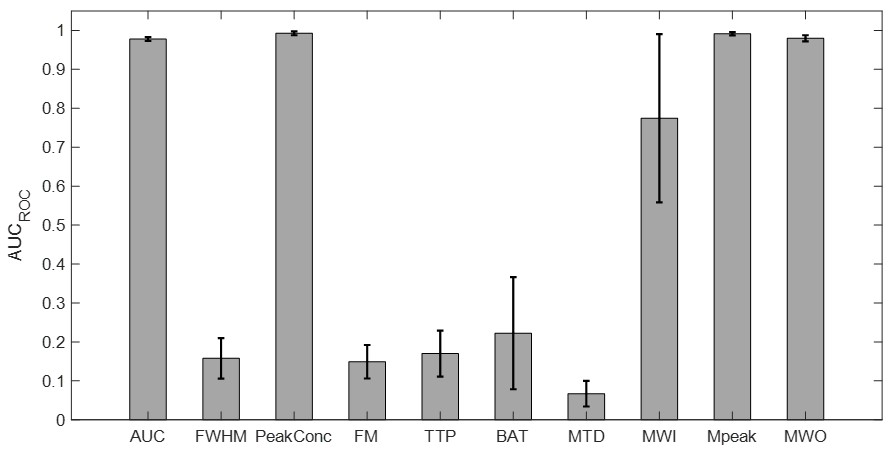
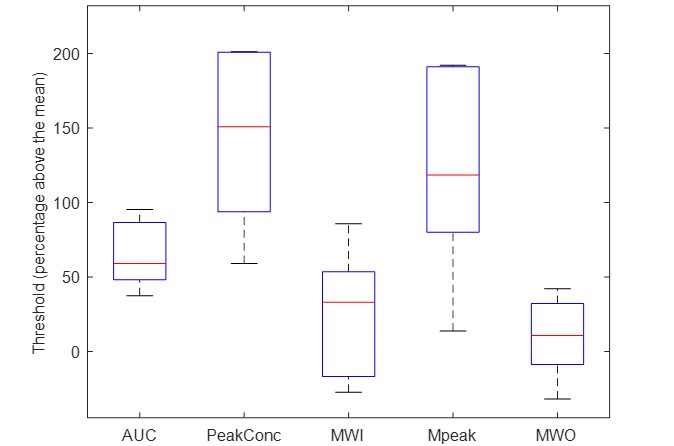
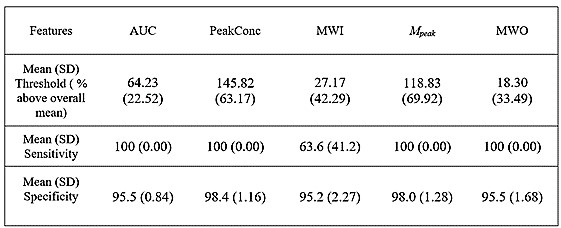
Table 1: Table showing Mean (SD) of optimal threshold (represented as % above the overall mean of a feature) together with the mean (SD) of achieved sensitivity and specificity
Abbreviations: AUC, area under the curve; PeakConc, peak concentration; MWI, mean wash-in rate; Mpeak, a combination of multiple features ; MWO, mean wash-out rate.