1089
Dependency of R2(*) Relaxation on Gd-DTPA Concentration in Arterial Blood: Influence of Hematocrit and Magnetic Field Strength1C. J. Gorter Center for High-Field MRI, Radiology, Leiden University Medical Center, Leiden, Netherlands, 2Radiology and Nuclear Medicine, Erasmus University Medical Center, Rotterdam, Netherlands, 3Radiology, Leiden University Medical Center, Leiden, Netherlands
Synopsis
In quantitative dynamic susceptibility contrast (DSC) MRI measurement of the arterial input function (AIF) is required. Generally, a linear relation between the R2(*) relaxation and the arterial contrast agent concentration is assumed (or the AIF is measured outside of an artery), although this is invalid for gradient-echo. In this study an open-source simulation tool is adapted to determine how R2(*) depends on contrast concentration for different physiological and MR parameters and this tool is validated by previously acquired in vitro data. The results show that sequence type (gradient-echo versus spin-echo), hematocrit and field strength all affect the relation.
INTRODUCTION
Dynamic susceptibility contrast (DSC) MRI is widely applied for measuring cerebral perfusion. To obtain quantitative information, determination of the arterial input function (AIF) is required. The AIF concentration-time profile is generally calculated from the R2(*) relaxation time curve, presuming a linear relationship1. However, the relation between R2* and Gd concentration ([Gd]) in arterial blood differs from that in brain tissue2 and depends on the MR sequence3. Previous in vitro studies have found a quadratic relation between R2* and [Gd] in human whole blood for gradient-echo (GE) sequences, which was strongly influenced by the hematocrit (HCT) value1. In contrast, for spin-echo (SE) sequences the relation seems more complex4. Since DSC-MRI is nowadays performed using various field strengths, contrast agents and MR sequences, studying this relationship in vitro would be very time-consuming and impractical. Alternatively, simulations could efficiently provide information about this relation. Therefore, the aims of this study were:1) To develop and validate a simulation setup to replicate the quadratic relation between the R2* relaxation and [Gd] in whole blood for GE sequences (proof-of-concept).
2) To investigate the dependency of this relation on the static magnetic field strength, sequence type and hematocrit.
METHODS
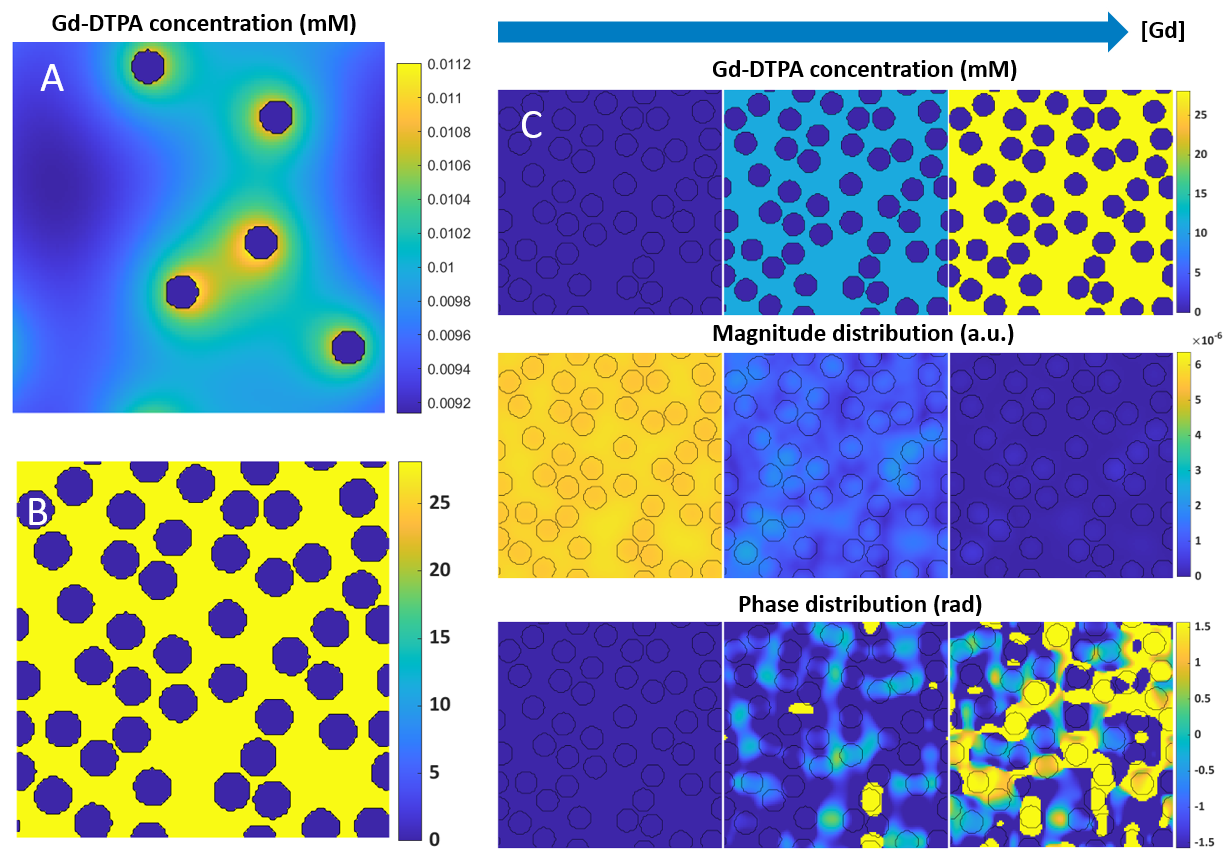
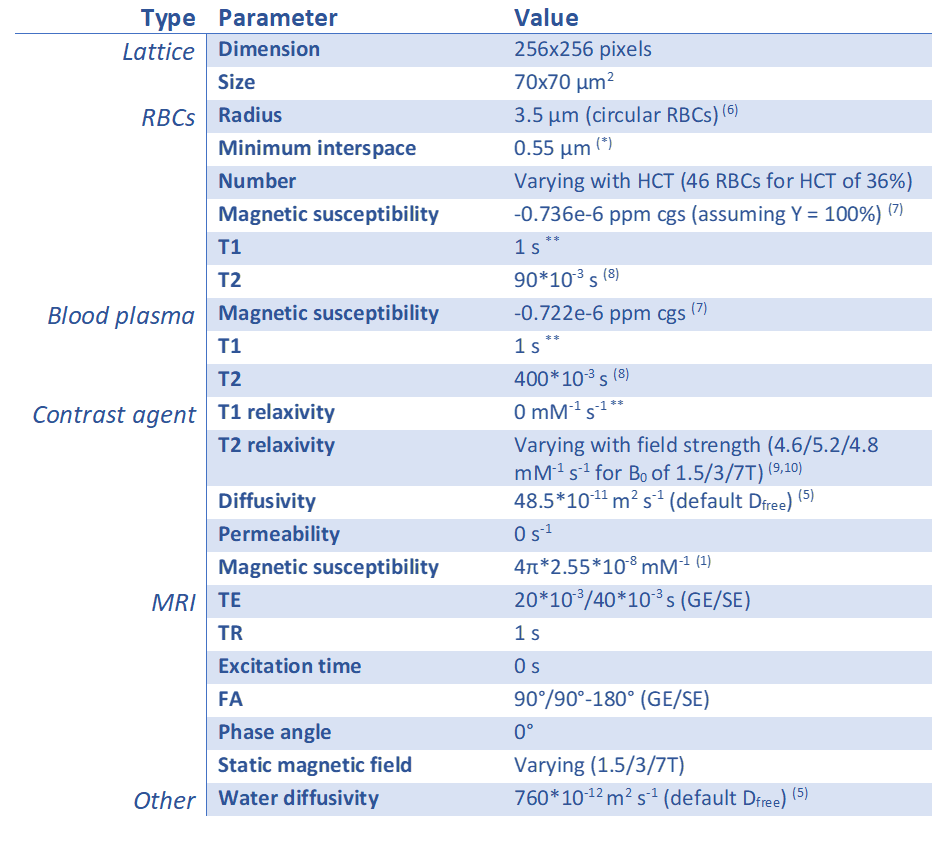
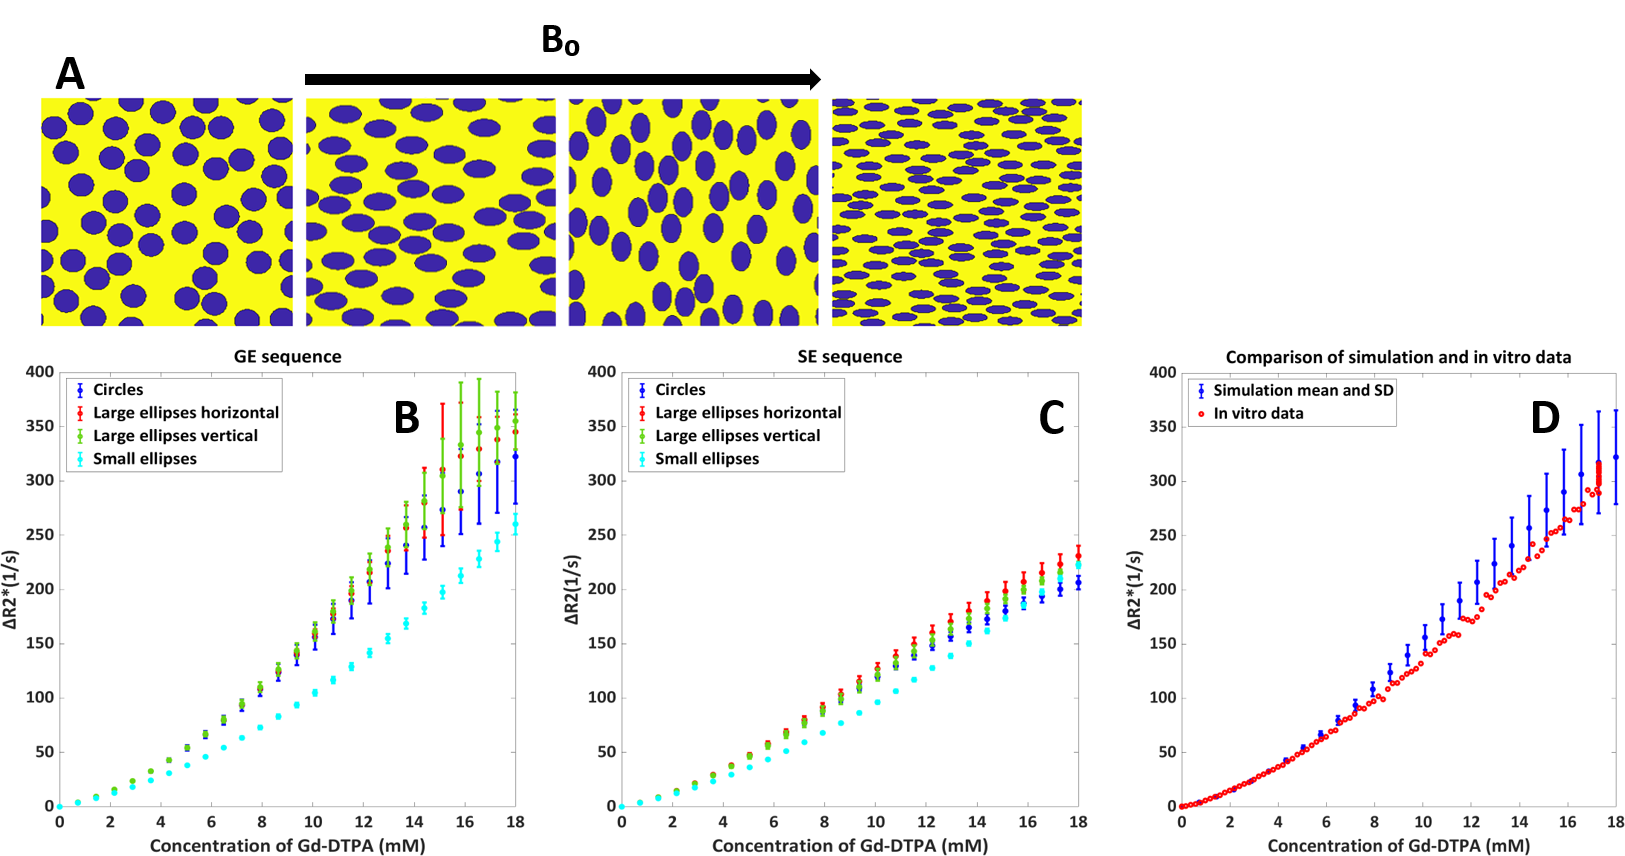
We used the open-source DCE simulation tool of Pannetier et al5 (Figure 1A&B) and adapted it by interpreting the vessels as red blood cells (RBCs) and the extracellular extravascular space (EES) as the blood plasma. The RBCs have an impermeable wall for Gd, so the contrast was modeled to only reside in the blood plasma. To represent fresh inflowing blood, we disregarded T1 effects by using a zero r1 of the contrast agent. A linearly increasing [Gd] was simulated, including diffusion through the magnetic field inhomogeneities originating from susceptibility differences between plasma and RBCs, resulting in dephasing and thus a drop in the MR signal magnitude (Figure 1C). To validate the simulation model, we compared the output of our simulations to a previously acquired ΔR2* versus [Gd] relation in vitro at 1.5T as measured in human whole blood with a HCT value of 36%1, while using similar parameters (Table 1). The simulation was performed 5 times with different RBC positioning to obtain the mean and SD. In addition, three types of RBCs (Figure 2) were simulated in order to validate the influence of their shape and orientation with respect to the main magnetic field:- Circular RBCs (radius 3.5 μm).
- Ellipsoidal RBCs (radii 4.5 and 2.72 μm) for two different alignments.
- Ellipsoidal RBCs (radii of 3.5 and 1.25 μm6).
RESULTS
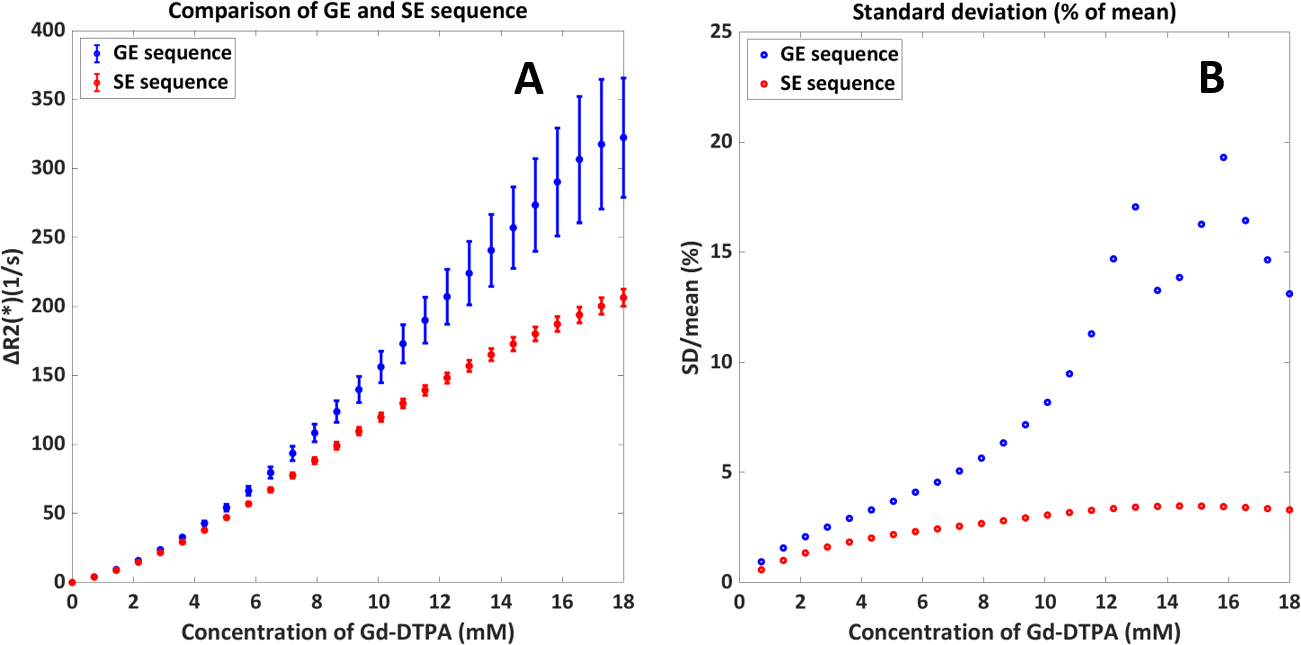
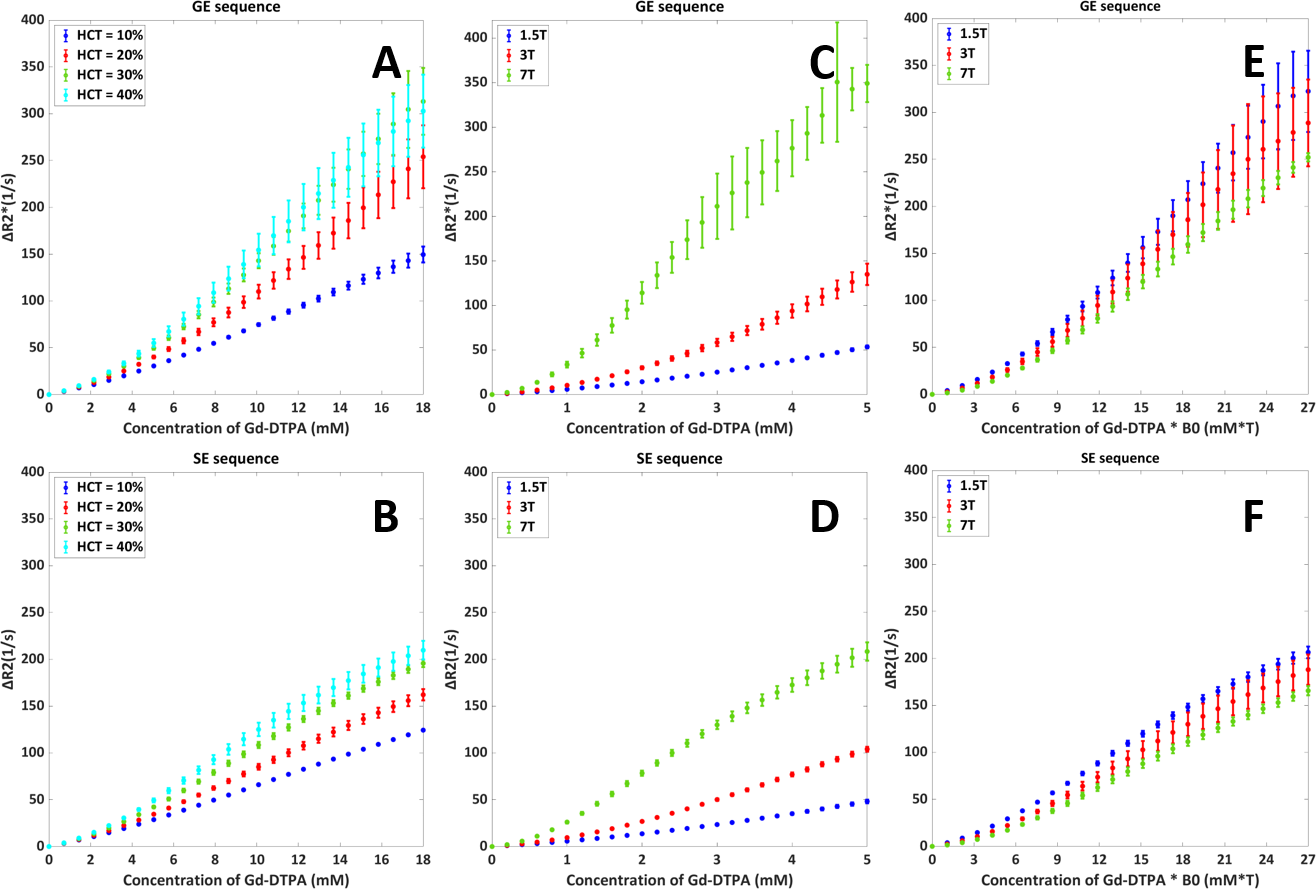
The quadratic dependency from previous in vitro studies was confirmed (Figure 2). The validations showed that the shape and orientation of the RBCs (when keeping the surface area equal) seems to have limited influence except a small effect at higher [Gd], while changing the surface area has larger effects. Comparison of GE and SE sequences (Figure 3), showed an expected higher relaxivity for GE, since SE refocuses dephasing from static field inhomogeneities. Additionally, for GE relative SD increased with [Gd], which shows that GE is more dependent on exact RBC positioning and indicates a higher sensitivity to local differences in microvascular architecture at tissue level. Figure 4A shows that the degree of quadraticity increases with HCT for GE, while the curves for 30% and 40% HCT are overlapping, especially at higher concentrations. For SE (Figure 4B), curves are leveling off at higher concentrations and overlap was less pronounced. The relaxivity increased with MR field strength, in line with previous literature11 (Figure 4C&D). To enhance the visibility of differences in shape of the relation, the concentration was scaled by MR field strength (Figure 4E&F) to correct for the generally assumed linear effect. The shape was found to be quadratic at 1.5T and 3T, while at 7T it was more sigmoidal.DISCUSSION
This research studied the relation between ΔR2(*) and [Gd] in arterial blood by adapting an open-source simulation tool. We varied the RBC distribution to provide an estimate of the measurement error of the simulation setup. Main new observations of our study are: 1) Spin-echo (ΔR2) relaxivity is also dependent on HCT levels; 2) The shape of the ΔR2(*)-relation is dependent on the field strength; and 3) The relative SD is especially high for GE at higher concentrations. For the last two points, we need to keep in mind the very low signal at high contrast concentrations, which amplifies ΔR2*-fluctuations and thus SD, while maybe also causing (subtle) changes in curve-shape. For SE, the HCT-dependent non-linearities can be explained by non-refocused water diffusion effects, which will depend on the fraction of RBCs. Finally, the dependency on RBC configuration suggests that the vessel orientation with respect to the main magnetic field might matter, since the disc-shaped RBCs are known to orient in a similar fashion in flowing blood.CONCLUSION
The simulation tool has provided new insight into the dependency of the relation between ΔR2(*) and [Gd] on physiological and MR parameters. Future work will focus on conversion to 3D simulations and studying this relation at the tissue level.Acknowledgements
We are thankful to NWO domain AES for their support (project 17079).References
1. Van Osch MJP, Vonken E jan PA, Viergever MA, Van der Grond J, Bakker CJG. Measuring the arterial input function with gradient echo sequences. Magn Reson Med. 2003;49(6):1067-1076.
2. Kjølby BF, Østergaard L, Kiselev VG. Theoretical model of intravascular paramagnetic tracers effect on tissue relaxation. Magn Reson Med. 2006;56(1):187-197.
3. Kiselev VG. Transverse relaxation effect of MRI contrast agents: A crucial issue for quantitative measurements of cerebral perfusion. J Magn Reson Imaging. 2005;22(6):693-696.
4. Boxerman JL, Hamberg LM, Rosen BR, Weisskoff RM. Mr contrast due to intravascular magnetic susceptibility perturbations. Magn Reson Med. 1995;34(4):555-566.
5. Pannetier NA, Debacker CS, Mauconduit F, Christen T, Barbier EL. A Simulation Tool for Dynamic Contrast Enhanced MRI. PLoS One. 2013;8(3).
6. Kinnunen M, Kauppila A, Karmenyan A, Myllylä R. Effect of the size and shape of a red blood cell on elastic light scattering properties at the single-cell level. Biomed Opt Express. 2011;2(7):1803-1814.
7. Spees WM, Yablonskiy DA, Oswood MC, Ackerman JJH. Water proton MR properties of human blood at 1.5 Tesla: Magnetic susceptibility, T1, T2*, T2, and non-Lorentzian signal behavior. Magn Reson Med. 2001;45(4):533-542.
8. Vidmar J, Serša I, Kralj E, Tratar G, Blinc A. Discrimination between red blood cell and platelet components of blood clots by MR microscopy. In: European Biophysics Journal. Vol 37. ; 2008:1235-1240.
9. Rohrer M, Bauer H, Mintorovitch J, Requardt M, Weinmann HJ. Comparison of magnetic properties of MRI contrast media solutions at different magnetic field strengths. Invest Radiol. 2005;40(11):715-724.
10. Vignaud A, Violas X, Rahmouni A, Robert P, Amadon A. Comparison of Marketed Gadolinium-Based Contrast Agents Relaxivities on Clinical MR Scanner at 1.5T, 3T and 7T in Water and Plasma for a Large Range of Physiological Concentrations. Vol 54.; 2010.
11. Akbudak E, Kotys MS, Memisevic D, Conturo TE. Quadraticity and hematocrit dependence of ΔR2* AIF signals at 3 T: A blood phantom study under physiological conditions. Syllabus ISMRM Work Quant Cereb Perfus Imaging Using MRI A Tech Perspect. 2004;(Venice):10-11.
Figures