1088
Prediction of Pial Collaterals using Delay and Dispersion Corrected MR Perfusion in Ischemic Stroke1University of Chicago, Chicago, IL, United States, 2University of Illinois College of Medicine, Chicago, IL, United States
Synopsis
After the onset of an ischemic stroke, blood flow may be restored to the affected territory via pial collateral blood vessels. In this study we investigate whether delay and dispersion corrected MR DSC perfusion can accurately measure the additional blood flow to estimate pial collaterals. The percent difference between non-corrected and corrected CBF is compared against measured pial collateral scores. The percent difference in CBF is found to be predictive of pial collateral scores. With more research, corrected MR DSC CBF may be used in the clinical setting for stroke patient management.
Introduction
After the onset of an ischemic stroke, blood flow may be restored to the affected territory via pial collateral blood vessels1. The degree of restored blood flow and pial collateralization may reduce tissue infarction1 and change the management of the patient. In this study, we investigate whether MR perfusion can be used as a predictor of pial collaterals, instead of the invasive imaging techniques used to directly measure the amount of collateralization. We hypothesize that since current quantification of MR DSC perfusion is underestimated in the setting of ischemic stroke due to the delay and dispersion of the contrast bolus, applying a correction will better capture the delayed blood flow from pial collaterals2,3,4.Methods
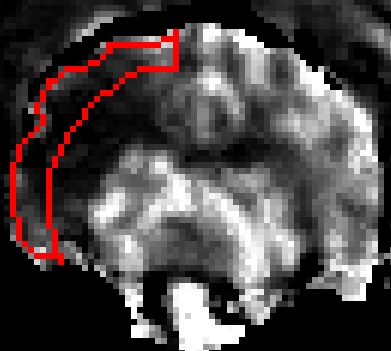
The experimental model in this study was approved by the University of Chicago Institutional Animal Care and Use Committee. Seven mongrel canines underwent permanent endovascular occlusion of the M1 segment of the middle cerebral artery. Throughout the experiment, anesthesia was maintained using isoflurane, propofol and rocuronium. Fifteen minutes after occlusion, arteriography images were acquired for scoring of pial collaterals using a previously published 11-point scoring system, where a higher score represents better collaterals5. Approximately two hours after occlusion, MR DSC and T1 Look-Locker EPI scans were acquired based on the Bookend method. Quantitative CBF was calculated with and without delay and dispersion corrections based on a previously published method3,4. The correction was made by convolving the arterial input function with an exponential dispersion model as a function of the delayed contrast arrival time and then shifted by the delay. The corrected arterial input function was then deconvolved from the tissue contrast curve by singular value decomposition. For analysis, ROIs were drawn in the cortical region (Figure 1) on the infarct side of the brain. The average CBF with and without correction, and the percent difference of CBF were used as predictors to fit an ordinal logistic regression model to predict pial collateral scores (PCS). Leave-one-out cross-validation and Lin’s concordance correlation coefficient were used to assess the performance of the model. Lin’s correlation coefficient was chosen to better estimate the deviance from the 1-to-1 perfect agreement line.Results
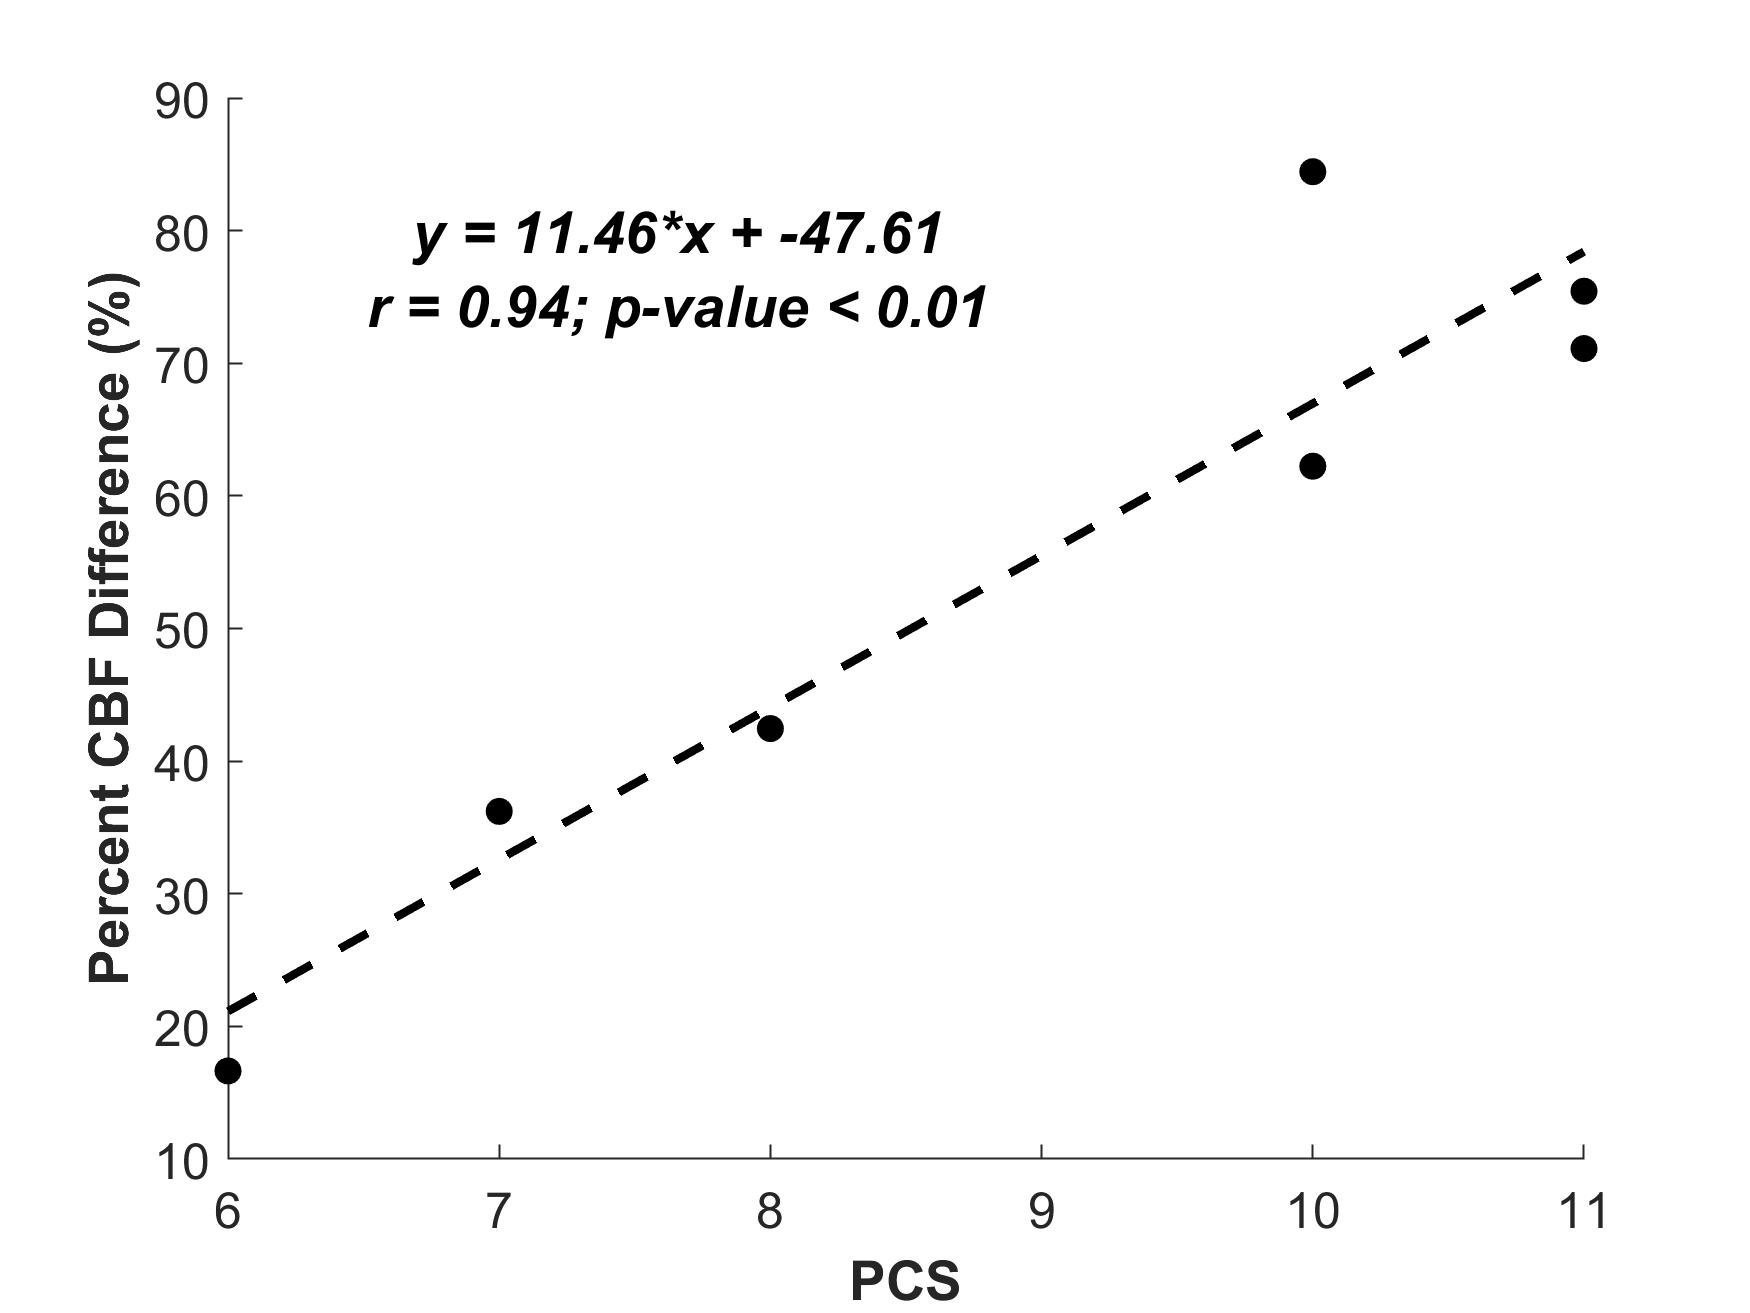
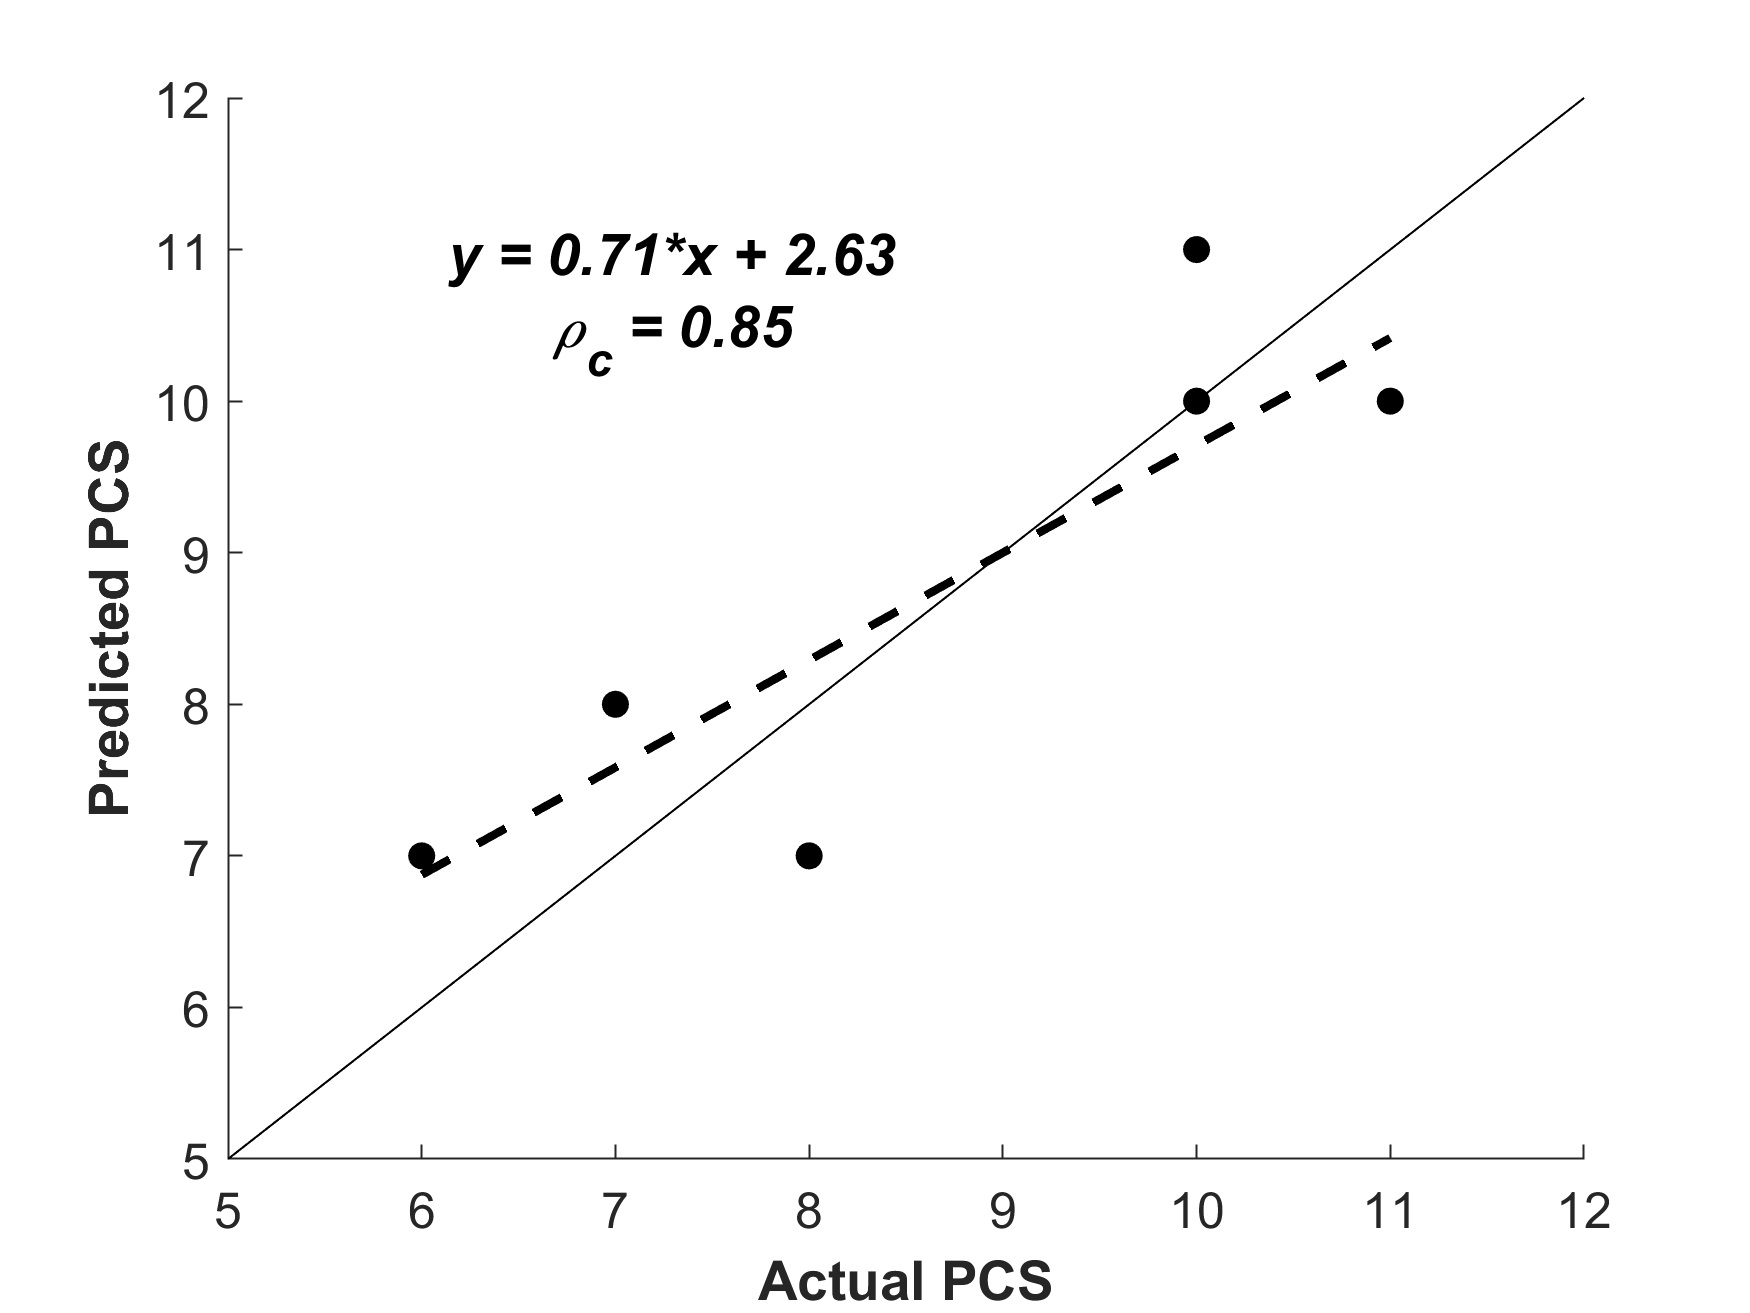
Correlation plots were examined between the predictors and pial collateral scores. An excellent correlation was observed between the percent difference in CBF and pial collateral scores with Pearson’s r of 0.94 (Figure 2). Poor correlations were seen for corrected CBF (r = 0.35) and non-corrected CBF (r = 0.24). By using leave-one-out cross-validation, the best logistic regression model resulted in the percent difference in CBF being the most significant predictor. The other parameters did not any value to the model. Between the predicted pial collateral scores and actual scores measured by a neuroradiologist, Lin’s correlation coefficient was 0.85 (Figure 3).Discussion
We observed a high correlation between the percent difference in CBF and pial collateral scores, but poor correlations for non-corrected CBF and corrected CBF. This may be attributed by inter-subject differences in CBF levels due to variations in physiological conditions. Therefore, a high pial collateral score did not necessarily mean a high absolute CBF. But rather, the greater amount of blood flow from pial collaterals was reflected as a higher percent increase in CBF captured by the delay and dispersion correction. Lastly, although we observed favorable results, a bigger sample size with a wider range of pial collaterals would be needed for a better assessment of the predictive model.Conclusion
In this study, we found that the delayed blood flow measured as corrected CBF was highly correlated to pial collateral scores and showed a good predictive model. Upon further research, delay and dispersion corrected MR perfusion could be used in clinical studies to determine its effectiveness as a tool for patient management after the onset of stroke.Acknowledgements
No acknowledgement found.References
1. Christoforidis, GA., et al. Impact of pial collaterals on infarct growth rate in experimental acute ischemic stroke. AJNR. 2017;38(2):270-275.
2. Calamante F, Willats L, Gadian DG, Connelly A. Bolus delay and dispersion in perfusion MRI: implications for tissue predictor models in stroke. MagnResonMed. 2006;55(5):1180-1185.
3. Mouannes-Srour JJ, Shin W, Ansari SA, et al. Correction for arterial-tissue delay and dispersion in absolute quantitative cerebral perfusion DSC MR imaging. MagnResonMed. 2012;68(2):495-506.
4. Jeong YI, Christoforidis GA, Saadat N, et al. Absolute quantitative MR perfusion comparison against stable‐isotope microspheres. MagnResonMed. 2019;81(6):3567–3577.
5. Christoforidis GA, Rink C, Kontzialis MS, et al. An endovascular canine middle cerebral artery occlusion model for the study of leptomeningeal collateral recruitment. Investigative radiology. 2011;46(1):34-40.
Figures