1087
The use of a DSC-MRI perfusion atlas for cerebral blood volume normalization and its impact in improving prognostic estimation.1Diagnostic Phyisics, Oslo University Hospital, Oslo, Norway, 2Universitat Politècnica de València, València, Spain, 3Oslo University Hospital, Olso, Norway, 4Hospital Universitari Vall d'Hebron, Barcelona, Spain, 5Hospital Clínic, Barcelona, Spain, 6Hospital de Manises, Manises, Spain, 7Azienda Ospedaliero-Universitaria di Parma, Parma, Italy, 8Diagnostic Physics, Oslo University Hospital, Oslo, Norway
Synopsis
In this work we present a method to improve the normalization of CBV maps by using a CBV atlas of the brain. This CBV atlas was generated using 134 non-linearly registered CBV maps from NCT03439332 clinical study. The proposed normalization method generates CBV values that better correlate with the patients’ OS, reaching smaller more significant p-values (p=0.034) based on Cox regression analysis, that better differentiate between high and low survivors (AUC=0.60, p=0.007) based on Kaplan Meier analysis.
Introduction
Cerebral Blood Volume (CBV) obtained from Dynamic Susceptibility Contrast (DSC) MRI provides valuable information for assessing brain tumor vascularity and angiogenesis1, and constitutes a prognostic factor associated with tumor aggressiveness2,3. To make CBV comparable between patients, MR scanners or scan dates4, several standardizations and normalizations techniques must be performed. Typically, the contralateral white matter area is used as reference for the normalization5. However, the vascularity across the brain is not homogeneous, nor is the magnetic field and corresponding signal response uniform across the MR image field. Therefore, normalized CBV measurements depends on the white matter region selected as reference, and especially when using smaller or slice-specific regions of interest. In this work we present a method to improve the standardization of CBV maps, by using a generic standardized CBV atlas of the brain. Additionally, we assess the impact of the proposed method in improving the prognostic potential of the CBV for glioblastoma patients.Methods
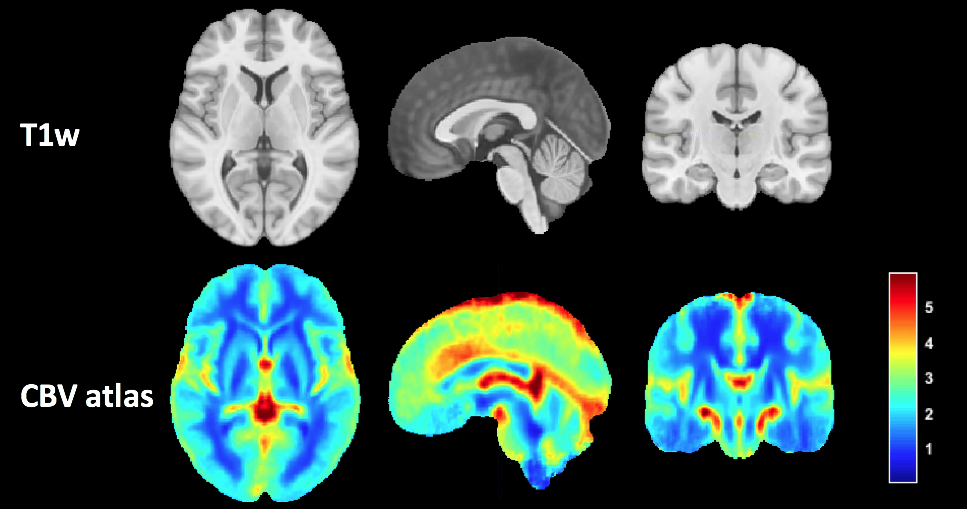
The patient cohort was compiled by the multicenter and international retrospective clinical study NCT03439332. A total of 134 cases from this dataset with MRI perfusion studies were included in the current study. All patients were diagnosed with Glioblastoma grade IV WHO with histopathological confirmation and followed Stupp standard treatment. A summary of the MRI acquisition protocol used by each center was presented in2. Quantification of rCBV and relative cerebral blood flow was performed employing standard techniques proposed in the literature 6, and processed automatically using the ONCOhabitats services7. Gamma-variate curve-fitting and Boxerman leakage correction technique 8 were used to correct for T2 and T1 leakage-effects.A CBV atlas was generated using the CBV maps of the patients included in the study. These maps were non-linearly co-registered with ANTS software (SyN algorithm)9 using cross correlation as a similarity metric. Finally, the atlas was calculated using the median CBV value at each voxel, excluding the areas affected by the tumor lesion for each patient. The generated atlas is accessible at https://github.com/eliesfuster/cbv_atlas.
The proposed method for the standardization of CBV maps consists of 3 stages: 1) divide the patient's CBV map (registered to the same space of the atlas) by the CBV atlas, 2) obtain the median value of the resulting map in the contralateral white matter, and 3) use the value obtained in step 2 to normalize the patient's CBV map.
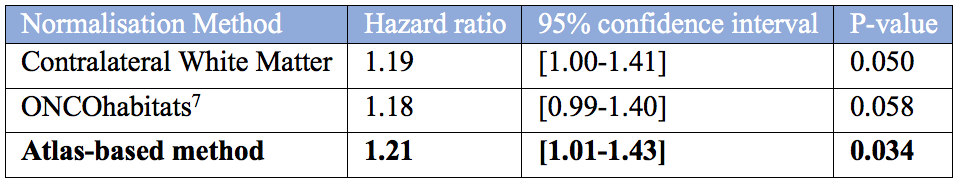
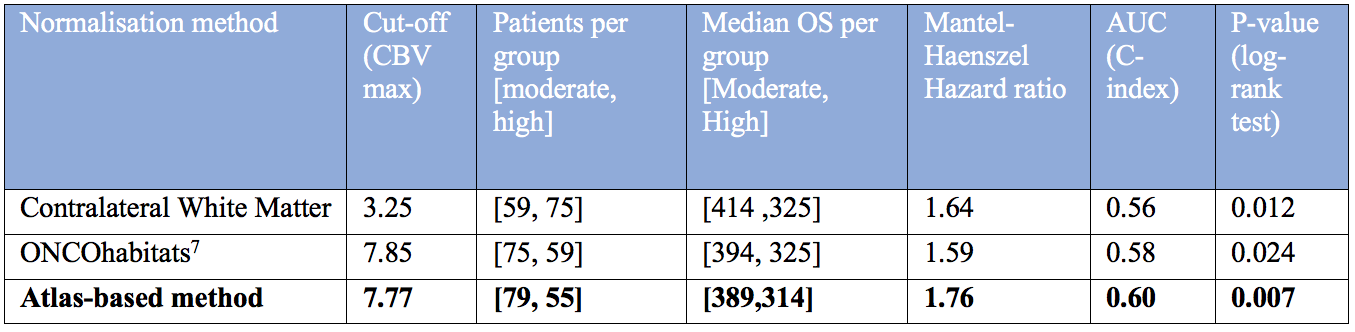
To assess the impact of the proposed method for improving the prognostic potential of normalized CBV values, we used a uniparametric Cox regression model as well as Kaplan Meier survival analysis with an optimized threshold based on the C-index. We compared the obtained results with the most established normalization method (i.e. against contralateral white matter)10 and with the normalization used by automatic analysis systems based on convolutional neural networks7. The CBV prognostic variable was defined as the 90 percentile of the CBV in the enhancing tumor.
Results
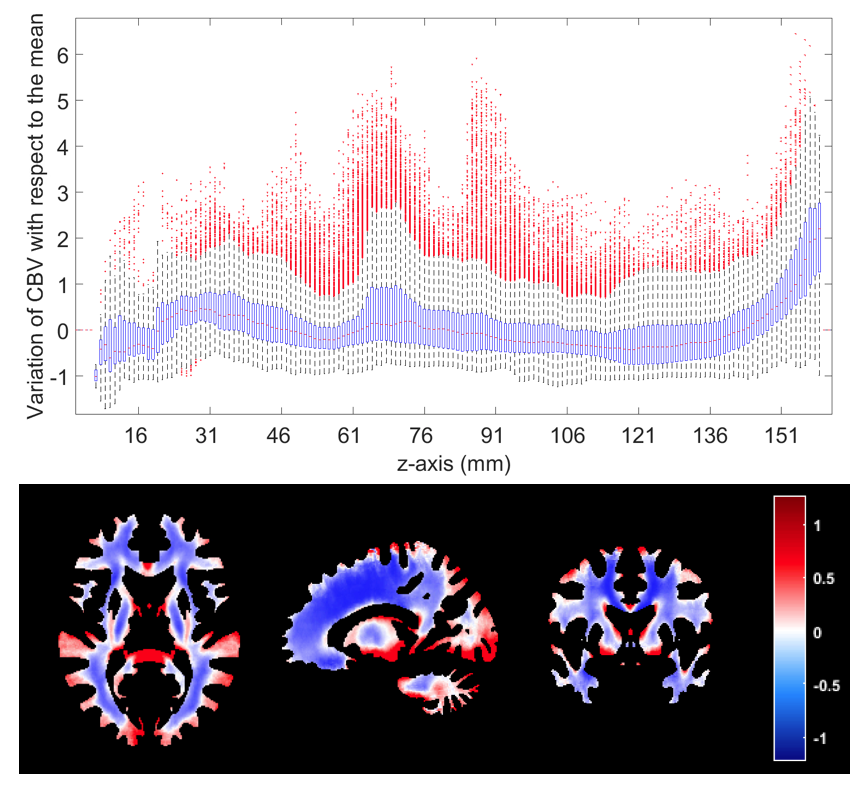
Figure 1 shows the proposed CBV atlas and associated T1-weighted MRI. Figure 2 shows the variability in the CBV along the white matter, showing particularly high and low values at the upper and lower axial slices, respectively. Results of Cox's analysis (Table 1) show that the proposed method generates CBV values that better correlate with the patients’ OS, by being the only method with a significant Hazard ratio. Similarly, when performing Kaplan Meier analysis (see Table 2), the proposed method generates CBV values that were capable of differentiating between high and low survivors (higher AUC, lower p-value, higher Mantel-Haenszel Hazard ratio) at the P<0.01-level.Discussion
Our results show that the proposed method outperforms the typical methods for CBV normalization proposed in the literature, based on selecting a contra-lateral white matter region of the brain, without considering the inhomogeneities in vascular distribution across the white matter. We consider that this method may be of particular interest in those cases where the FOV of the DSC sequence does not cover the whole brain, because they can be more sensitive to variations in the vascularity of the white matter.Conclusion
This study concludes that the normalization of the CBV based on a vascularity atlas can improve the prognostic capacity of this marker.Acknowledgements
This work was partially supported by: The European Research Council (ERC) under the European Union’s Horizon 2020 (Grant Agreement No 758657), the South-Eastern Norway Regional Health Authority Grants 2017073 and 2013069, the Research Council of Norway Grants 261984 (KEE). EFG was supported by the European Union’s Horizon 2020 research and innovation programme under the Marie Skłodowska-Curie grant agreement (No 844646).References
1. Thompson, G., Mills, S. J., Coope, D. J., O’connor, J. P. B. & Jackson, A. Imaging biomarkers of angiogenesis and the microvascular environment in cerebral tumours. Br J Radiol 84, S127–S144 (2011).
2. Álvarez-Torres, M. D. M. et al. Robust association between vascular habitats and patient prognosis in glioblastoma: An international multicenter study. J Magn Reson Imaging (2019) doi:10.1002/jmri.26958.
3. Fuster-Garcia, E. et al. Improving the estimation of prognosis for glioblastoma patients by MR based hemodynamic tissue signatures. NMR in Biomedicine 31, (2018).
4. Ellingson, B. M. et al. Comparison between intensity normalization techniques for dynamic susceptibility contrast (DSC)-MRI estimates of cerebral blood volume (CBV) in human gliomas. J Magn Reson Imaging 35, 1472–1477 (2012).
5. Boxerman, J. L. et al. Consensus recommendations for a dynamic susceptibility contrast MRI protocol for use in high-grade gliomas. Neuro Oncol 22, 1262–1275 (2020).
6. Knutsson, L., Ståhlberg, F. & Wirestam, R. Absolute quantification of perfusion using dynamic susceptibility contrast MRI: pitfalls and possibilities. MAGMA 23, 1–21 (2010).
7. Juan-Albarracín, J., Fuster-Garcia, E., García-Ferrando, G. A. & García-Gómez, J. M. ONCOhabitats: A system for glioblastoma heterogeneity assessment through MRI. International Journal of Medical Informatics 128, 53–61 (2019).
8. Boxerman, J. L., Schmainda, K. M. & Weisskoff, R. M. Relative cerebral blood volume maps corrected for contrast agent extravasation significantly correlate with glioma tumor grade, whereas uncorrected maps do not. AJNR Am J Neuroradiol 27, 859–867 (2006).
9. Avants, B. B. et al. A reproducible evaluation of ANTs similarity metric performance in brain image registration. Neuroimage 54, 2033–2044 (2011).
10. Wetzel, S. G. et al. Relative cerebral blood volume measurements in intracranial mass lesions: interobserver and intraobserver reproducibility study. Radiology 224, 797–803 (2002).
Figures