1086
Short-term reproducibility of cerebral metabolism using magnetic resonance imaging
Ulrich Lindberg1, Signe Sloth Madsen2, Karsten Skovgaard Olsen2, Kirsten Møller2,3, Mohammad Sohail Asghar2, Henrik Bo Wiberg Larsson1,3, and Mark Bitsch Vestergaard1
1Department of Clinical Physiology, Nuclear Medicine and PET, Rigshospitalet, Copenhagen, Denmark, 2Department of Neuroanaesthesiology, Rigshospitalet, Copenhagen, Denmark, 3Department of Clinical Medicine, University of Copenhagen, Copenhagen, Denmark
1Department of Clinical Physiology, Nuclear Medicine and PET, Rigshospitalet, Copenhagen, Denmark, 2Department of Neuroanaesthesiology, Rigshospitalet, Copenhagen, Denmark, 3Department of Clinical Medicine, University of Copenhagen, Copenhagen, Denmark
Synopsis
The aim of this study was to investigate the short-term physiological variation in global cerebral perfusion, oxygen consumption and metabolite concentration, measured by MRI. Global cerebral oxygen consumption as well as N-acetyl-aspartate concentration remain stable over a one-week period. Global cerebral perfusion and lactate concentration was correlated, though showed decreasing within-subject correlation with increasing delay between scan session during the one-week follow-up period. These results should be carefully considered when performing longitudinal studies. In conclusion MRI does provide robust reliable measurements of global cerebral metabolism.
Introduction
Non-invasive measurement of cerebral physiology and metabolism constitute important diagnostic information in a broad variety of neurological diseases. Cerebral metabolism has been found to be impacted both negatively and positively in a wide range of neurological conditions, such as multiple sclerosis,1 Alzheimer's dementia,2 and small and large brain vessel disease.3 The use of physiological measurements in a clinical setting, therefore, rely on accurate and reproducible techniques. The aim of this study was to investigate the physiological variation of global cerebral blood flow (gCBF), global cerebral oxygen consumption (gCMRO2) and metabolite concentrations (N-acetyl-aspartate (NAA) and lactate) within-subjects during a one-week period.Methods
Ten healthy subjects (5 females, mean age 25.4 years (range 18-35 years)) underwent MRI four times on three different days (6 hours, 1 day and 7 days after the initial session) during similar physiological state through sessions. All subjects adhered to identical schedules regarding the order and time of day for each scan. All scans were acquired on a 3T Philips (Philips Medical Systems, Best, The Netherlands) Achieva dStream (software release 5.4.1) equipped with a 32-channel phase-array receive head coil. A sagittal three-dimensional T1-weighted high-resolution Magnetization Prepared - RApid Gradient Echo (MPRAGE) scan was acquired for brain volume estimation. Bias field correction and tissue type segmentation were carried out using FAST (FSL 5.0.11, FMRIB, Oxford, UK).4 Blood velocity in the feeding cerebral arteries was measured using single slice phase-contrast mapping (FOV = 240 x 240 mm2; voxel size = 0.75 x 0.75 x 8 mm3; TE/TR = 7.33/27.63 ms; flip angle = 10o; velocity encoding = 100 cm/s, without cardiac gating; 10 dynamics). Each feeding artery was manually delineated using in-house developed MATLAB scripts and the resulting flow was converted to cerebral perfusion by normalising to brain weight of total grey and white matter volume assuming a brain tissue density of 1.05 g/ml. The susceptibility difference between venous blood and the surrounding tissue was obtained by acquiring susceptometry-based oximetry (SBO) maps using a dual-echo gradient-echo sequence (1 slice, FOV = 220 x 190 mm2; voxel size = 0.5 x 0.5 x 8 mm3; TE1/TE2 = 10.89/24.16 ms; flip angle = 30o; SENSE-factor = 2; 5 dynamics) and placing a ROI in the sagittal sinus and the surrounding tissue. The slice was placed orthogonal to the sagittal sinus where this was parallel with the main magnetic field. SBO uses the principle that difference in magnetic susceptibility between de-oxyhaemoglobin in venous blood and the surrounding tissue can be related to oxygen saturation and global cerebral metabolic rate of oxygen (CMRO2) can then be calculated using Ficks principle. Two Magnetic Resonance Spectroscopy (MRS) measurements of NAA and lactate were acquired in praecuneus and visual cortex respectively using single voxel water-suppressed point-resolved 1H-spectroscopy (TE/TR = 288/2000 ms; voxel size = 30 x 35 x 30 mm3; 176 averages). Post-processing and quantification of the spectra were performed using LCModel (LCModel [Version 6.3-1F], Toronto, Canada). NAA and lactate concentrations were corrected for T2 decay using literature values (T2,H2O = 95 ms; T2,NAA = 247 ms; T2,Lac = 240 ms).5,6Results
Global cerebral perfusion showed a small within-session bias, where subjects exhibited lower perfusion towards the end of the session compared to the beginning. The correlation between measures of perfusion decreased with increasing time between sessions (fig. 1). Global cerebral oxygen consumption, derived using Ficks principle from CBF and the venous oxygen extraction, remained unchanged over time (fig 1.). NAA showed persistent significant correlation between all sessions whereas lactate showed decreasing correlation with time (fig. 2).Discussion
Our results demonstrate that the measurement of cerebral metabolism is highly correlated within subjects, though with a generally decreasing correlation with increasing time. This emphasises the importance of controlling the timing of measurements when conducting longitudinal research studies. Furthermore, accurate and reproducible measures of the cerebral metabolism is possible using MRI with measurement errors being lower than between subject variation. These results only apply to the short-term variation and do not necessarily extrapolate to long-term variations of weeks, months and even years.Conclusion
Cerebral metabolism can be robustly measured using MRI. Some physiological variation was found, showing decreasing within-subject correlation with increasing delay between scan session within the one-week period.Acknowledgements
No acknowledgement found.References
- Mahad DH, Trapp BD, Lassmann H. Pathological mechanisms in progressive multiple sclerosis. Lancet Neurol. 2015;14(2):183-193.
- Butterfield DA, Halliwell B. Oxidative stress, dysfunctional glucose metabolism and Alzheimer disease. Nat Rev Neurosci. 2019;20(3):148-160.
- Hashimoto T, Yokota C, Koshino K, et al. Cerebral blood flow and metabolism associated with cerebral microbleeds in small vessel disease. Ann Nucl Med. 2016;30(7):494-500.
- Zhang Y, Brady M, Smith S. Segmentation of brain MR images through a hidden Markov random field model and the expectation-maximization algorithm. IEEE Trans Med Imaging. 2001;20(1):45-57.
- Träber F, Block W, Lamerichs R, Gieseke J, Schild HH. 1H metabolite relaxation times at 3.0 tesla: Measurements of T1 and T2 values in normal brain and determination of regional differences in transverse relaxation. J Magn Reson Imaging. 2004;19(5):537-545.
- Madan A, Ganji SK, An Z, et al. Proton T2 measurement and quantification of lactate in brain tumors by MRS at 3 Tesla in vivo. Magn Reson Med. 2015;73(6):2094-2099.
Figures
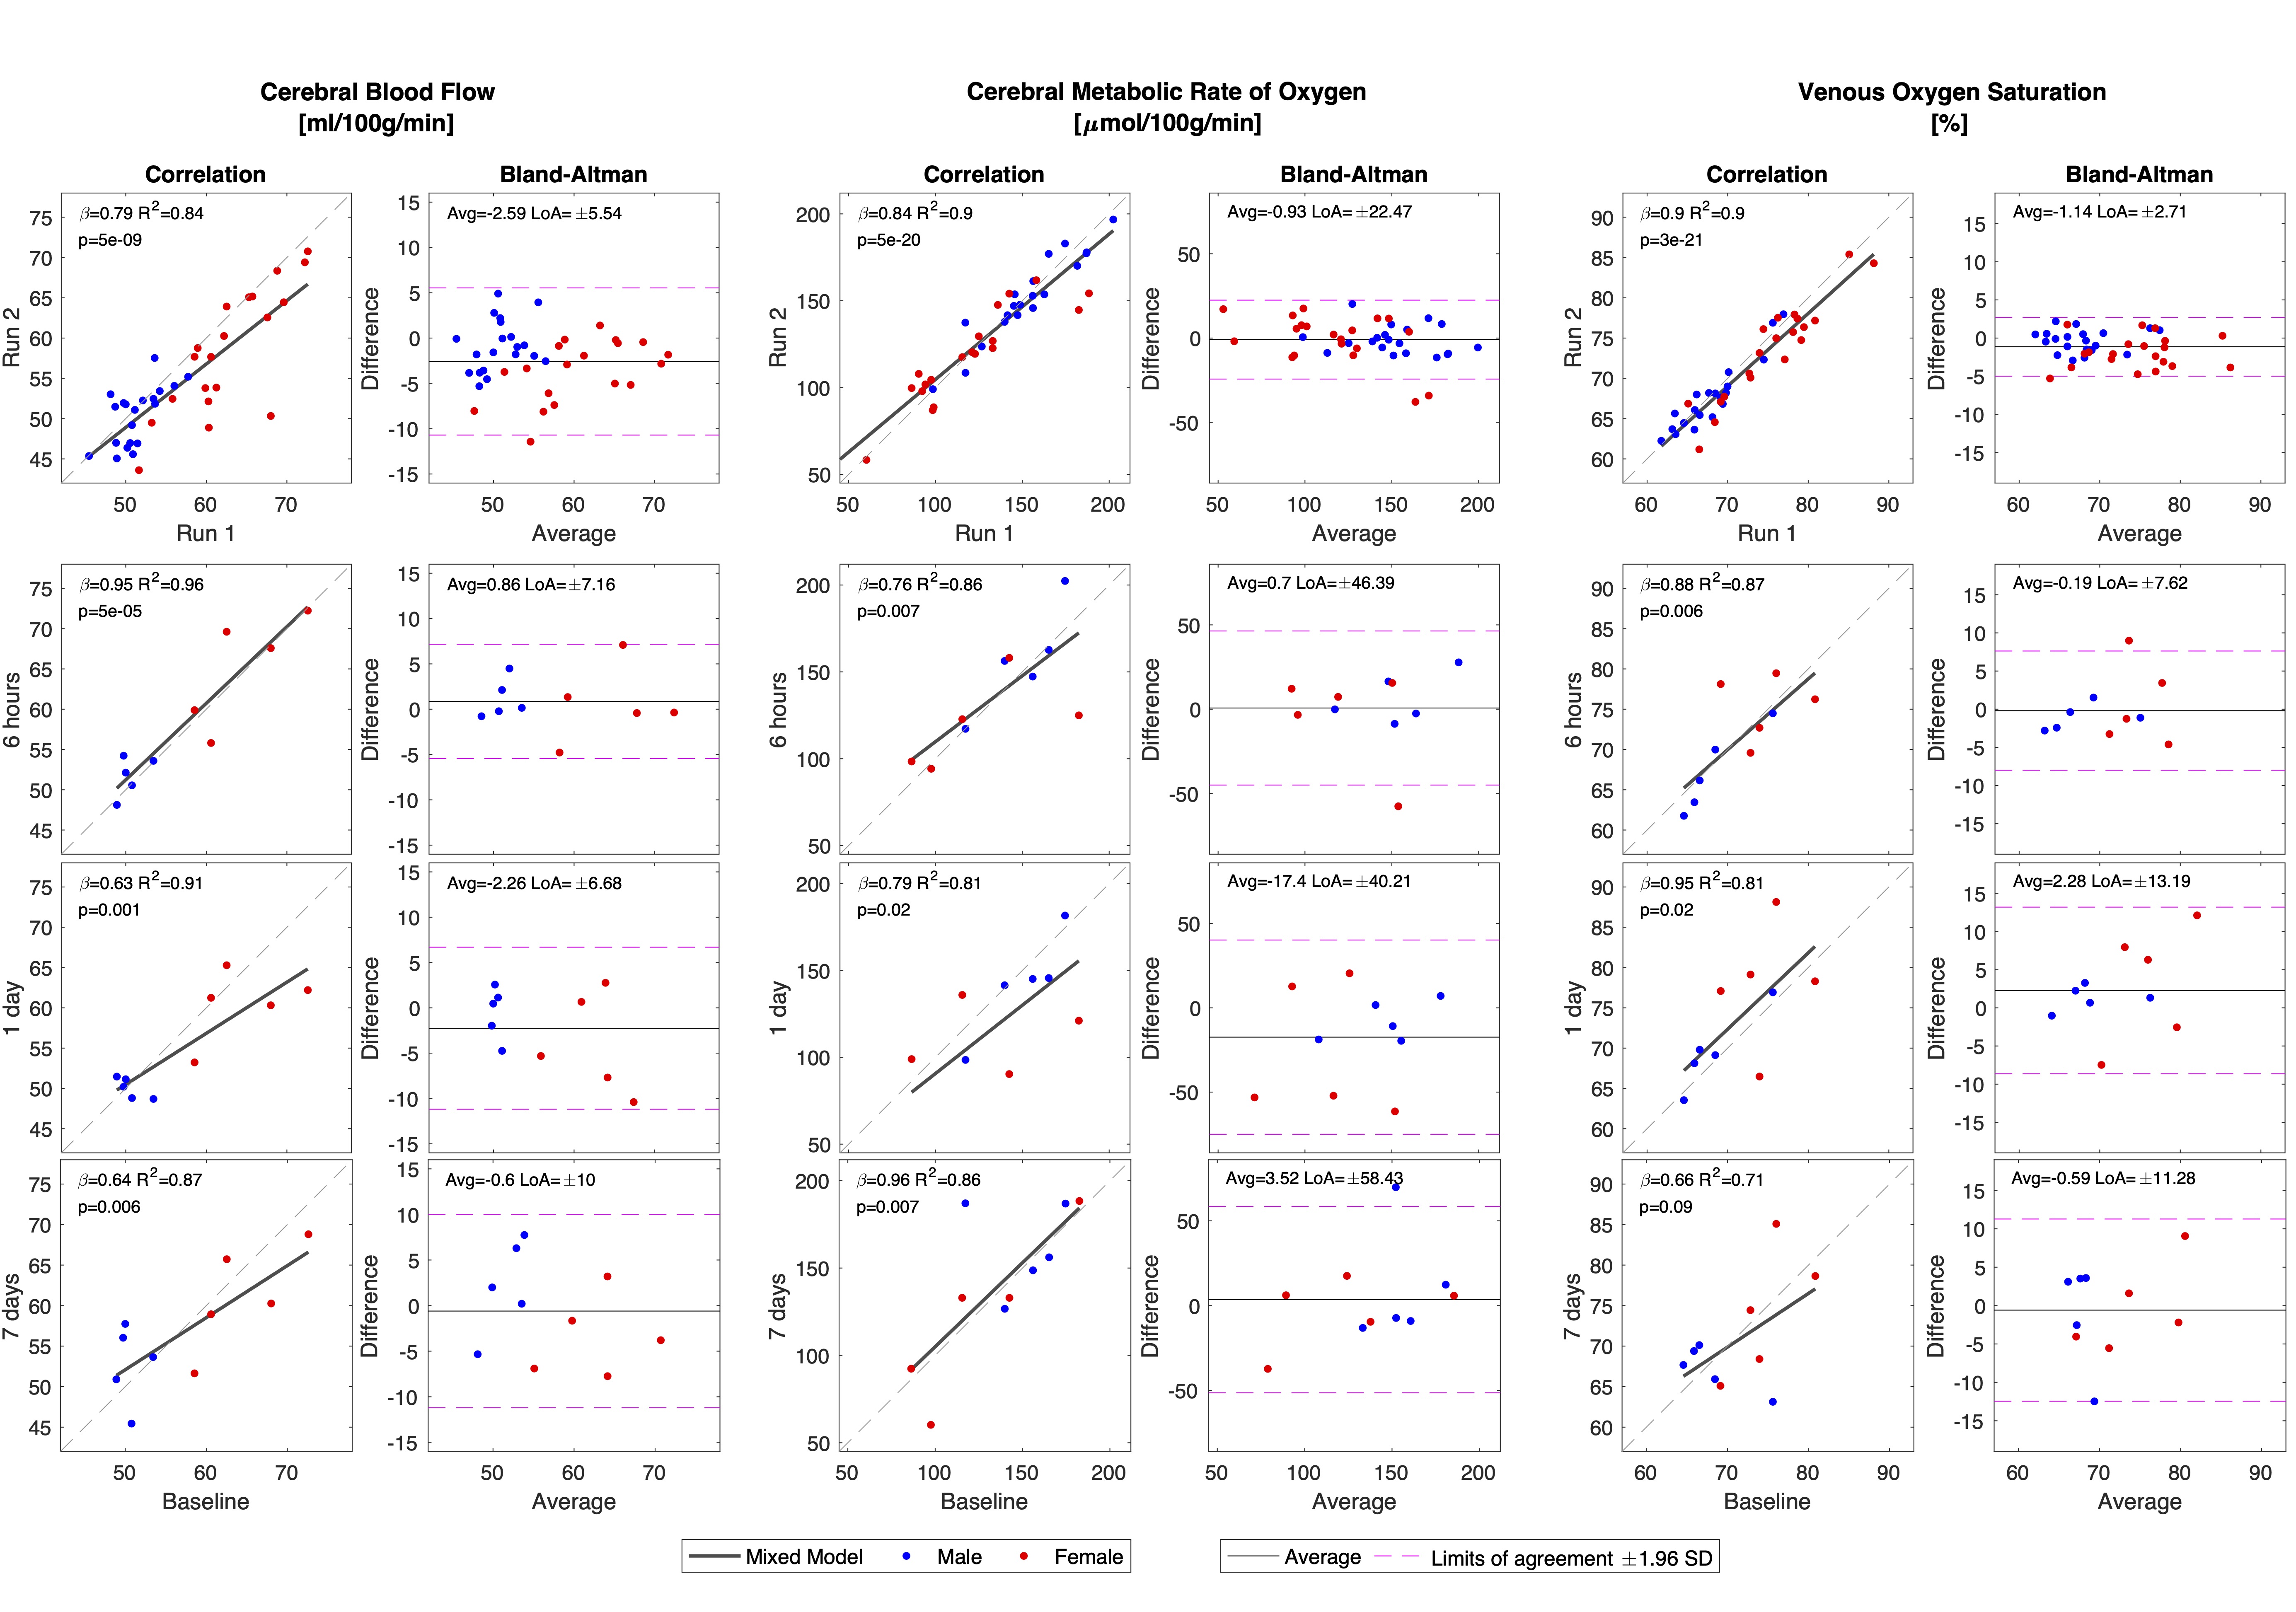
Correlations and Bland-Altman analysis of within and between session reproducibility of cerebral blood flow, cerebral metabolic rate of oxygen and venous oxygen saturation. Regressions are from a linear mixed model with subject as a random variable. Gender was not part of the regression model but highlighted for visual interpretation only. The slope (β), R2 coefficient, and p-value from the regressions and average difference (Avg) and limit of agreements (LoA) from Bland-Altman analysis are noted in each panel.
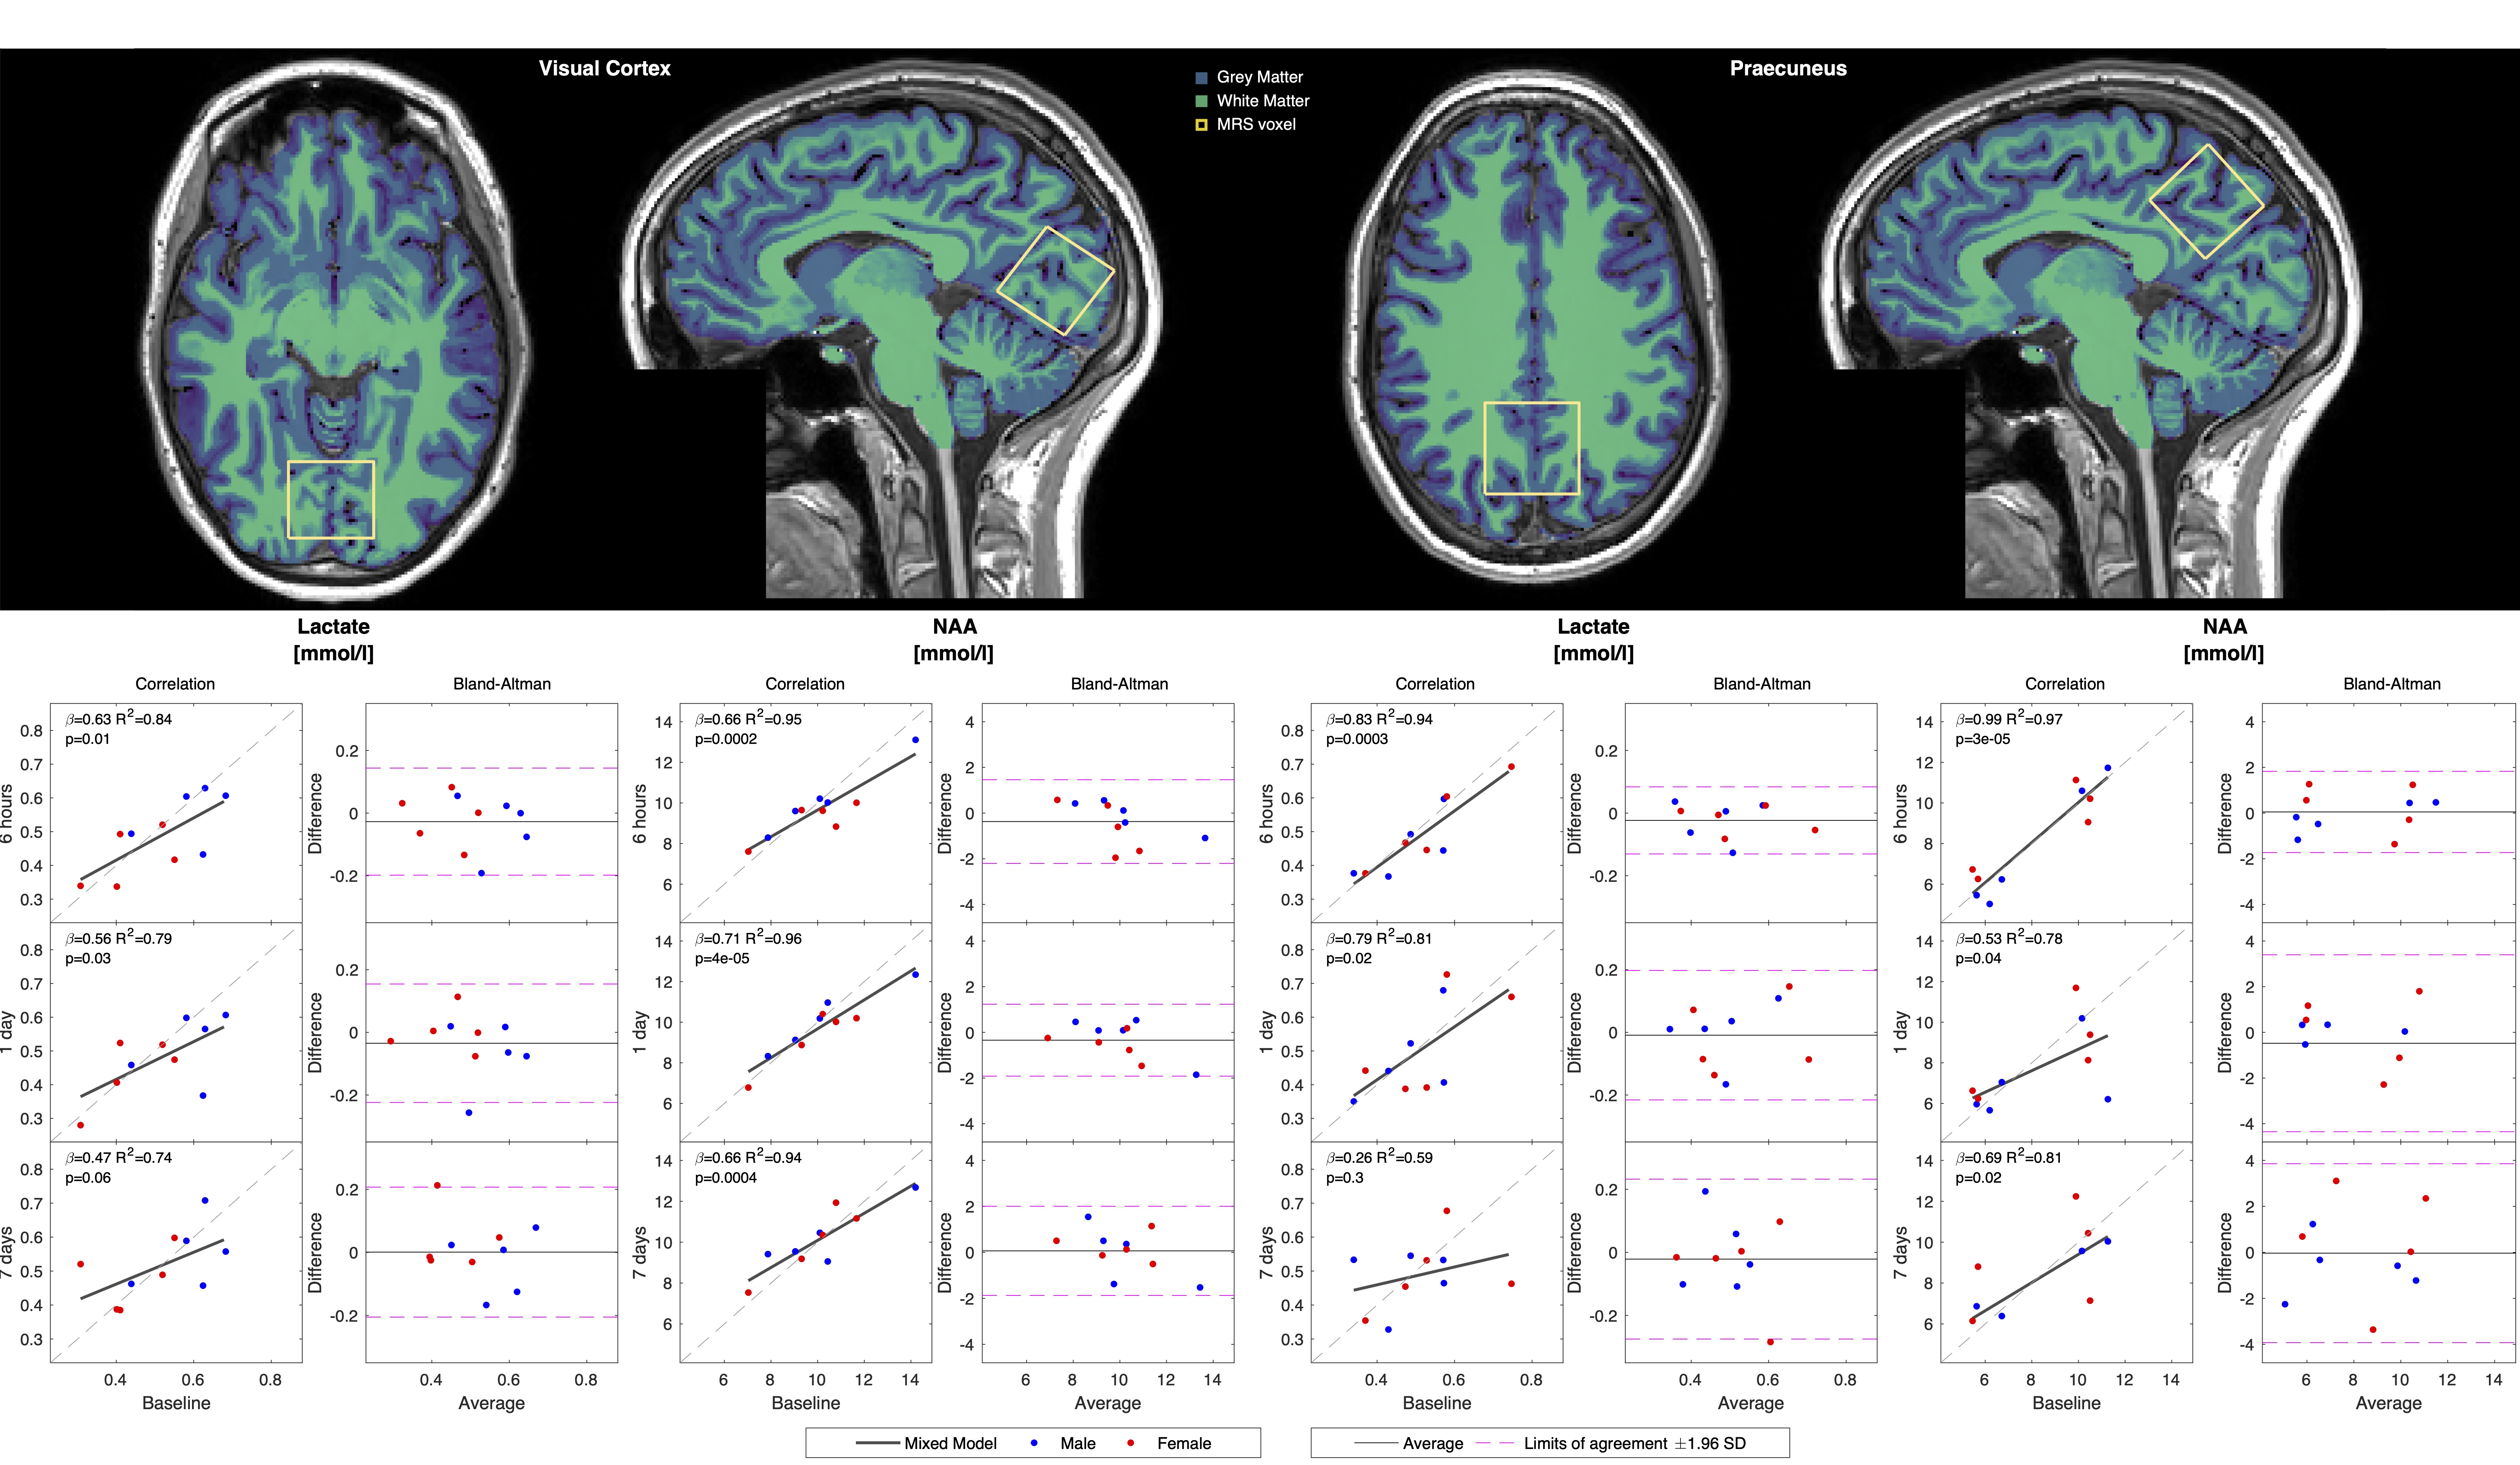
Correlations and Bland-Altman analysis of within- and between-session reproducibility of metabolite concentrations from MR spectroscopy voxels in praecuneus and visual cortex. N-acetyl-aspartate show strong correlation even after one week whereas the correlation in lactate decreases over time.