1085
High resolution BBB water exchange rate mapping with multi-delay diffusion prepared pseudo-continuous arterial spin labeling1Laboratory of FMRI Technology (LOFT), Mark & Mary Stevens Neuroimaging and Informatics Institute, Keck School of Medicine, University of Southern California, Los Angeles, CA, United States, 2Department of Neurology, University of Southern California, Los Angeles, CA, United States
Synopsis
A segmented 3D diffusion prepared pseudo-continuous arterial spin labeling (DP-pCASL) sequence is proposed to acquire high resolution whole brain map of water exchange rate (kw) across the blood-brain barrier. And a new acquisition protocol is proposed which acquires DP-pCASL signals at multiple long post-labeling delays (PLDs) and allows kw to be quantified with a robust regression step and without the need for signal division or additional physiological parameter as inputs.
Background
Assessing water exchange rate, kw, across the blood-brain barrier (BBB) could provide a sensitive biomarker of BBB function at the early stage of disease progression. A diffusion-prepared pseudo-continuous arterial spin labeling (DP-pCASL) technique has been proposed to quantify kw without the use of contrast agents [1]. The goal of this study is to achieve higher spatial resolution while effectively dealing with motion induced phase incoherence between segmented readouts. A new acquisition protocol is also proposed which acquires DP-pCASL signals at multiple post-labeling delays (PLDs) and allows kw to be quantified with a robust regression step and without the need for signal division or additional physiological parameter as inputs.Methods
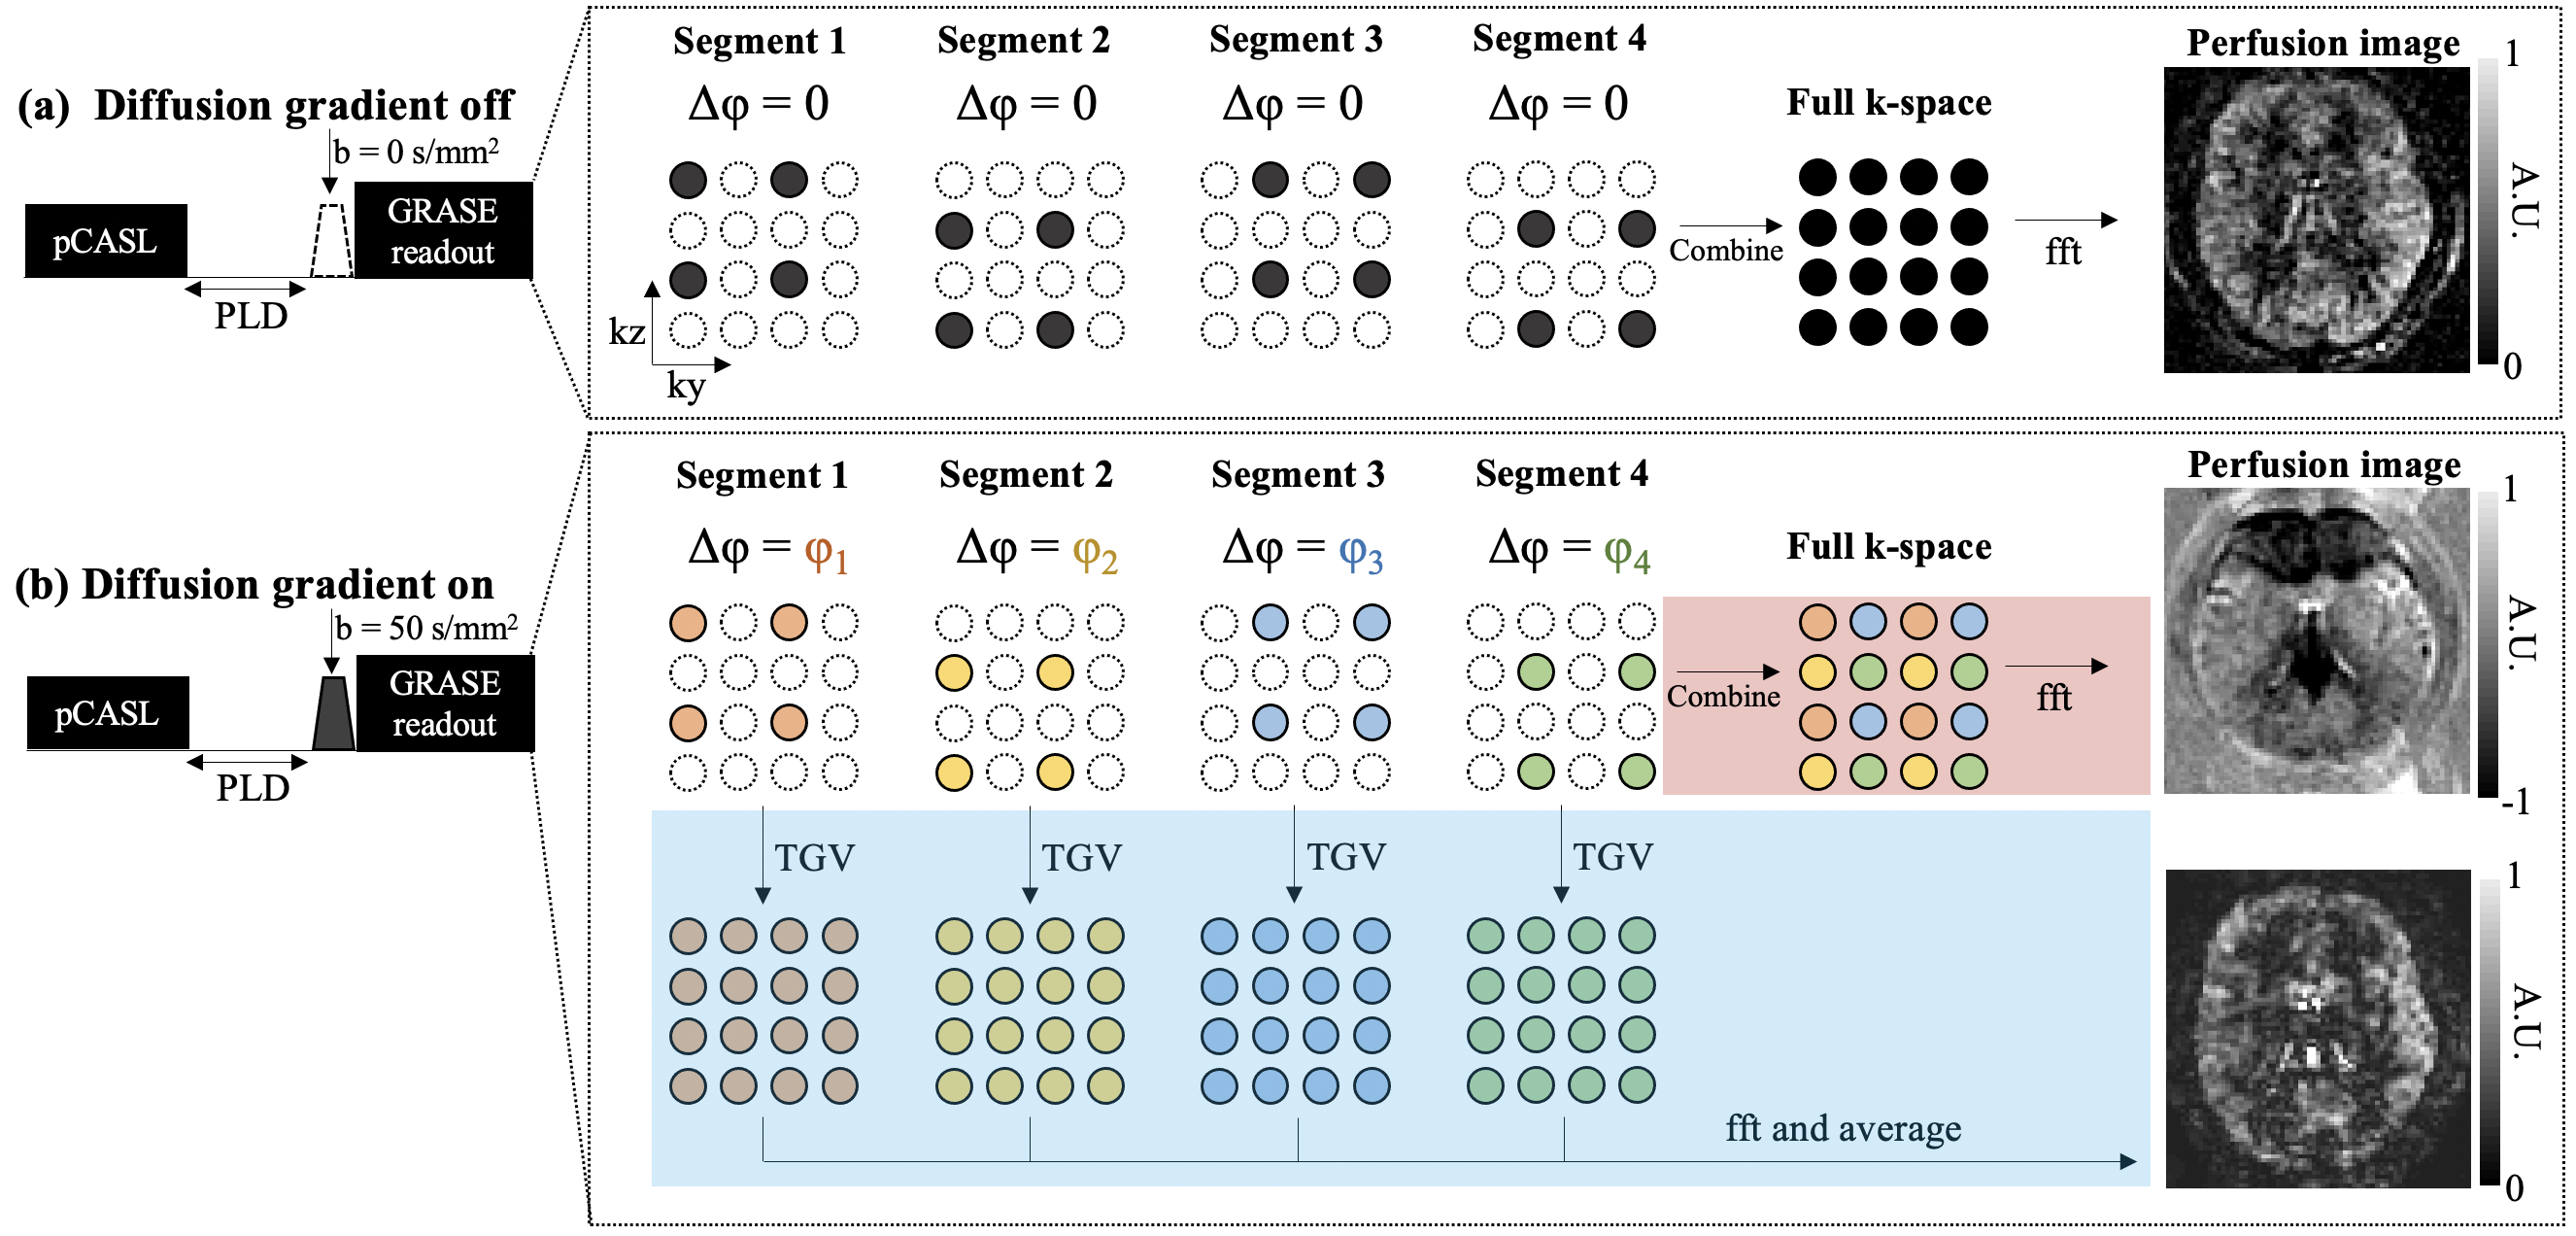
kw quantification requires estimation of the vascular (ΔMc) and tissue (ΔMb) compartments of the ASL signal. Due to the large (pseudo)-diffusion coefficients difference between two compartments (~100fold), a small diffusion weighting nulls ΔMc signal while has minimal impact on ΔMb. ΔMc can be calculated as the difference between ASL signal with (ΔMDW>0) and without (ΔMDW=0) diffusion weighting [1]. However, bulk movement (i.e., head motion) induces additional phases (Δφ) to k-space in the presence of diffusion gradients. To deal with Δφ incoherence between repetitions, a single-shot 3D GRASE readout was utilized in the previous study at the cost of lower spatial resolution (3.5×3.5×8.0mm3,12 slices) [1].In this study, we first proposed to improve the spatial resolution by acquiring k-space in four segments. As shown in Fig.1(a), Δφ=0 when diffusion gradient is off, and four segments can be combined to form a full k-space and generate perfusion images without artifacts. When diffusion gradient is on, Δφ, induced by random motion, varies between segments, and direct combination of four segments results in severe artifacts in perfusion images (Fig.1(b), red pathway). We proposed to reconstruct k-space of each segment using total-generalize-variation (TGV) regularized reconstruction [2]. Reconstructed k-space of four segments were insensitive to Δφ incoherence and can be averaged to generate perfusion images (Fig1(b), blue pathway).
In the previous study [1], kw was calculated as a function of arterial transit time (ATT), tissue T1 and capillary fraction as well as a regularized reconstruction method, which improves SNR but leads to spatial blurring. In this study we proposed a new solution to calculate kw with DP-pCASL signals acquired at multiple PLDs based on the formula of the single-pass approximation (SPA) modal [3]:
$$\Delta Mc(t)=\frac{2\varepsilon \cdot CBF\cdot M_{0}}{\lambda (kw+R_{1a})}\cdot e^{kw\cdot ATT}\cdot(e^{-(kw+R_{1a})(t-\delta )}-e^{-(kw+R_{1a})t})) ......(1)$$
where ε is labeling efficiency (0.9), λ is the partition coefficient of water in the brain (0.9g/ml), R1a is the longitudinal relaxation rate (0.6s-1), δ is labeling duration (1.5s). The unknown parameter kw can be solved from ΔMc(t) at multiple PLDs: $$$t_{i}=\delta + PLD_{i} (i=1,2,3,4)$$$. Equation (1) can be simplified by applying $$$log$$$ function to both sides:
$$log(\Delta Mc(t))=log(\frac{2\varepsilon \cdot CBF\cdot M_{0}}{\lambda (kw+R_{1a})} \cdot e^{kw \cdot ATT} \cdot (e^{(kw+R_{1a})\delta}-1) \cdot e^{-(kw+R_{1a})t})=A+S\cdot t ......(2)$$
where
$$A=log(\frac{2\varepsilon \cdot CBF\cdot M_{0}}{\lambda (kw+R_{1a})} \cdot e^{kw \cdot ATT} \cdot (e^{(kw+R_{1a})\delta}-1))......(3)$$
$$S=-(kw+R_{1a}) ......(4)$$
And
$$kw=-S-R_{1a}......(5)$$
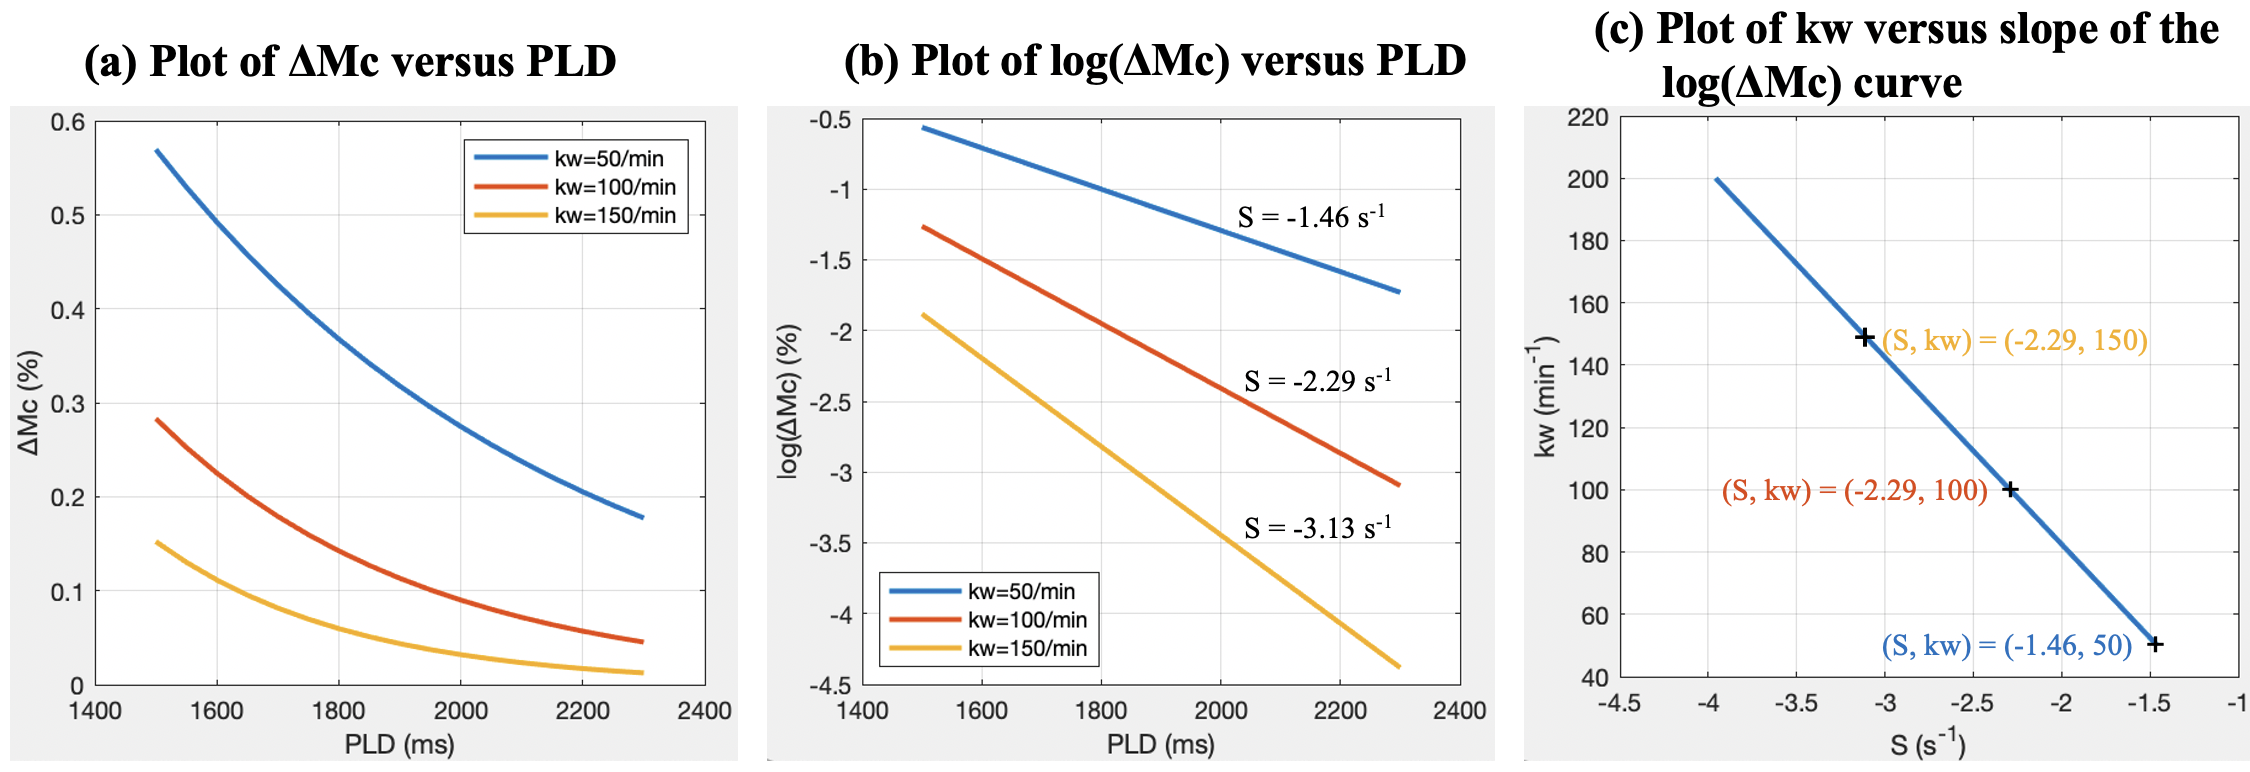
Figure 2 (a,b) shows ΔMc(t) and log(ΔMc(t)) curves with three kw values. Linear relationship between S and kw is demonstrated in Fig.2(c). kw can be calculated by estimating the slope of log(ΔMc(t)) at four PLDs.
Two healthy subjects (1male, age=24±4.2years) underwent MRI on a Siemens 3T Prisma system (Erlangen, Germany) using a 32-channel head coil. Imaging parameters were: FOV=240mm, 30 slices, resolution=2.5×2.5×3mm3, 2 segments along y/z directions, TE=19ms, TR=4300ms, labeling duration=1500ms. pCASL was acquired with b=0 and 50s/mm2 at four PLDs=1600, 1800, 2000 and 2200ms, respectively. Twelve label/control pairs were acquired for each b value/PLD, TA=13min46sec.
Results and discussion
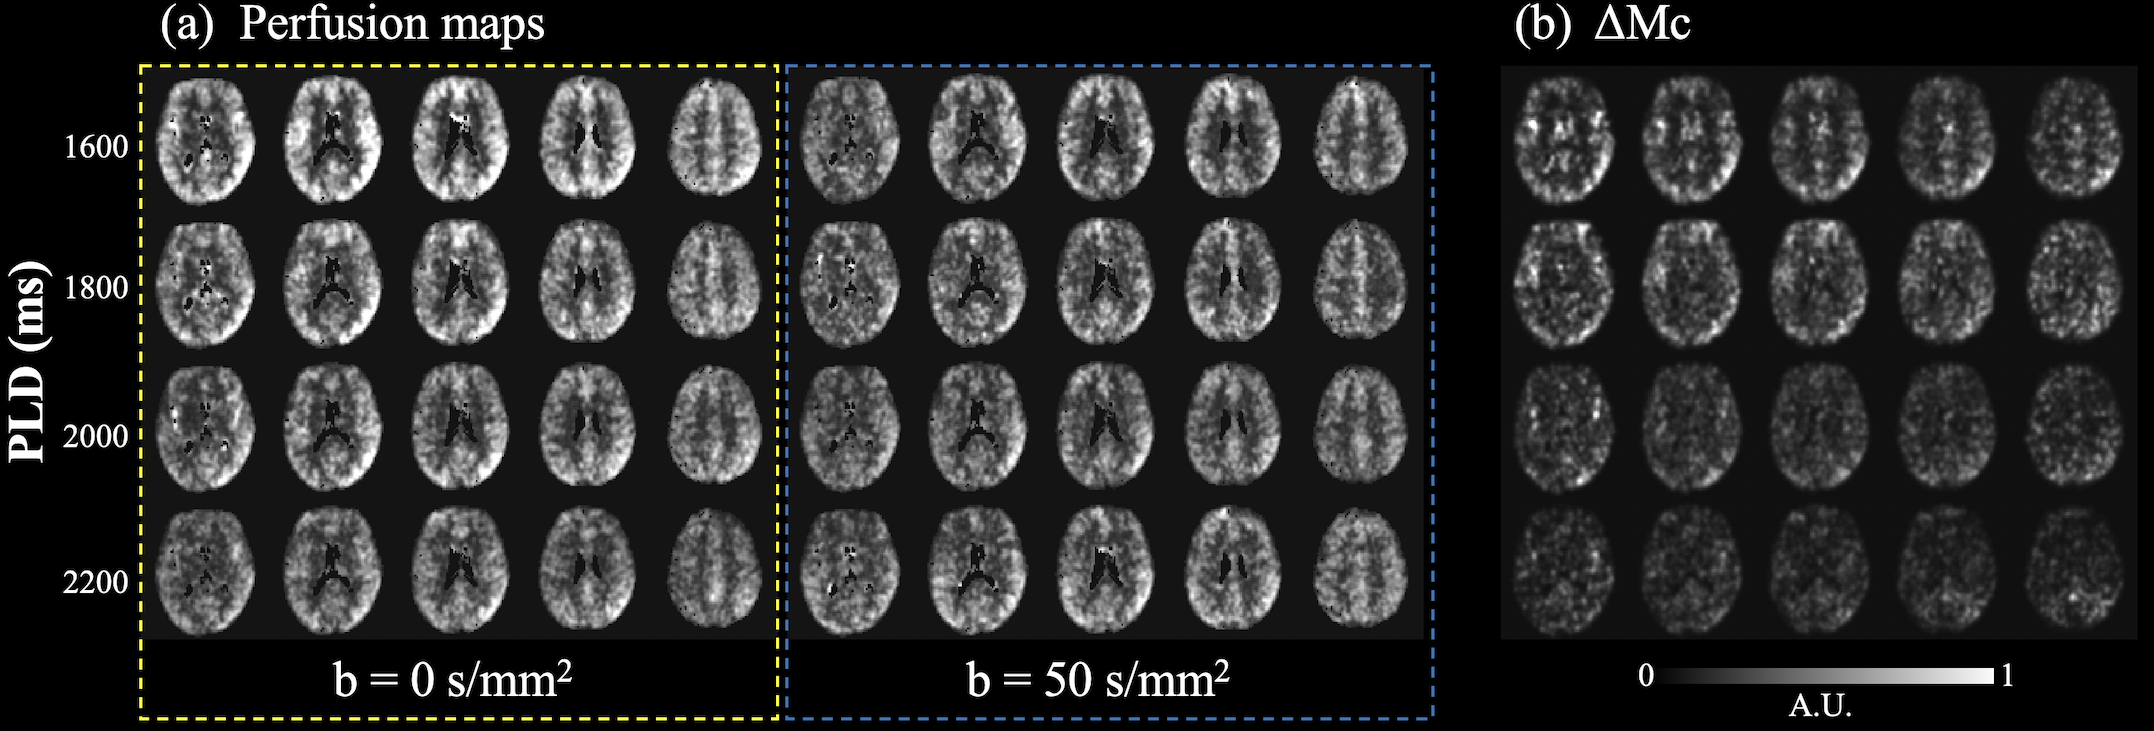
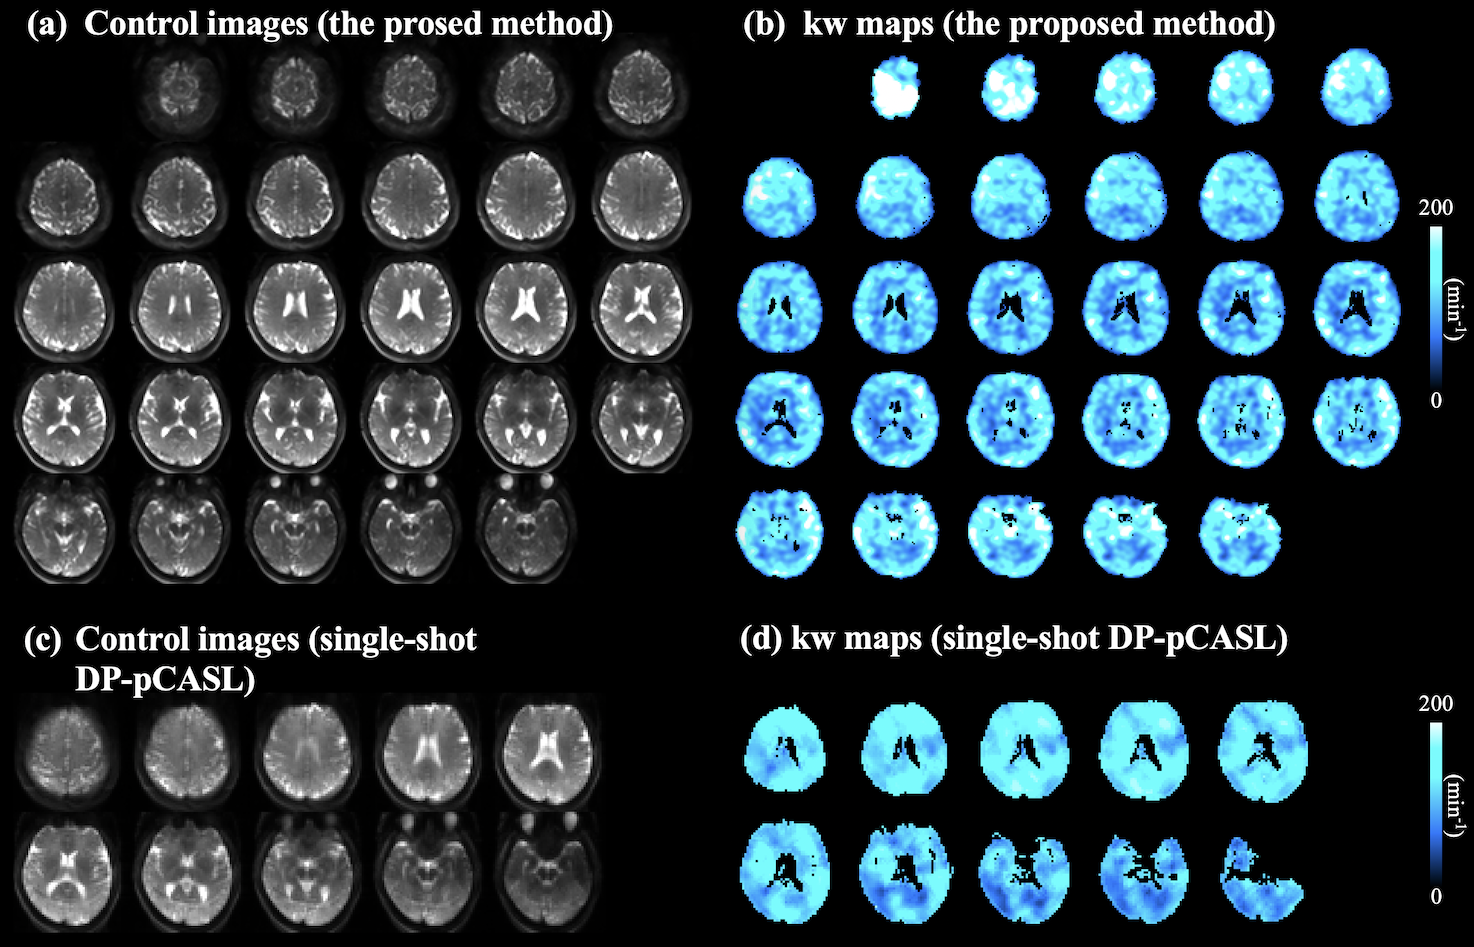
Figure 3 (a) shows five slices of perfusion maps at four PLDs (row 1-4) with (ΔMDW>0, blue box) and without (ΔMDW=0, yellow box) diffusion weighting. ΔMDW=0 (or ΔMb+ΔMc) signal decreased at longer PLDs due to longitudinal relaxation, and decay of ΔMDW>0 (or ΔMb) was slower due to more labeled spins exchanged into tissue space. Figure 3 (b) shows corresponding five slices of ΔMc maps. ΔMc signal decreased at longer PLDs, which also indicates labeled spins left capillary space and exchanged into tissue space. Whole brain average vascular fraction of the ASL signal was 25.5±3.5, 18.5±4.9, 17.0±4.2 and 11.5±0.7% at PLD=1600, 1800, 2000 and 2200 ms respectively.Figure 4 (a,b) shows thirty axial slices of control and kw images obtained from the proposed method, and figure 4 (c,d) shows ten axial slices of control and kw images obtained from our previous single-shot DP-pCASL with regularized kw reconstruction. Good agreement can be observed between two kw maps. Whole brain average kw was 121.1 and 137.5 min-1 with the proposed and single-shot DP-pCASL method. The proposed method generates kw map with higher spatial resolution and more slices with a slight increase in scan time (13 versus 10 mins). Other advantages of the proposed method include no need for additional physiological parameters (i.e., ATT or tissue T1) and simple yet robust estimation method (linear regression).
Conclusion
We proposed to acquire high resolution whole brain kw map with a segmented 3D DP-pCASL sequence while effectively dealing with motion induced phase incoherence. Water exchange rate kw was quantified from capillary compartment signal evolutions at multiple PLDs, which doesn’t require regularized model fitting or additional physiological parameter inputs.Acknowledgements
This work was supported by National Institute of Health (NIH) grant UH3-NS100614, R01-NS114382 and R01-EB028297.References
[1] Shao, Xingfeng, et al. "Mapping water exchange across the blood–brain barrier using 3D diffusion‐prepared arterial spin labeled perfusion MRI." Magnetic resonance in medicine 81.5 (2019): 3065-3079.
[2] Spann, Stefan M., et al. "Robust single-shot acquisition of high resolution whole brain ASL images by combining time-dependent 2D CAPIRINHA sampling with spatio-temporal TGV reconstruction." NeuroImage 206 (2020): 116337.
[3] St. Lawrence, Keith S., Daron Owen, and Danny JJ Wang. "A two‐stage approach for measuring vascular water exchange and arterial transit time by diffusion‐weighted perfusion MRI." Magnetic resonance in medicine 67.5 (2012): 1275-1284.
Figures