1082
Characterization of Microcirculatory Regulation in Skeletal Muscle using Wavelet Coherence Analysis of Resting-State BOLD MRI
Jingting Yao1, Benjamin Risk1, Marijn Brummer1, Adam Daniel Singer1, Jeanie Park1, and David Reiter1
1Emory University, Atlanta, GA, United States
1Emory University, Atlanta, GA, United States
Synopsis
Microcirculatory regulation in the musculoskeletal system ensures tissue oxygenation and nutrient supply that are essential for maintaining normal muscular functions. BOLD MRI-derived mapping indices M0 and T2* have previously been established as markers of blood volume and blood oxygenation in healthy subjects. This study assesses dynamic resting-state microcirculation in the calf of healthy subjects using the wavelet coherence analysis, a time-frequency approach. Quantitative wavelet-based metrics characterizing the dynamic relationship between M0 and T2* may serve as markers of blood perfusion control and useful for characterizing degraded peripheral microvascular control in diseased population.
Introduction
Microvascular blood flow regulation is a dynamic process that is essential for maintaining normal skeletal muscle function. Time-frequency analysis of optically-derived peripheral microvascular blood flow dynamics has defined frequency bands associated with specific sources of microvascular control (table 1).[1, 2] These have been demonstrated to be sensitive to degradation of microcirculatory control in the extremities of patients with cardiovascular[3, 4] and metabolic disease.[2, 5] Assessing microcirculation in resting-state skeletal muscle with imaging is currently underdeveloped but holds the potential for a more detailed characterization of skeletal muscle perfusion involvement in diseases that relate to microcirculatory impairment. Previous work using BOLD MRI in exercising skeletal muscle demonstrates changes in quantitative parameters M0 and T2* that reflect changes in blood volume and oxygenation, respectively.[6] The dynamic relationship between M0 and T2* may be useful for probing microvascular function with diseases, as the microvascular structure is degraded and vessel diameter is decreased in diseased conditions,[7] leading to a reduction of red blood cells in smaller vessels and concomitantly reduced tissue oxygenation.[8] Cross-wavelet coherence analysis can quantify the linear correlation between two time-varying quantities and identify time-localized oscillatory behavior common between two time-series.[9, 10] This analytical approach has been applied to study associations between cerebral blood pressure and blood oxygenation,[11] and between peripheral blood flow and blood oxygenation.[12] The current study investigates the spectral power and dynamic relationship between instantaneous oscillations in M0 and T2*. Reduced coherence between M0 and T2* with degradation of the microcirculatory system is expected to reflect an uncoupling of resting blood flow regulation and tissue oxygenation.Methods
Resting-state BOLD MRI was acquired from the calf of five healthy subjects (3 females, 3415 y.o.) using a 3 Tesla Siemens MAGNETOM Prisma Fit. For each subject, a single-slice dual-echo gradient-echo BOLD image was captured with 4096 dynamics, TR = 100 ms, TE1 = 15 ms, TE2 = 36 ms, and an image voxel size 2.2 x 2.2 x 8 mm. MRI data were preprocessed following a standard pipeline including motion correction, magnetic susceptibility distortion correction, and coregistration. Dual-echo imaging data were fit to average signal intensities from regions of interest at each dynamic to obtain time-series of M0 and T2* values for each subject. The individual region of interest was selected near the boundary of gastrocnemius muscle with a fixed coverage. Non-physiological signal drift was removed from time-series data using a quadratic de-trending step. Wavelet coherence[13] was performed on preprocessed M0 and T2* time-series and uncertainty analysis was computed on coherence results using a Monte Carlo approach previously described.[11, 14] These analyses were implemented using a MATLAB-based toolbox.[9] Coherence was quantified based on the percentage of significant coherence, a wavelet-based metric defined as percentage of time during which the squared cross-wavelet coherence reached a significance level of p < 0.05 at each wavelet frequency. This measure reflects the overall degree to which M0 and T2* are linearly correlated at each frequency. Coherence phase (Δφ) obtained in the cross-wavelet time-frequency spectrum (graphically represented with arrows in Figures 1 and 2) indicate the relative leading/lagging relationship between M0 and T2*. Phase angles were grouped by the following four quadrant ranges: 1) Δφ = 0 ± π/4 reflecting mostly in-phase coherence between M0 and T2*, 2) Δφ = π ± π/4 reflecting mostly anti-phase coherence, 3) Δφ = π/2 ± π/4 and 4) Δφ = −π/2 ± π/4. Intra-subject repeatability of coherence measures was performed on all subjects using Bland Altman analysis from two repeated BOLD acquisitions.Results & Discussion
Individuals show variations in the level and spectral regions of coherence between M0 and T2*. Figure 1 and 2 show selected results from a younger female (subject 2: 26 y.o.) and older female (subject 5: 60 y.o.) subjects. The thick black line contour and highlighted yellow regions (panels a, b, d, and e) indicate regions of significant coherence against noise (p < 0.05). These preliminary data reflect a reduction of coherence between changes in blood volume and blood oxygenation in the endothelial spectral interval, which is consistent with the well-recognized age-associated decline of endothelial function.[15]We observe a dominant anti-phase relationship between M0 and T2* for all subjects in all three frequency intervals. The mean of the percentage of significant coherence in the predefined frequency intervals is presented in figure 3, where endothelial control shows more individual variations, in contrast to the slight variation in sympathetic and intrinsic myogenic controls. These preliminary results suggest a possible age effect on coherence variability between changes in blood volume and oxygenation. Finally, a Bland Altman analysis was performed on the %significant coherence of the four phase ranges from the two repeated scans for each subject, respectively. In figure 4, all data points lie within the 95% limits of agreement, indicating the reproducibility of these measurements.
Conclusion
BOLD-derived measures of blood volume and oxygenation demonstrate coherence to a varying degree in resting-state skeletal muscle from healthy subjects. Wavelet coherence analysis could provide important imaging measures of blood microcirculation dynamics. Further work is needed to examine its sensitivity to degradation of microvascular control in healthy aging and diseases such as diabetic neuropathy and chronic kidney disease.Acknowledgements
This study was supported by an internal seed grant through Emory Radiology and Imaging Sciences.References
- Stefanovska, A., M. Bracic, and H.D. Kvernmo, Wavelet analysis of oscillations in the peripheral blood circulation measured by laser Doppler technique. IEEE Trans Biomed Eng, 1999. 46(10): p. 1230-9.
- Sun, P.-C., C.-D. Kuo, L.-Y. Chi, H.-D. Lin, S.-H. Wei, and C.-S. Chen, Microcirculatory vasomotor changes are associated with severity of peripheral neuropathy in patients with type 2 diabetes. Diabetes and Vascular Disease Research, 2012. 10(3): p. 270-276.
- Moore, J.P., A. Dyson, M. Singer, and J. Fraser, Microcirculatory dysfunction and resuscitation: why, when, and how. Br J Anaesth, 2015. 115(3): p. 366-75.
- Tripodaki, E.S., A. Tasoulis, A. Koliopoulou, I. Vasileiadis, L. Vastardis, G. Giannis, M. Argiriou, C. Charitos, and S. Nanas, Microcirculation and macrocirculation in cardiac surgical patients. Crit Care Res Pract, 2012. 2012: p. 654381.
- Hu, H.F., H. Hsiu, C.J. Sung, and C.H. Lee, Combining laser-Doppler flowmetry measurements with spectral analysis to study different microcirculatory effects in human prediabetic and diabetic subjects. Lasers Med Sci, 2017. 32(2): p. 327-334.
- Damon, B.M., J.L. Hornberger, M.C. Wadington, D.A. Lansdown, and J.A. Kent-Braun, Dual gradient-echo MRI of post-contraction changes in skeletal muscle blood volume and oxygenation. Magn Reson Med, 2007. 57(4): p. 670-9.
- Maldonado, G., R. Guerrero, C. Paredes, and C. Rios, Nailfold capillaroscopy in diabetes mellitus. Microvasc Res, 2017. 112: p. 41-46.
- Agrawal, R., T. Smart, J. Nobre-Cardoso, C. Richards, R. Bhatnagar, A. Tufail, D. Shima, P. H Jones, and C. Pavesio, Assessment of red blood cell deformability in type 2 diabetes mellitus and diabetic retinopathy by dual optical tweezers stretching technique. Scientific reports, 2016. 6: p. 15873-15873.
- Grinsted, A., J.C. Moore, and S. Jevrejeva, Application of the cross wavelet transform and wavelet coherence to geophysical time series. Nonlin. Processes Geophys., 2004. 11(5/6): p. 561-566.
- Torrence, C. and G.P. Compo, A Practical Guide to Wavelet Analysis. Bulletin of the American Meteorological Society, 1998. 79: p. 61.
- Tian, F., T. Tarumi, H. Liu, R. Zhang, and L. Chalak, Wavelet coherence analysis of dynamic cerebral autoregulation in neonatal hypoxic-ischemic encephalopathy. Neuroimage Clin, 2016. 11: p. 124-132.
- Abdulhameed, Y.A., P.V.E. McClintock, and A. Stefanovska, Race-specific differences in the phase coherence between blood flow and oxygenation: A simultaneous NIRS, white light spectroscopy and LDF study. J Biophotonics, 2020. 13(4): p. e201960131.
- Bandrivskyy, A., A. Bernjak, P. McClintock, and A. Stefanovska, Wavelet Phase Coherence Analysis: Application to Skin Temperature and Blood Flow. Cardiovascular Engineering: An International Journal, 2004. 4(1): p. 89-93.
- Lancaster, G., D. Iatsenko, A. Pidde, V. Ticcinelli, and A. Stefanovska, Surrogate data for hypothesis testing of physical systems. Physics Reports, 2018. 748: p. 1-60.
- Seals, D.R., K.L. Jablonski, and A.J. Donato, Aging and vascular endothelial function in humans. Clin Sci (Lond), 2011. 120(9): p. 357-75.
Figures
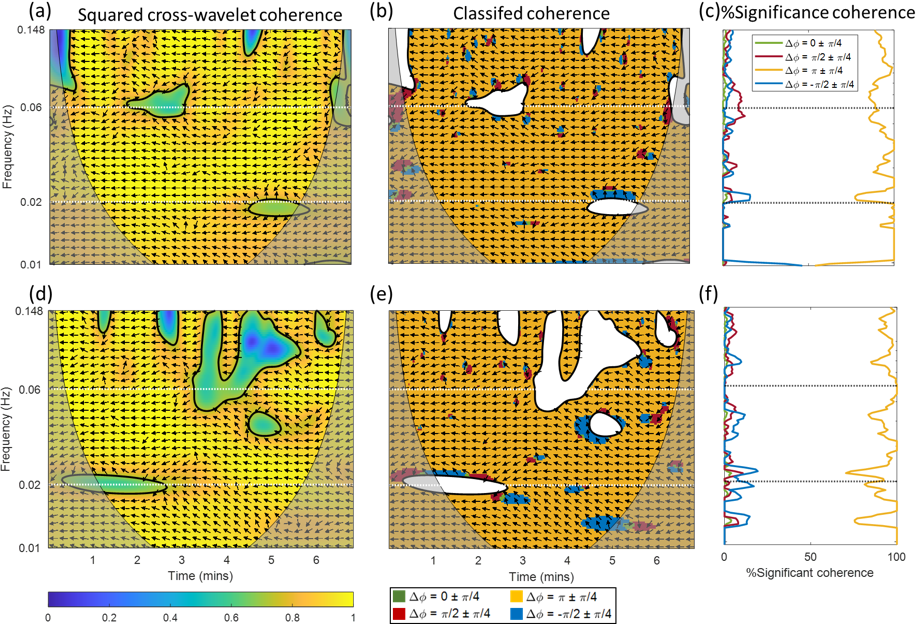
Figure 1. Wavelet analysis of the first (a – c) and repeated
(d – f) resting-state BOLD acquisitions from a 26 y.o. female. Regions in gray color outside a conical contour represent the cone of influence, where edge effects lead to lower confidence in the computed values.
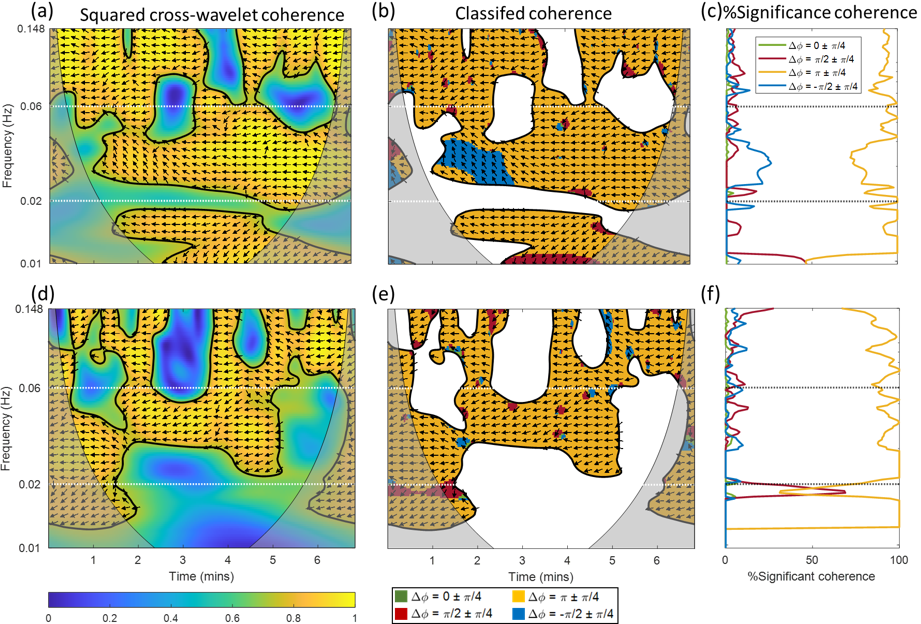
Figure 2. Wavelet analysis of BOLD MRI acquired from a 60 y.o.
female. (d) – (f) were generated from a repeated resting-state BOLD
measurement of those from (a) – (c).
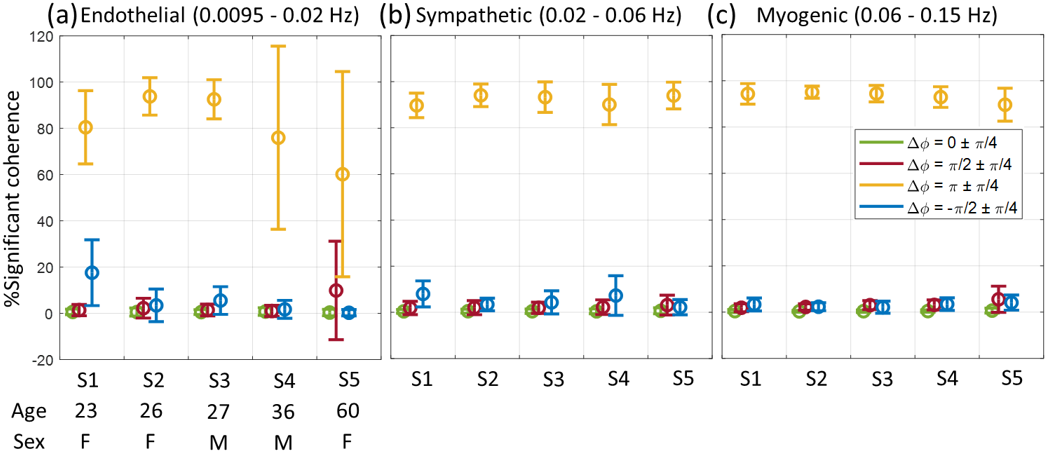
Figure 3. Error bar
presentation of the mean and standard deviation of the %significant coherence
for each individual (subject 1 – 5), summarized separately for three
pre-defined frequency ranges corresponding to specific physiological mechanisms
of microcirculatory control.
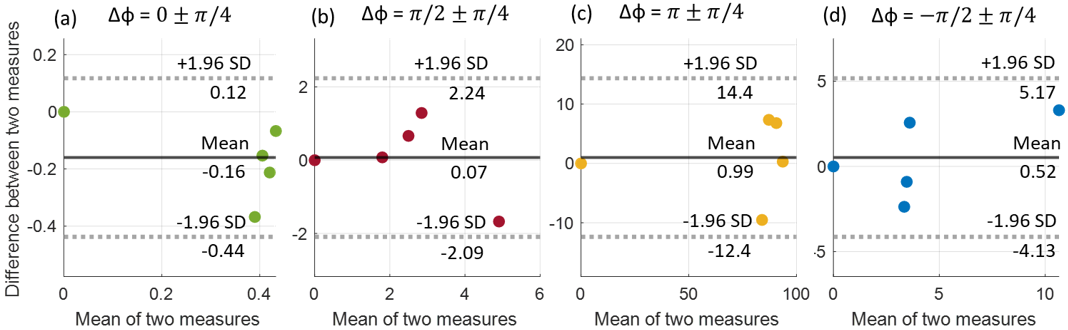
Figure
4. Bland Altman test for evaluating
reproducibility from two repeated BOLD measurements, performed separately for
each phase range.
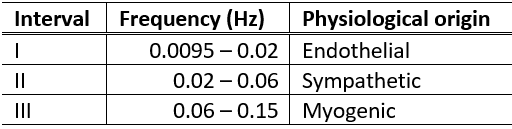
Table
1. Pre-defined frequency intervals and
their attributed physiological origin.