1081
Evaluation of Brain Glioma Using Non-Contrast Cerebral Blood Volume Mapping: Correlations between Vascular proliferation and Perfusion MR1Radiology, Zhujiang hospital of southern medical university, Guangzhou, China, 2F.M. Kirby Research Center for Functional Brain Imaging, Kennedy Krieger Institute, Baltimore, MD, United States, 3Philips Healthcare, Guangzhou, China, 4Philips Healthcare, Shanghai, China
Synopsis
Cerebral blood volume (CBV) mapping employing velocity-selective saturation pulse trains is an emerging velocity-selective arterial spin labeling (VSASL) based method for quantifying perfusion with higher SNR. Its utility was assessed for glioma patients at 3T and corelation between histopathologic vascular proliferation and perfusion MR Imaging. VSASL based CBV mapping, in good agreement with DSC-PWI and VSASL based cerebral blood flow (CBF) mapping, showed great promise for accurate quantitative assessment and preoperative grading of brain gliomas, and further potential in the IDH genotype and vascular proliferation status predicting.
INTRODUCTION
Cerebral blood volume (CBV) mapping with a dynamic susceptibility contrast (DSC) perfusion technique has become a routine clinical tool in diagnosing and follow-up of brain tumors.1-3 A novel velocity-selective arterial spin labeling (VSASL) based technique using conventional velocity-selective saturation pulse trains was proposed for absolute CBV quantification.4 Its clinical value needs to be further investigated. The purpose of this work is to evaluate the performance of this non-contrast CBV mapping on preoperative patients with gliomas. Correlation studies were evaluated between histopathologic vascular proliferation and perfusion MR.METHODS
Patients with newly diagnosed brain tumors were recruited to undergo preoperative MRI between Nov. 2017 and Feb. 2019 using a 3T Philips Ingenia scanner. In addition to anatomic sequences, all the patients performed the VSASL based CBV mapping. 22 cases of gliomas (Grade IV, N=8, 52±11yo, glioblastoma, IDH mutant/wildtype/unknown,2/5/1]; Grade III, N=4, 56±11yo, anaplastic astrocytoma, IDH mutant/wildtype,3/1; Grade II, N=10,46±12yo, astrocytoma, IDH mutant/wildtype, 5/5) with a histopathological diagnosis of primary gliomas based on the 2016 WHO brain tumor classification5 were included in this analysis. Meanwhile, 20 and 17 patients also performed the DSC-PWI and VSASL based CBF mapping,6 respectively.Three representative 3×3 pixel ROIs were manually chosen from all cases of glioma regions showing the maximal perfusion signal on CBV and CBF maps. The ratio of tumor blood volume (TBV) or tumor blood flow (TBF) and the values from contralateral normal-appearing white matter or gray matter (CBVWM and CBFGM) were compared, respectively. After normality testing, Mann-Whitney U test was used to assess differences in rTBV and Ki-67 labeling index between low-grade glioma (LGG, WHO grade II) and high-grade glioma (HGG, WHO grade III&IV). The area under the receiver-operating characteristic (ROC) curves were constructed to determine the diagnostic accuracy of rTBV parameters derived from CBV mapping for grading glioma. Student t test was used to evaluate the differences for rTBV between two IDH mutation statuses in LGG and HGG, respectively.
Linear regression and Bland-Altman analyses were performed to evaluate the correlation and agreement of rTBV between VSASL based CBV mapping and DSC-PWI. The correlation between Ki-67 labeling index, rTBF-DSC, rTBF-VSASL and rTBV-CBV was assessed using Spearman correlation analysis.
RESULTS
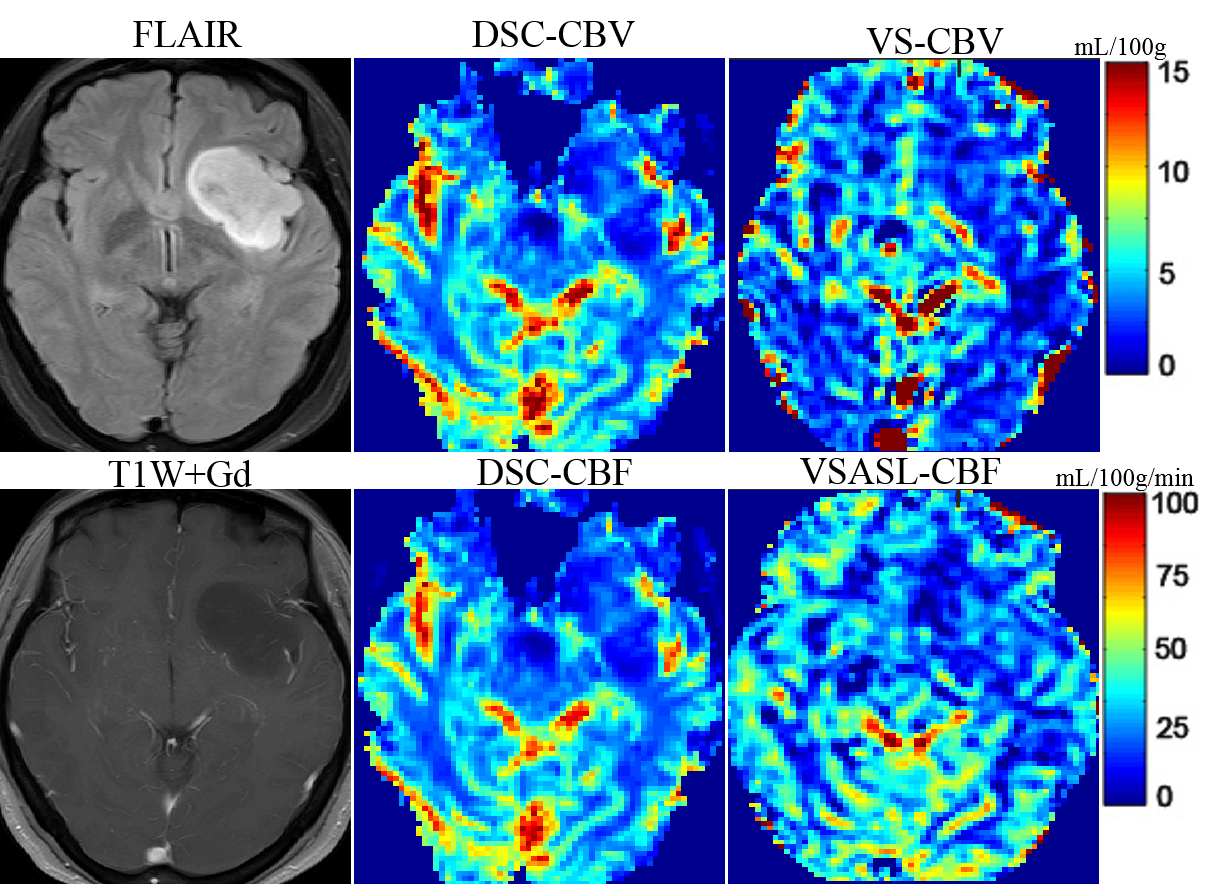
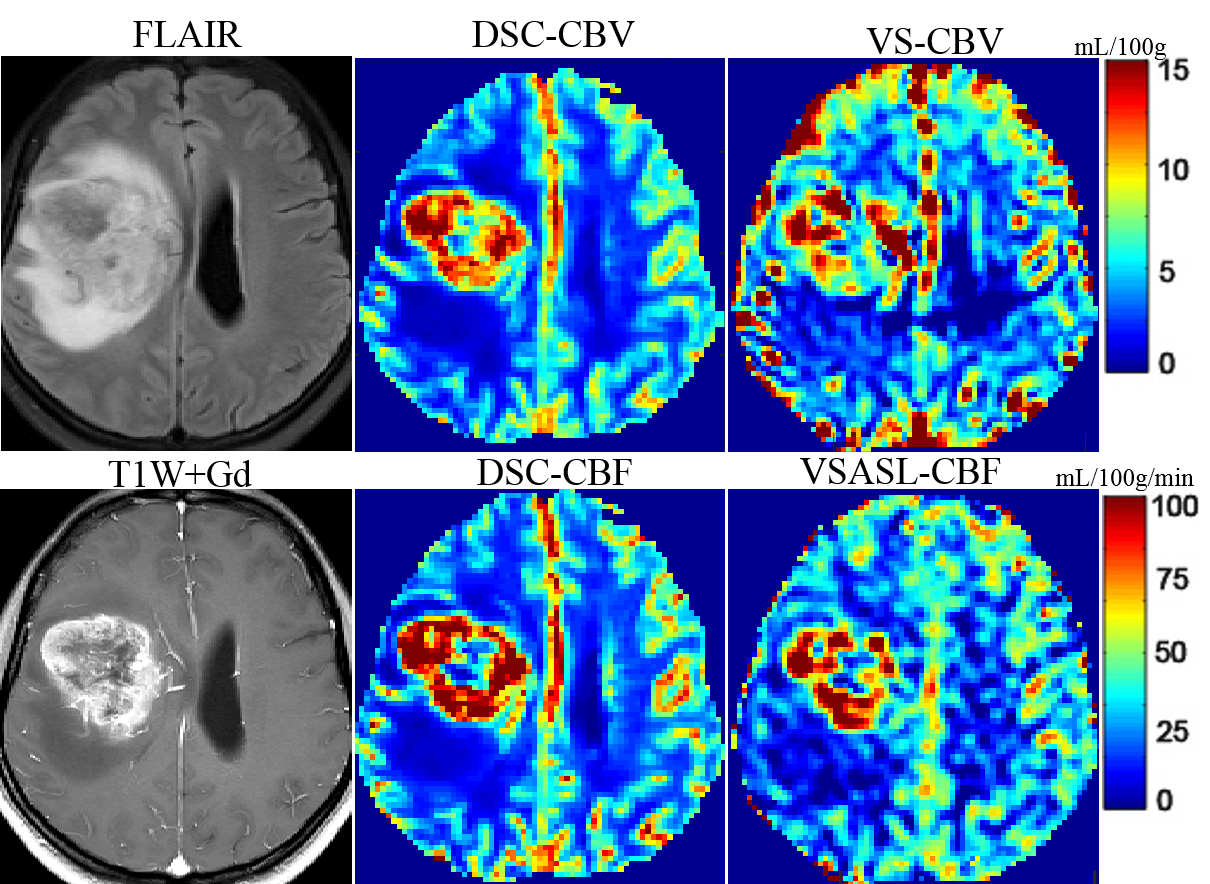
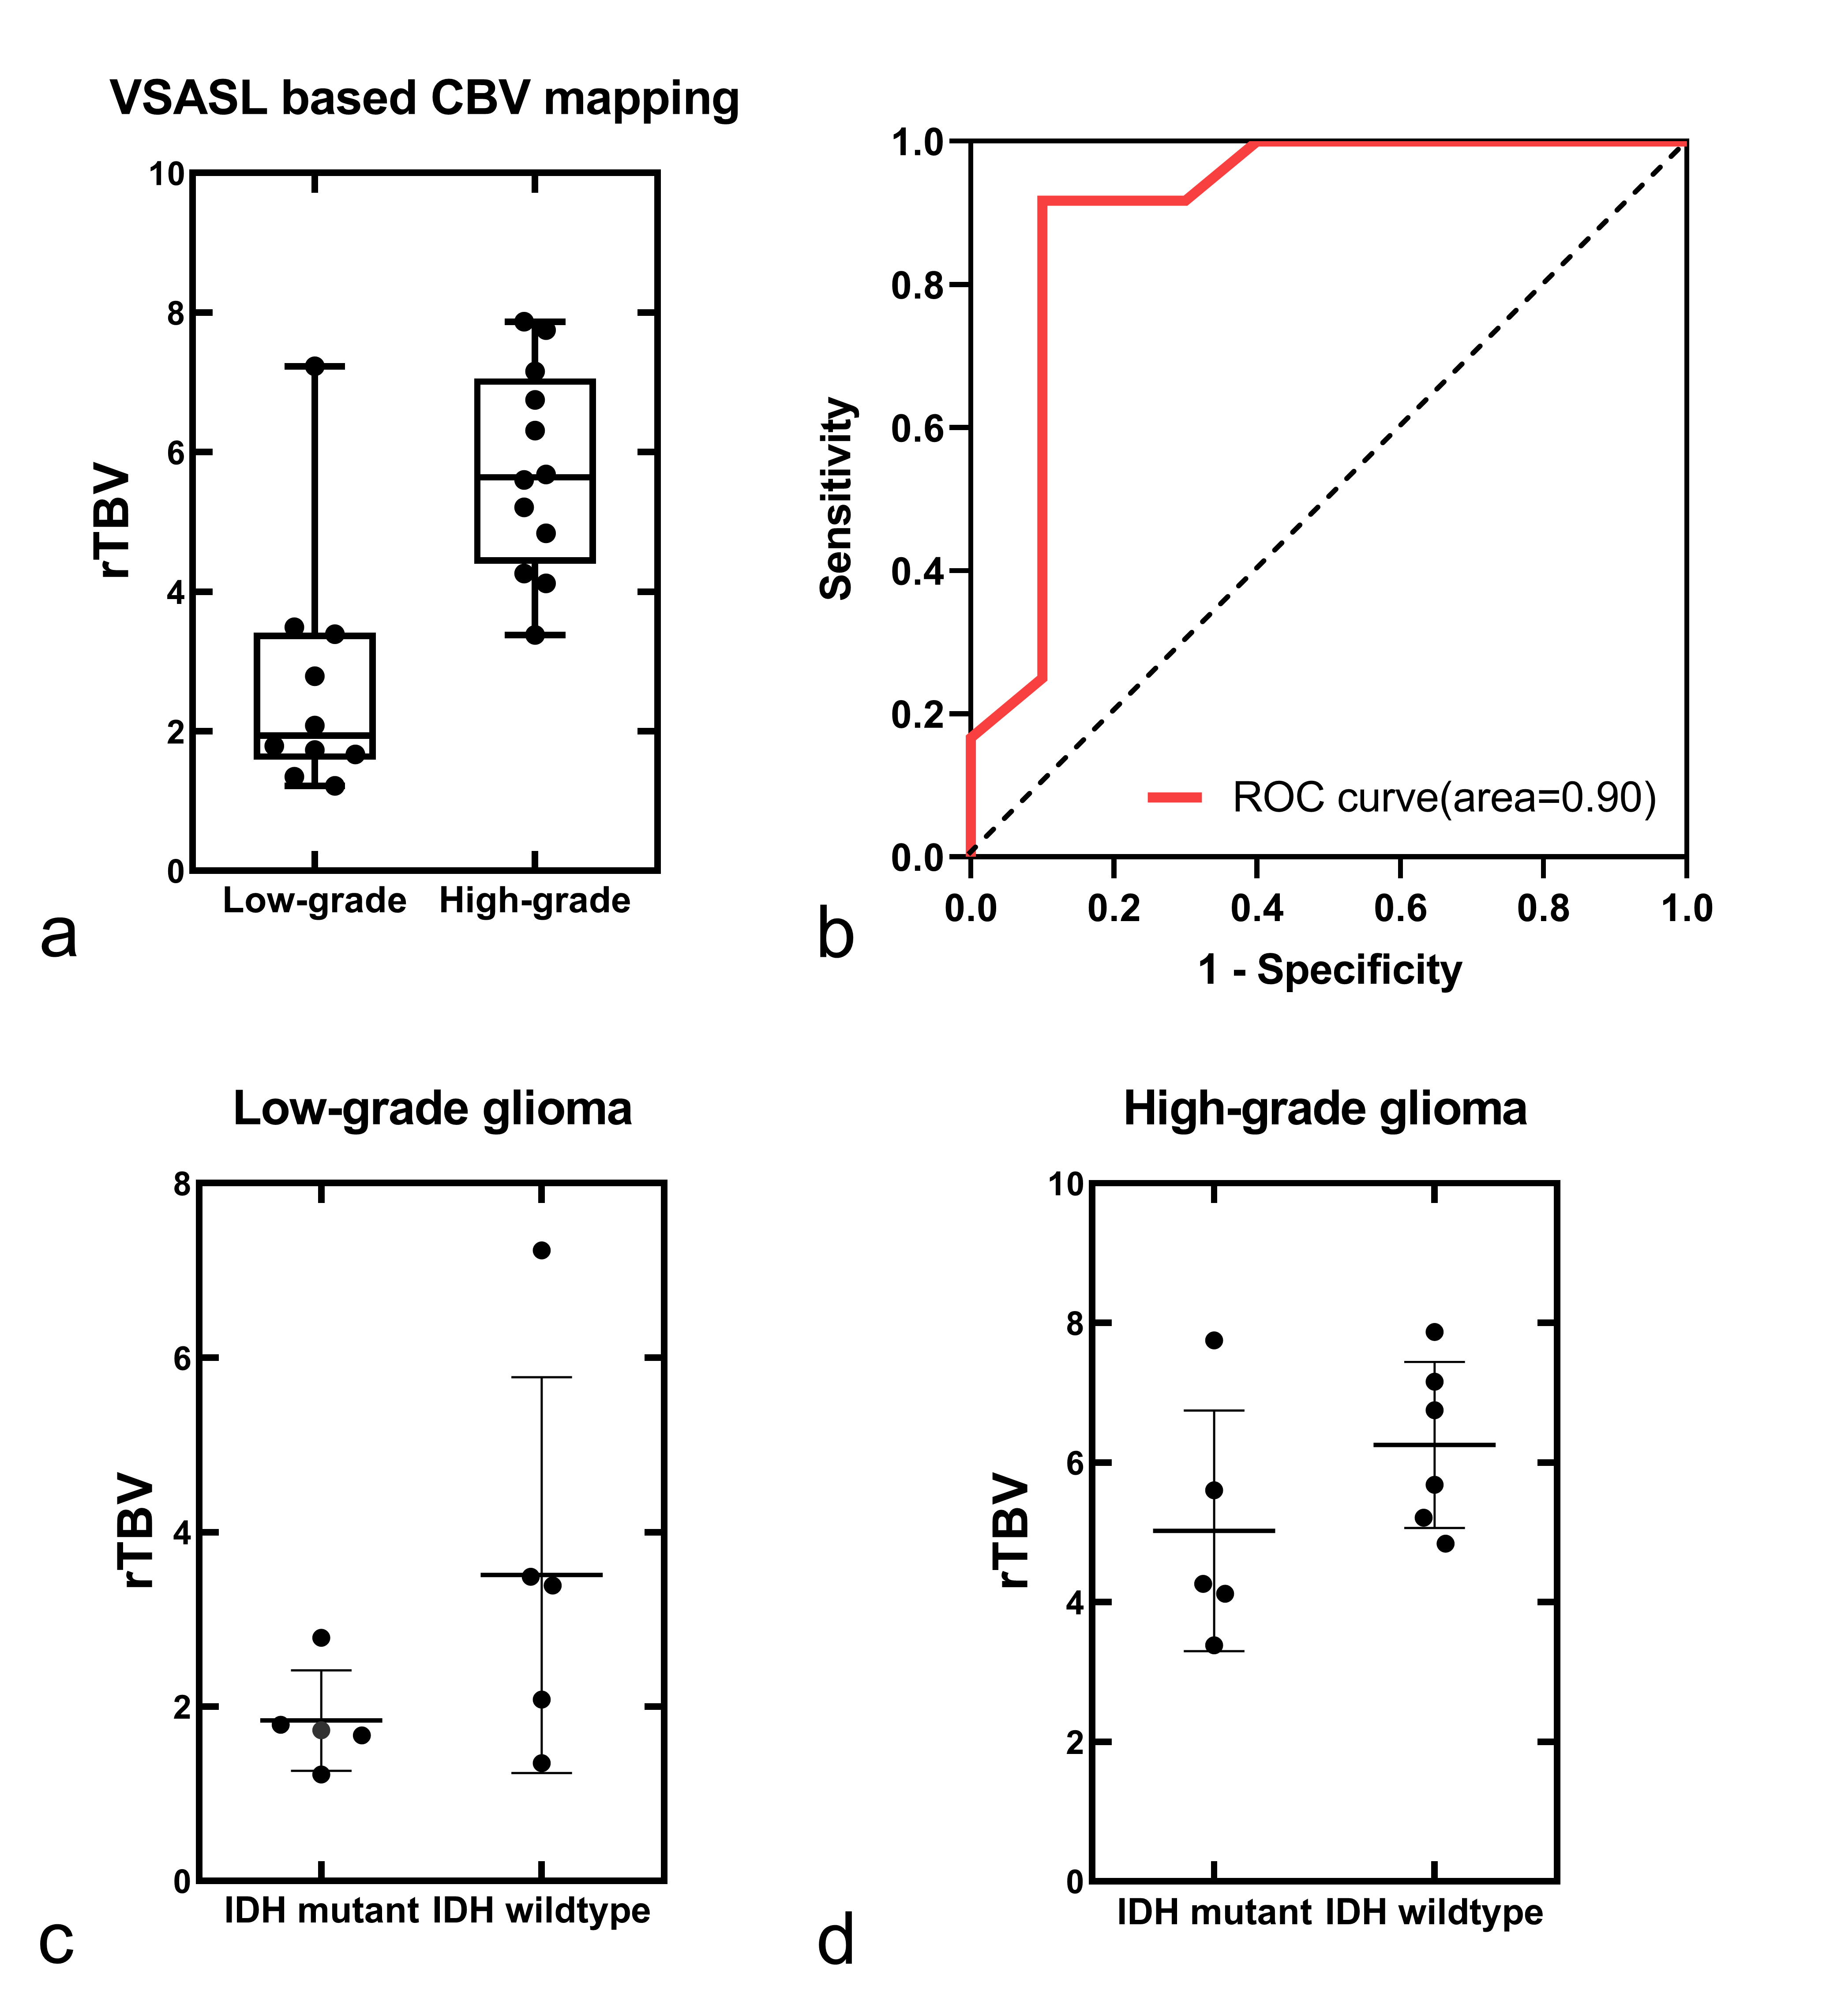
Representative non-contrast CBV images in different grades of glioma are shown in Figure 1-2. CBV maps derived from VSASL based method and DSC-PWI in each case are largely comparable on visual inspection. As expected, low-grade astrocytoma does not have elevated TBV (Fig. 1), and markedly elevated TBV is seen in the glioblastoma (Fig. 2)The rTBV parameters derived from CBV mapping of HGGs were significantly higher than that in LGGs (median, 5.64 [interquartile range {IQR},4.40-7.06] vs 1.94,[IQR, 1.59-3.42], P<0.001) (Fig. 3a). For the ROC curve, the rTBV of CBV mapping yielded an AUC of 0.90 with a sensitivity of 91.67% and a specificity of 90.00% when the value higher than 3.49 (Fig. 3b). Recent studies have indicated that IDH genotype is associated with DSC relative CBV.7, 8 Though with a small sample size, we further evaluated the potential value of CBV mapping in predicting IDH mutation status in both LGG and HGG groups (Fig 3c-d). The trends toward higher rTBV with IDH wildtype gliomas than IDH mutant were observed, either in LGG or HGG (P>0.05 for both).
The proliferation index in grade II glioma were significantly lower than that in grade III&IV (3.5%, [IQR, 2.75-5.75%] vs. 40%, [IQR, 22.5-57.5%], P<0.001). The rTBV values derived from CBV mapping were moderately correlated with Ki-67 labeling index in gliomas (r=0.58, p=0.005).
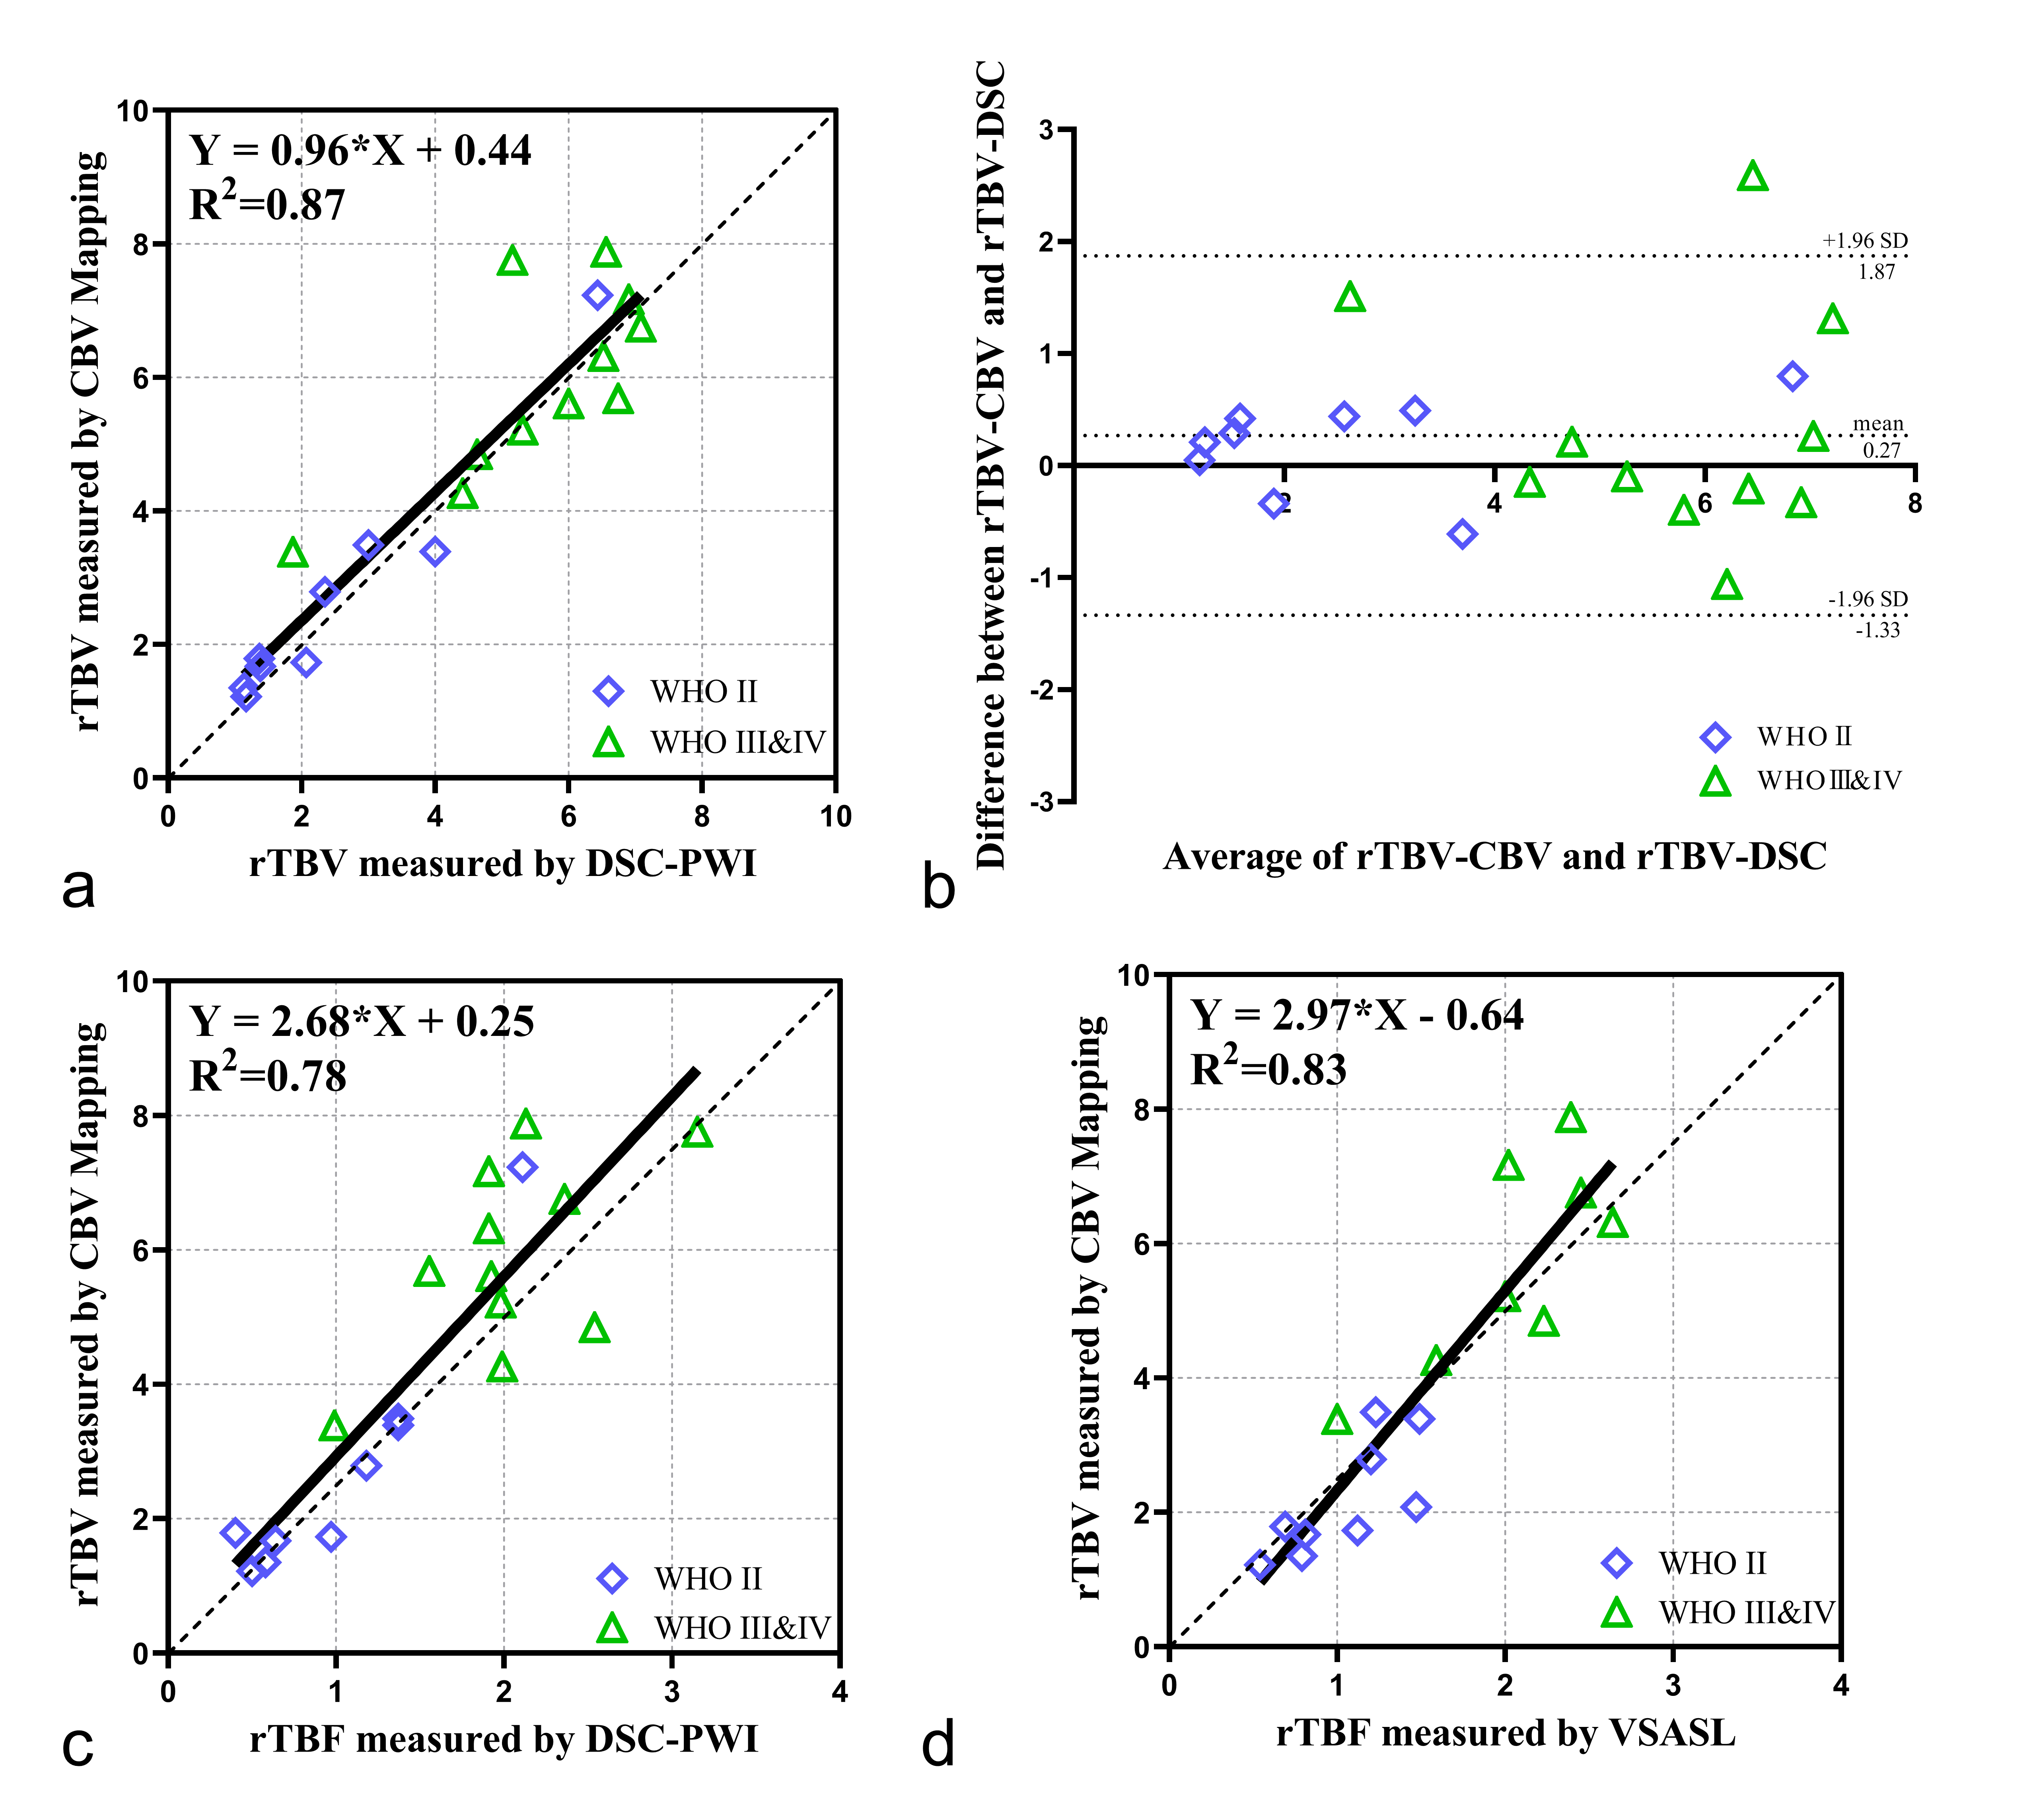
Fig.4a-b shows linear regression and Bland-Altman analyses of the ratios of TBV over CBFWM, between CBV mapping and DSC-CBV. The rTBV value derived from CBV mapping was positively correlated with DSC-PWI (X: rTBV-DSC, Y: rTBV-CBV, Y=0.96*X + 0.44, R2=0.87; r=0.91, P<0.001). The mean difference between these two CBV measurement methods was 0.27 with 1.96 standard deviation of -1.33 to 1.87. Positive correlations were also found between rTBF-DSC (X: rTBF-DSC ,Y: rTBV-CBV, Y=2.68*X + 0.25, R2=0.78; r=0.86, P<0.001), rTBF-VSASL (X: rTBF-VSASL ,Y: rTBV-CBV, Y=2.97*X - 0.64, R2=0.83; r=0.92, P<0.001) and rTBV-CBV (Fig. 4c-d), as shown on cases in Figure 1 and 2.
DISCUSSION AND CONCLUSION
A study using VSASL based CBV mapping was evaluated among glioma patients at 3T, demonstrating the robustness of this technique in the quantitative assessment and preoperative grading of brain gliomas, and further potential in predicting the IDH genotype and the histopathologic vascular proliferation status of brain gliomas. As a relatively newer non-invasive perfusion method, VSASL based CBV mapping, is in good agreement with DSC-PWI and VSASL based CBF mapping, and it may provide a preferred alternative method for evaluating the perfusion of brain tumors, especially for patients with contraindications to contrast agents.Acknowledgements
The authors thank the radiologist and nurse colleagues who helped during the research study. A special thank you is also expressed to the patients for participating in the study.References
1. Welker K, Boxerman J, Kalnin A, et al. ASFNR Recommendations for Clinical Performance of MR Dynamic Susceptibility Contrast Perfusion Imaging of the Brain. American Journal of Neuroradiology 2015;36:E41
2. Law M, Young RJ, Babb JS, et al. Gliomas: Predicting time to progression or survival with cerebral blood volume measurements at dynamic susceptibility-weighted contrast-enhanced perfusion MR imaging. Radiology 2008;247:490-498
3. Choi KS, Choi SH, Jeong B. Prediction of IDH genotype in gliomas with dynamic susceptibility contrast perfusion MR imaging using an explainable recurrent neural network. Neuro-Oncology 2019;21:1197-1209
4. Liu D, Xu F, Lin DD, et al. Quantitative measurement of cerebral blood volume using velocity-selective pulse trains. Magnetic Resonance in Medicine 2017;77:92-101
5. Louis DN, Perry A, Reifenberger G, et al. The 2016 World Health Organization Classification of Tumors of the Central Nervous System: a summary %J Acta Neuropathol. 2016;131:803-820
6. Qin Q, van Zijl PC. Velocity-selective-inversion prepared arterial spin labeling. Magn Reson Med 2016;76:1136-1148
7. Kickingereder P, Sahm F, Radbruch A, et al. IDH mutation status is associated with a distinct hypoxia/angiogenesis transcriptome signature which is non-invasively predictable with rCBV imaging in human glioma. Scientific Reports 2015;5:16238
8. Hong EK, Choi SH, Shin DJ, et al.
Radiogenomics correlation between MR imaging features and major genetic
profiles in glioblastoma. European
Radiology 2018;28:4350-4361
Figures