1079
Aberrant cerebral perfusion pattern in amnestic mild cognitive impairment and Parkinson’s disease with mild cognitive impairment1Nanjing First Hospital, Nanjing Medical University, Nanjing, China, 2GE Healthcare, MR Research China, Beijing, China, 3Northern Jiangsu People’s Hospital, Yangzhou, China
Synopsis
We investigated the aberrations in regional perfusion properties among amnestic mild cognitive impairment (aMCI) patients, patients with Parkinson’s disease with MCI (PD-MCI), and healthy control (HC) by using 3D arterial spin labeling (ASL) imaging. Our results showed that normalized cerebral blood flow (CBF) as measured by 3D ASL revealed different patterns of perfusion between aMCI and PD-MCI, probably linked to distinct neural mechanisms. Therefore, this preliminary study demonstrates that normalized CBF might provide specific perfusion information for further pathological and neuropsychological studies.
Introduction
MCI has been recognized as the forerunner of Alzheimer’s disease (AD) and Parkinson’s disease with dementia (PDD) [1]. Given that PDD and AD share some pronounced features, it is desirable to monitor aberrant neural activity in MCI stage before overlapping neurodegenerative changes. 3D arterial spin labeling (ASL) imaging is a promising proxy that non-invasively provides cerebral blood flow (CBF) measurement and neural connectivity.Although ASL studies have yielded convincing results in AD and PD [2, 3], earlier difference of regional perfusion patterns in the prodrome of these two conditions remains unclear. Therefore, in this study, we conducted a comparative analysis of normalized regional CBF, and focused on the differences in CBF-connectivity between MCI groups under two different pathologies.
Materials and Methods
SubjectsA final sample consisted of 44 (26 male and 18 female) patients with aMCI, 42 (18 male and 24 female) patients with PD-MCI, and 50 (25 male and 25 female) matched healthy controls (HC)s were recruited. Global cognitive function of all subjects was scored using the Montreal Cognitive Assessment. The impairments in cognitive domains were assessed using a neuropsychological battery.
MRI experiment
All MRI experiments were performed at a 3T MR scanner (Discovery MR750w, GE, USA) with a 32 coil. 3D pseudo-continuous ASL sequence with the following parameters was applied: TR 10.5 ms, TE 4.9 ms, flip angle 111°, slice thickness 4 mm without gap, FOV 240 mm × 240 mm, matrix size 128 × 128, post-label-delay (PLD) 2025 ms, NEX 3, number of slices 36. Total scan time was 4 min and 44 s.
Data analysis
All 3D ASL data were analyzed with a vendor-provided post-processing software in workstation (ADW 4.6, GE, USA). The corresponding CBF maps were obtained with units of ml/100 g/min.
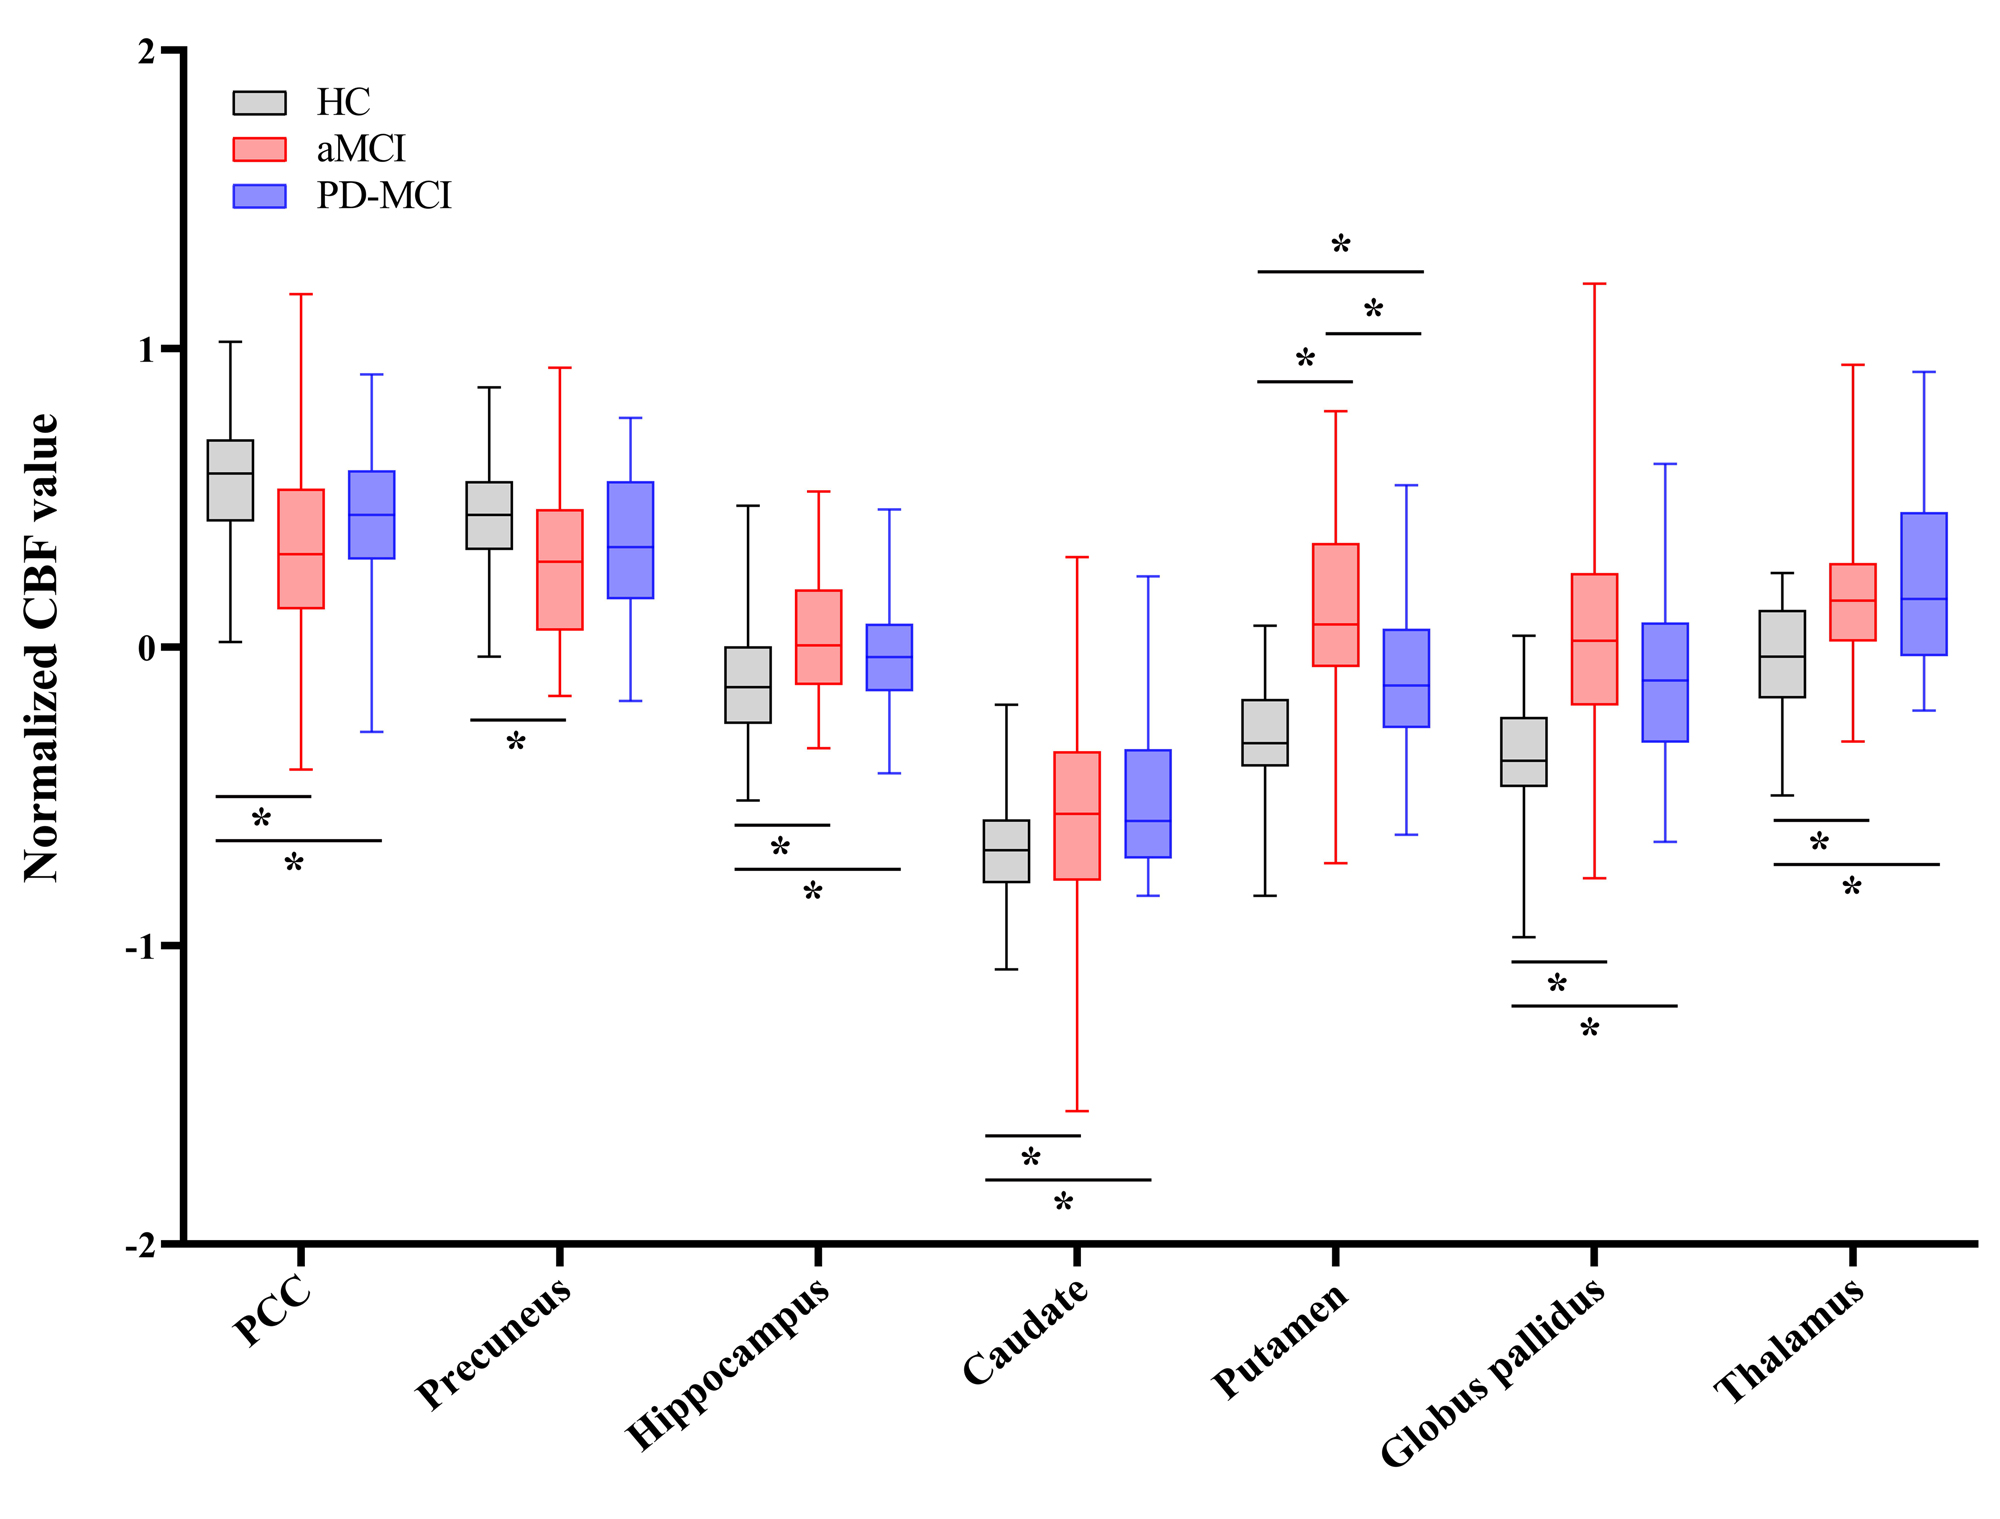
Regional CBF data and CBF-connectivity were preprocessed using SPM 12. Specific AD-related regions [4] including the bilateral posterior cingulate cortex (PCC), precuneus, and hippocampus, along with specific PD-related regions [5], including the bilateral caudate, putamen, globus pallidus, and thalamus, were selected as seed regions of interest (ROIs). For z-CBF and CBF-connectivity analyses, comparisons among groups were performed using Analysis of covariance (ANCOVA) and post-hoc analysis in SPM 12. The nonstationary cluster-level familywise error (FWE) method was used to correct for ANCOVA and post hoc t-test.
Analysis of variance (for age) and χ2 test (for gender) were utilized to investigate the differences among different groups. The continuous variables that were not normally distributed were analyzed by Kruskal-Wallis test between the aMCI and PD-MCI groups. ROC analysis was generated for aMCI group and PD-MCI group to determine the ability of the z-CBF in the regions with significant group differences. The correlations between these significant regions and neuropsychological performance and disease severity were investigated separately using Spearman correlation analysis. Statistical analyses were performed using SPSS 19.0 software, and a P value < 0.05 was considered statistically significant. The covariates for the above analyses included gender, age, education, and individual mean grey matter volume.
Results
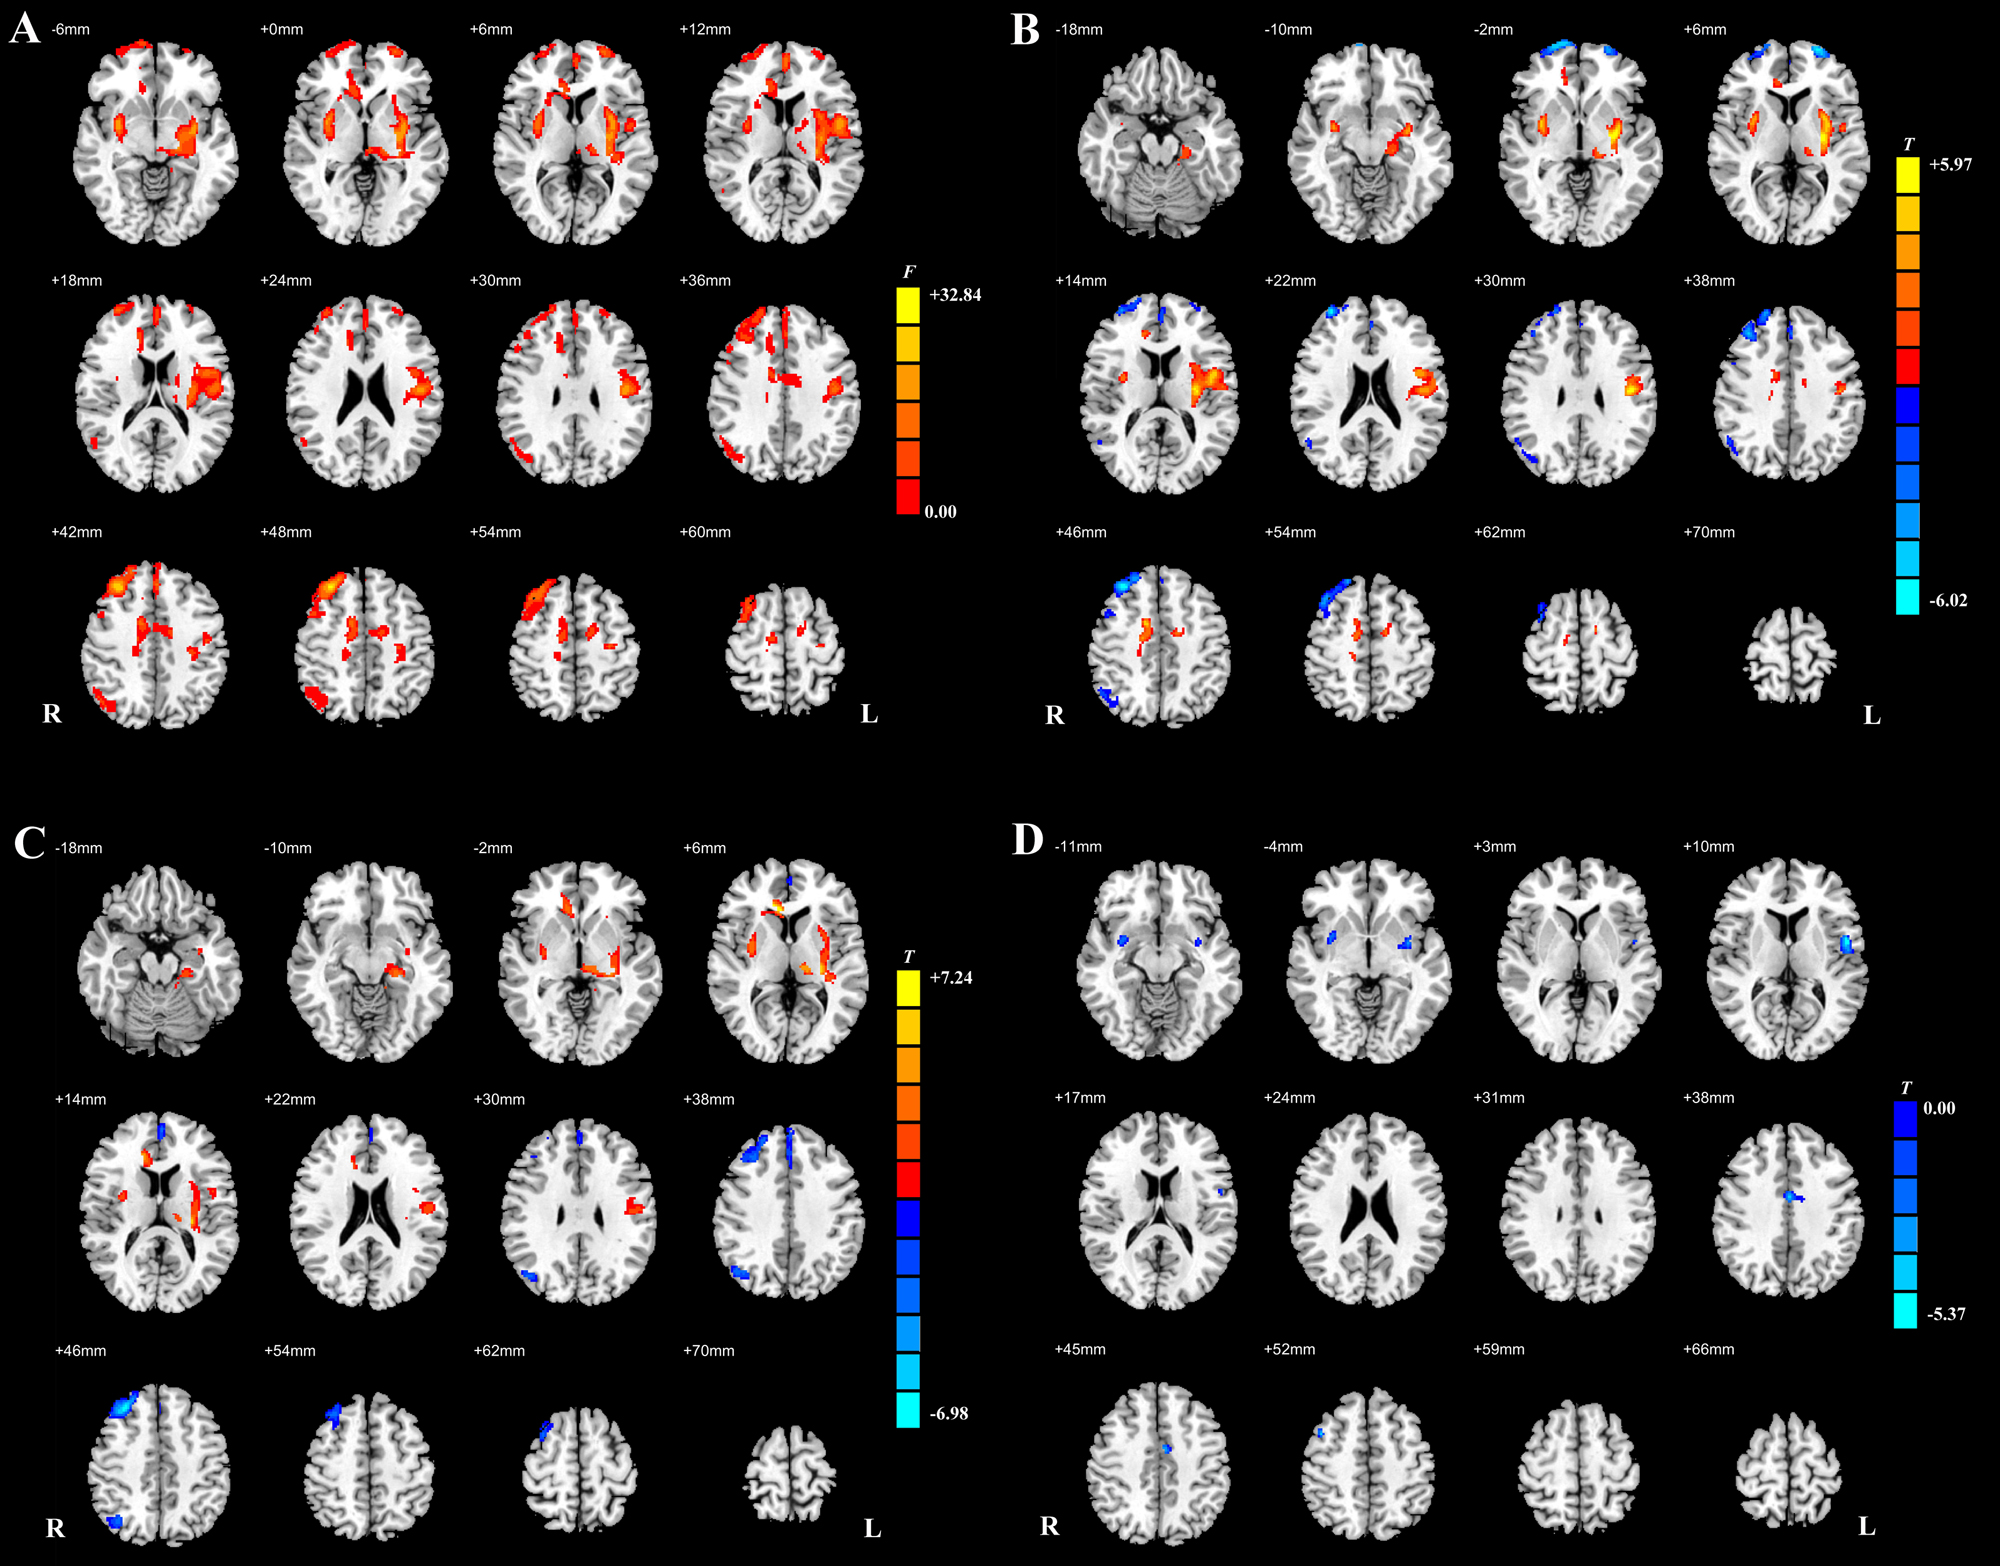
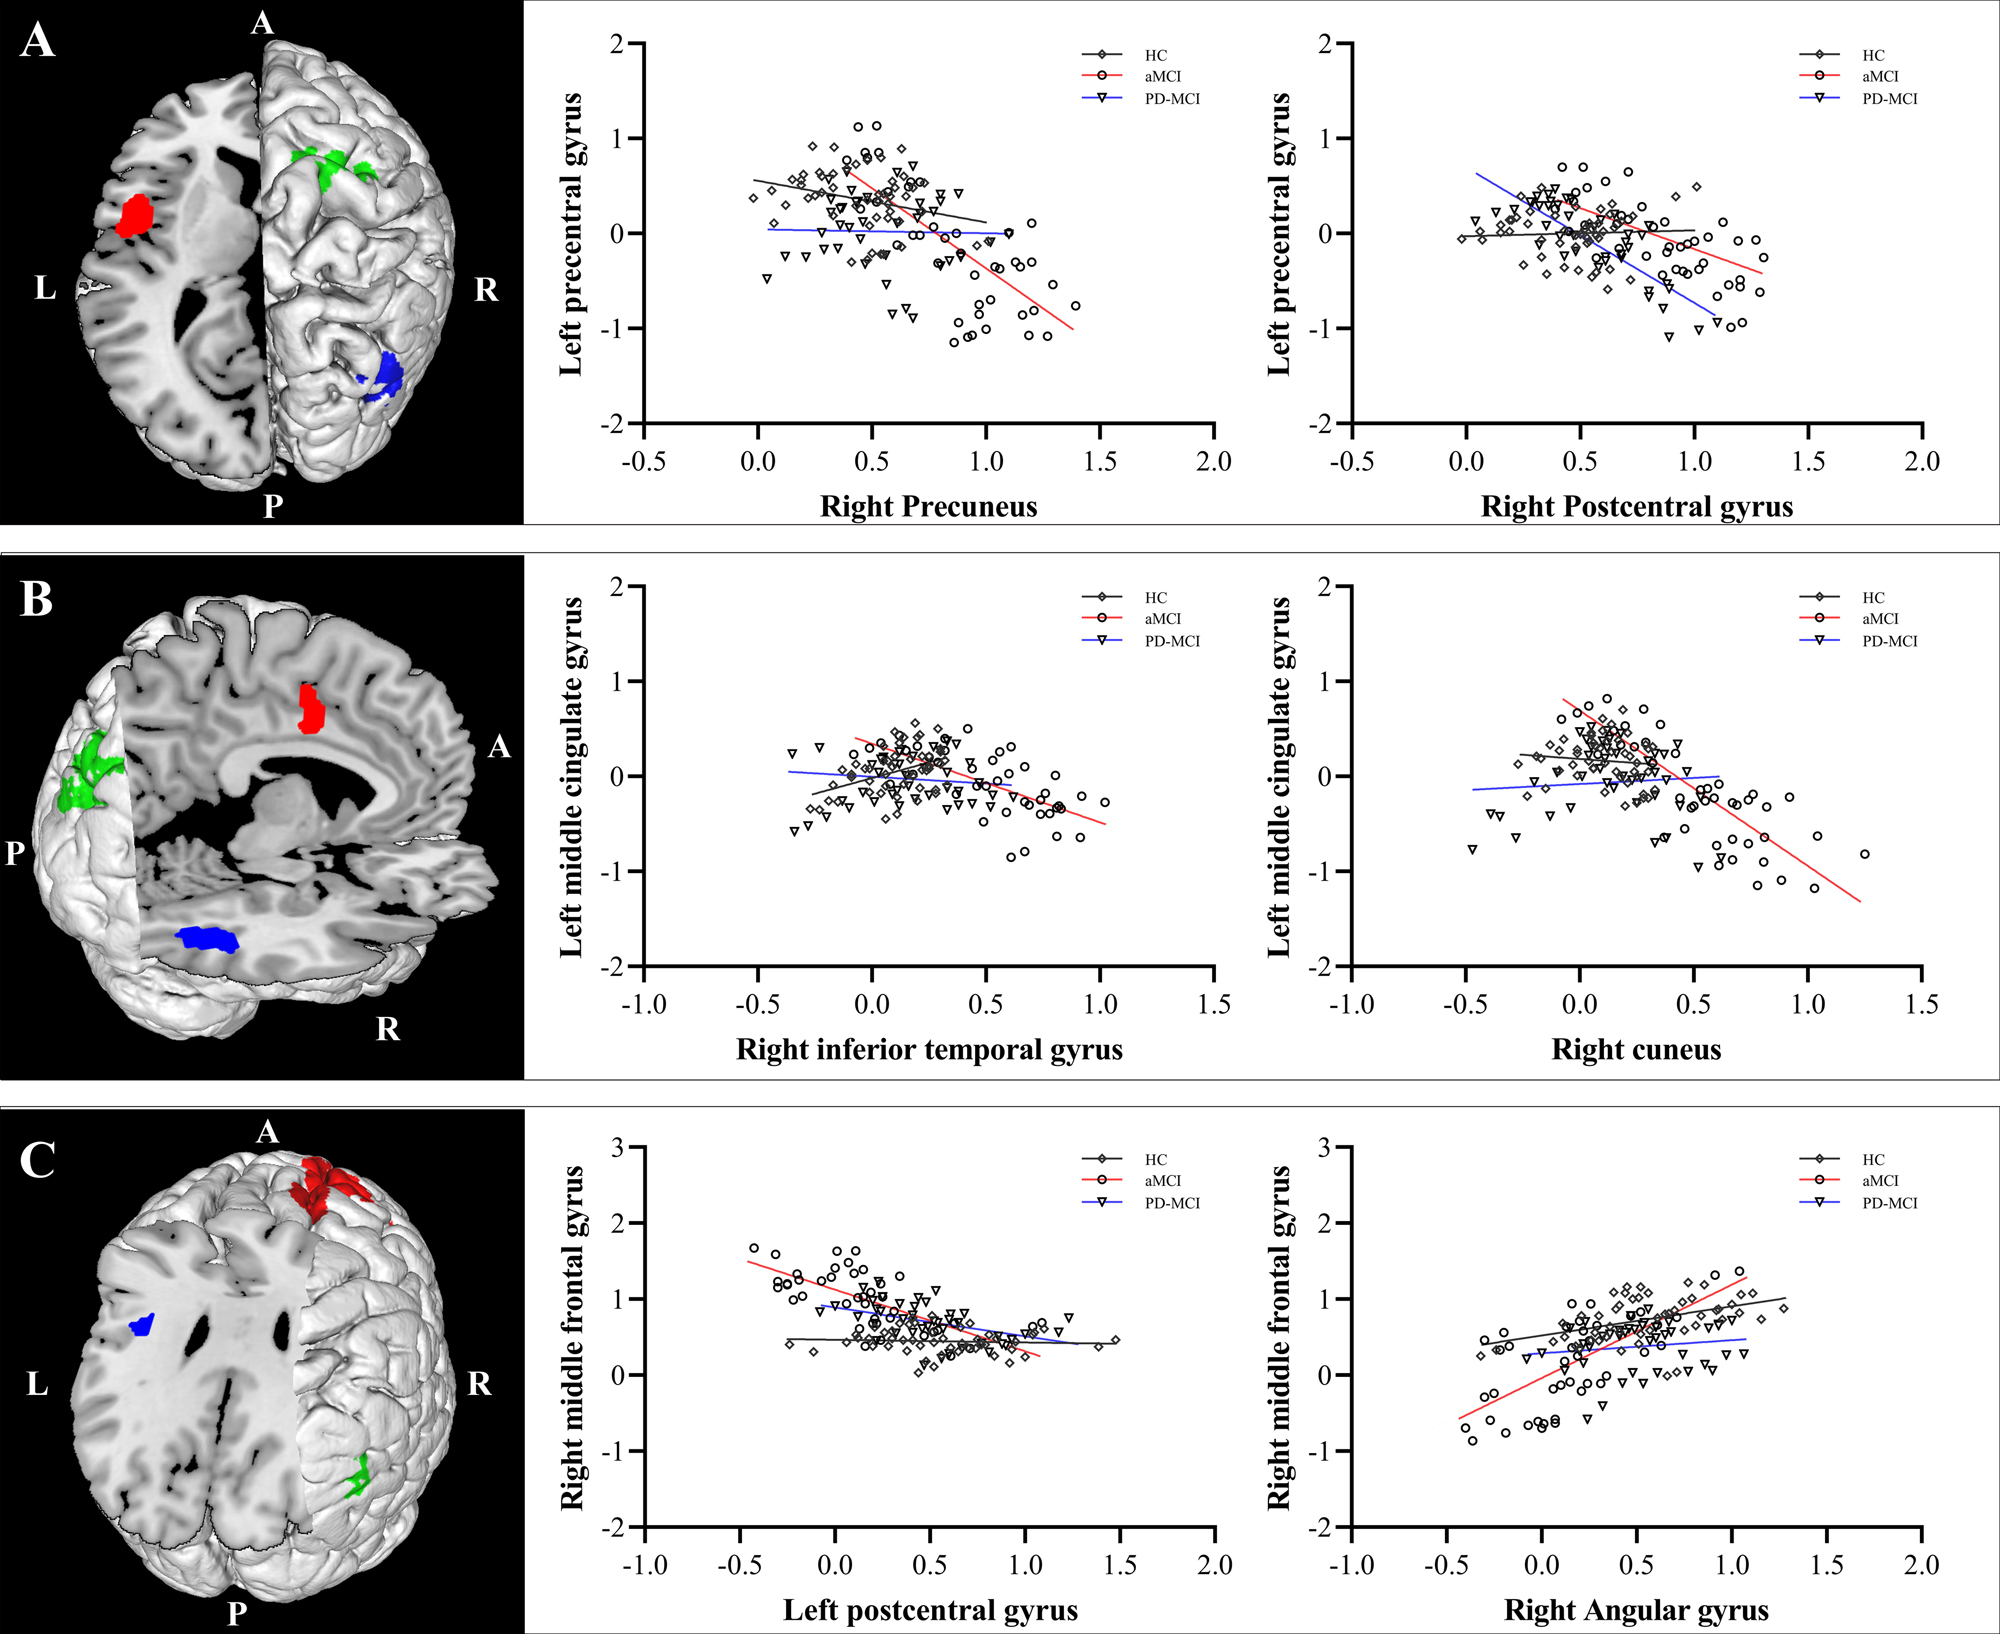
MCI subgroups showed overlapped impaired regions, amnestic MCI (aMCI) group seemed more extensive than PD-MCI group. PD-MCI patients had reduced normalized cerebral blood flow (z-CBF) in bilateral putamen, left precentral gyrus, left middle cingulate gyrus (MCG), and right middle frontal gyrus (MFG) compared to aMCI group. CBF-connectivities in left precentral gyrus, left MCG, and right MFG were significantly altered in between.Only the z-CBF of the putamen showed a significant difference between any two groups (P < 0.05). For PD-MCI group, we found a significantly negative correlation between right MFG and executive performance (ρ = -0.33, P = 0.031). Additionally, left precentral gyrus and bilateral putamen both had significant positive correlations with motor severity (ρ = 0.43, P = 0.004; ρ = 0.46, P = 0.002; ρ = 0.32, P = 0.034). For aMCI group, a significantly negative correlation was found between left precentral gyrus and memory performance (ρ = -0.31, P = 0.043). We also discovered that right MFG showed significant positive correlations with memory performance (ρ = 0.34, P = 0.025).
All significant clusters that differed between the aMCI and PD-MCI groups had good discriminatory power with an area under the curve (AUC) > 0.7. In particular, the right putamen showed the most powerful discriminatory ability: the sensitivity was 83.33%, and the specificity was 72.73% at a cutoff value of mean z-CBF coefficients of -0.04.
Discussion and conclusion
In the present study, we observed impaired perfusion patterns in two different MCI groups and compared with HCs. Although the aberrant perfusion pattern in the PD-MCI group mostly overlapped with that of the aMCI group, the preserved perfusion regions revealed by normalized CBF are probably linked to distinct pathological mechanisms. The hypoperfusion in the prefrontal cortex might be a specific feature of interest for further studies on cognitive decline.In conclusion, normalized CBF as measured by 3D ASL revealed different patterns of perfusion between aMCI and PD-MCI, which were probably linked to distinct neural mechanisms. The present study demonstrates that z-CBF might provide specific perfusion information for further pathological and neuropsychological studies.
Acknowledgements
No acknowledgement found.References
1. Anang JB, Gagnon JF, Bertrand JA et al Predictors of dementia in Parkinson disease: a prospective cohort study. Neurology 2014;83:1253-1260
2. Barzgari A, Sojkova J, Maritza Dowling N et al Arterial spin labeling reveals relationships between resting cerebral perfusion and motor learning in Parkinson's disease. Brain Imaging Behav 2019;13:577-587
3. Fazlollahi A, Calamante F, Liang X et al Increased cerebral blood flow with increased amyloid burden in the preclinical phase of alzheimer's disease. J Magn Reson Imaging 2020;51:505-513
4. Dolui S, Li Z, Nasrallah IM et al Arterial spin labeling versus (18)F-FDG-PET to identify mild cognitive impairment. Neuroimage Clin 2020;25:102146
5. Pelizzari L, Lagana MM, Di Tella S et al Combined Assessment of Diffusion Parameters and Cerebral Blood Flow Within Basal Ganglia in Early Parkinson's Disease. Front Aging Neurosci 2019;11:134
Figures