1077
Investigating Relationships Between Multi-Scale Perfusion and Myelin Integrity in Patients with Relapsing-Remitting MS1Neuroimaging Research, Barrow Neuroimaging Innovation Center, Phoenix, AZ, United States
Synopsis
The objective of this study is to develop magnetic resonance imaging (MRI) biomarkers that can probe complementary vascular function and myelin content. The development of biomarker assays to quantitatively probe both perfusion and myelin content is critical to assessing acute inflammatory activity and regenerative potential. We anticipate that this biomarker will give insight into the underlying pathophysiology of reversible and irreversible myelin damage.
Introduction
Multiple sclerosis (MS) is a demyelinating disease that affects the central nervous system. MS lesions are known to form around small cerebral blood vessels.1 Altered cerebral perfusion can be detected using MRI with dynamic susceptibility contrast (DSC) imaging.2 Thus far, MR-related DSC imaging has focused on global perfusion analysis using standard gradient echo sequences. Recent advances in MRI sequence development have paved the way to measure global perfusion and capillary-sized vessel perfusion metrics using spin- and gradient- echo (SAGE) DSC.3 Myelin loss may influence, or be influenced by, cerebral perfusion changes in MS patients therefore measuring perfusion could be a useful biomarker to report on myelin status.If successful, perfusion biomarkers could be used to assess acute inflammatory activity and predict regenerative potential in RRMS. The purpose of this study is to determine the correlations between SAGE-DSC cerebral perfusion metrics and myelin content measured by the ratio of T1w images to T2w images.
Methods
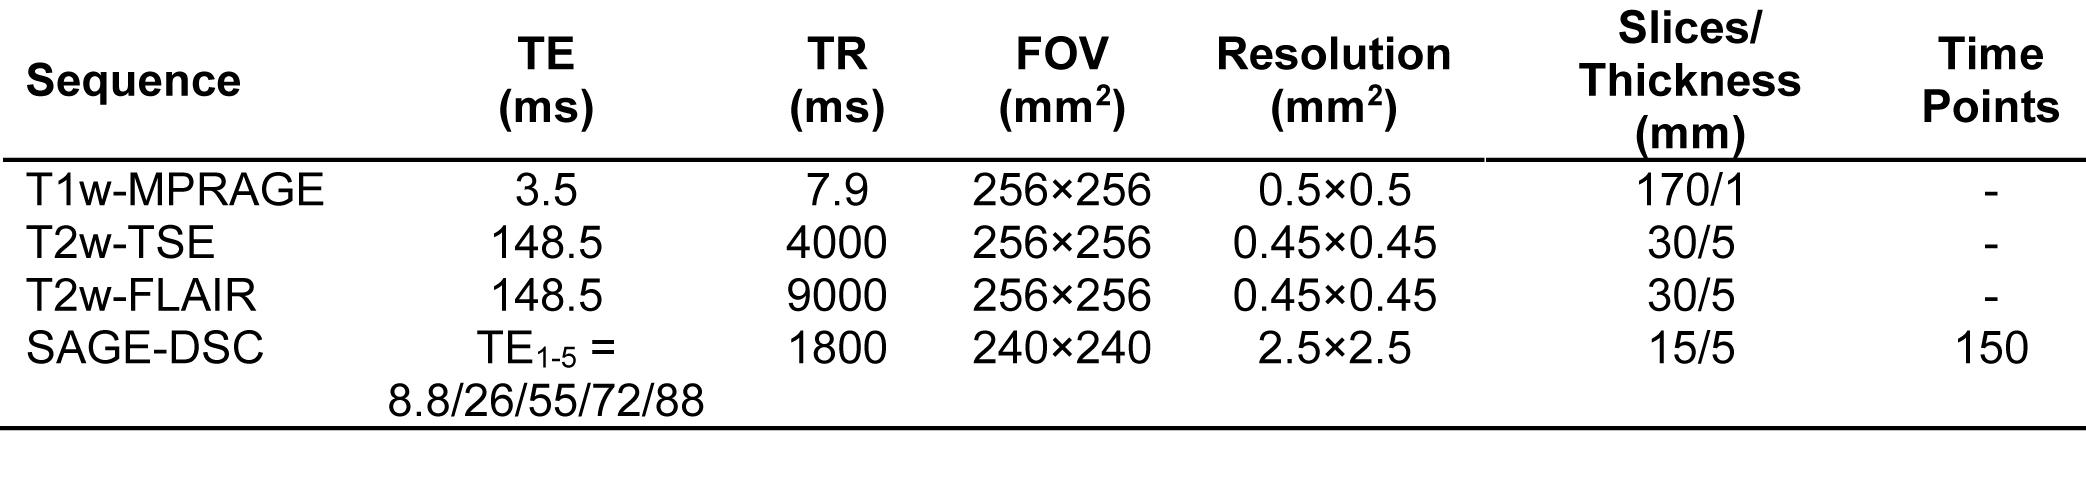
A total of 48 patients (mean age: 37.3; 29 female) with relapsing remitting MS (RRMS) and average FAMS = 117.3 — typical of moderate impairment — were enrolled in this study. MRI was performed on an Ingenia 3-T Scanner (Philips). Standard T1-weighted images were acquired pre- and post-contrast, as well as T2-weighted images. Imaging parameters are summarized in Table 1. Perfusion was quantified using an advanced spin- and gradient-echo method (SAGE) during contrast injection to calculate complementary macro- and microvasculature perfusion parameters, including cerebral blood volume (CBV) and cerebral blood flow (CBF). For SAGE, after 45 s of baseline images, a standard dose (0.1 mmol/kg) of gadolinium-based contrast agent (Gadobutrol, Gadavist) was injected intravenously at 3 mL/s using a power injector. SAGE-DSC acquisition lasted 4.5 minutes. Following SAGE-DSC, The SAGE echoes were combined to compute dynamic ∆R2* and ∆R2 time series, as previously described.4,5 The gradient-echo-based ∆R2* and spin-echo-based ∆R2 were subsequently used to quantify global and capillary-sized perfusion, respectively.3,4,6 The ∆R2* and ∆R2 time-courses were converted to contrast agent concentration,3 while the arterial input function (AIF) was determined using automated methods specifically designed for multi-echo acquisitions.3 Gradient- and spin-echo-based CBV maps were determined from the ratio of the scaled integral between the tissue CA concentration curves and the AIF.3 Gradient- and spin-echo-based CBF maps were calculated as the maximum value of the impulse response function determined from deconvolution of the AIF and tissue CA concentration using block-circulant singular value decomposition.5 Gradient- and spin-echo-based MTT maps were calculated as CBV:CBF ratio. Accounting for differential vessel size sensitivity of gradient-echo and spin-echo,3 the capillary-sized-sensitive spin-echo perfusion measures are referred to with “-SE”, e.g. CBF-SE; otherwise the parameter refers to the globally-sensitive gradient-echo, e.g. CBF. Per patient, a standardized ratio of T1w and T2w images (sT1w/T2w) were calculated as markers of myelin content, which has been previously described.7–12 Perfusion and myelin were compared across tissue types — normal-appearing white matter (NAWM) and gray matter (NAGM), and lesion regions of interest (ROIs). Correlation between perfusion and myelin was assessed in NAWM and lesions. Images were registered to T1w-MPRAGE space and central tendency for SAGE-DSC parameters and sT1w/T2w ratio ROI voxel intensity values are reported as the median values at the subject level. Correction for multiple comparisons was performed using FDR method with threshold for significance of p ≤ 0.05.Results
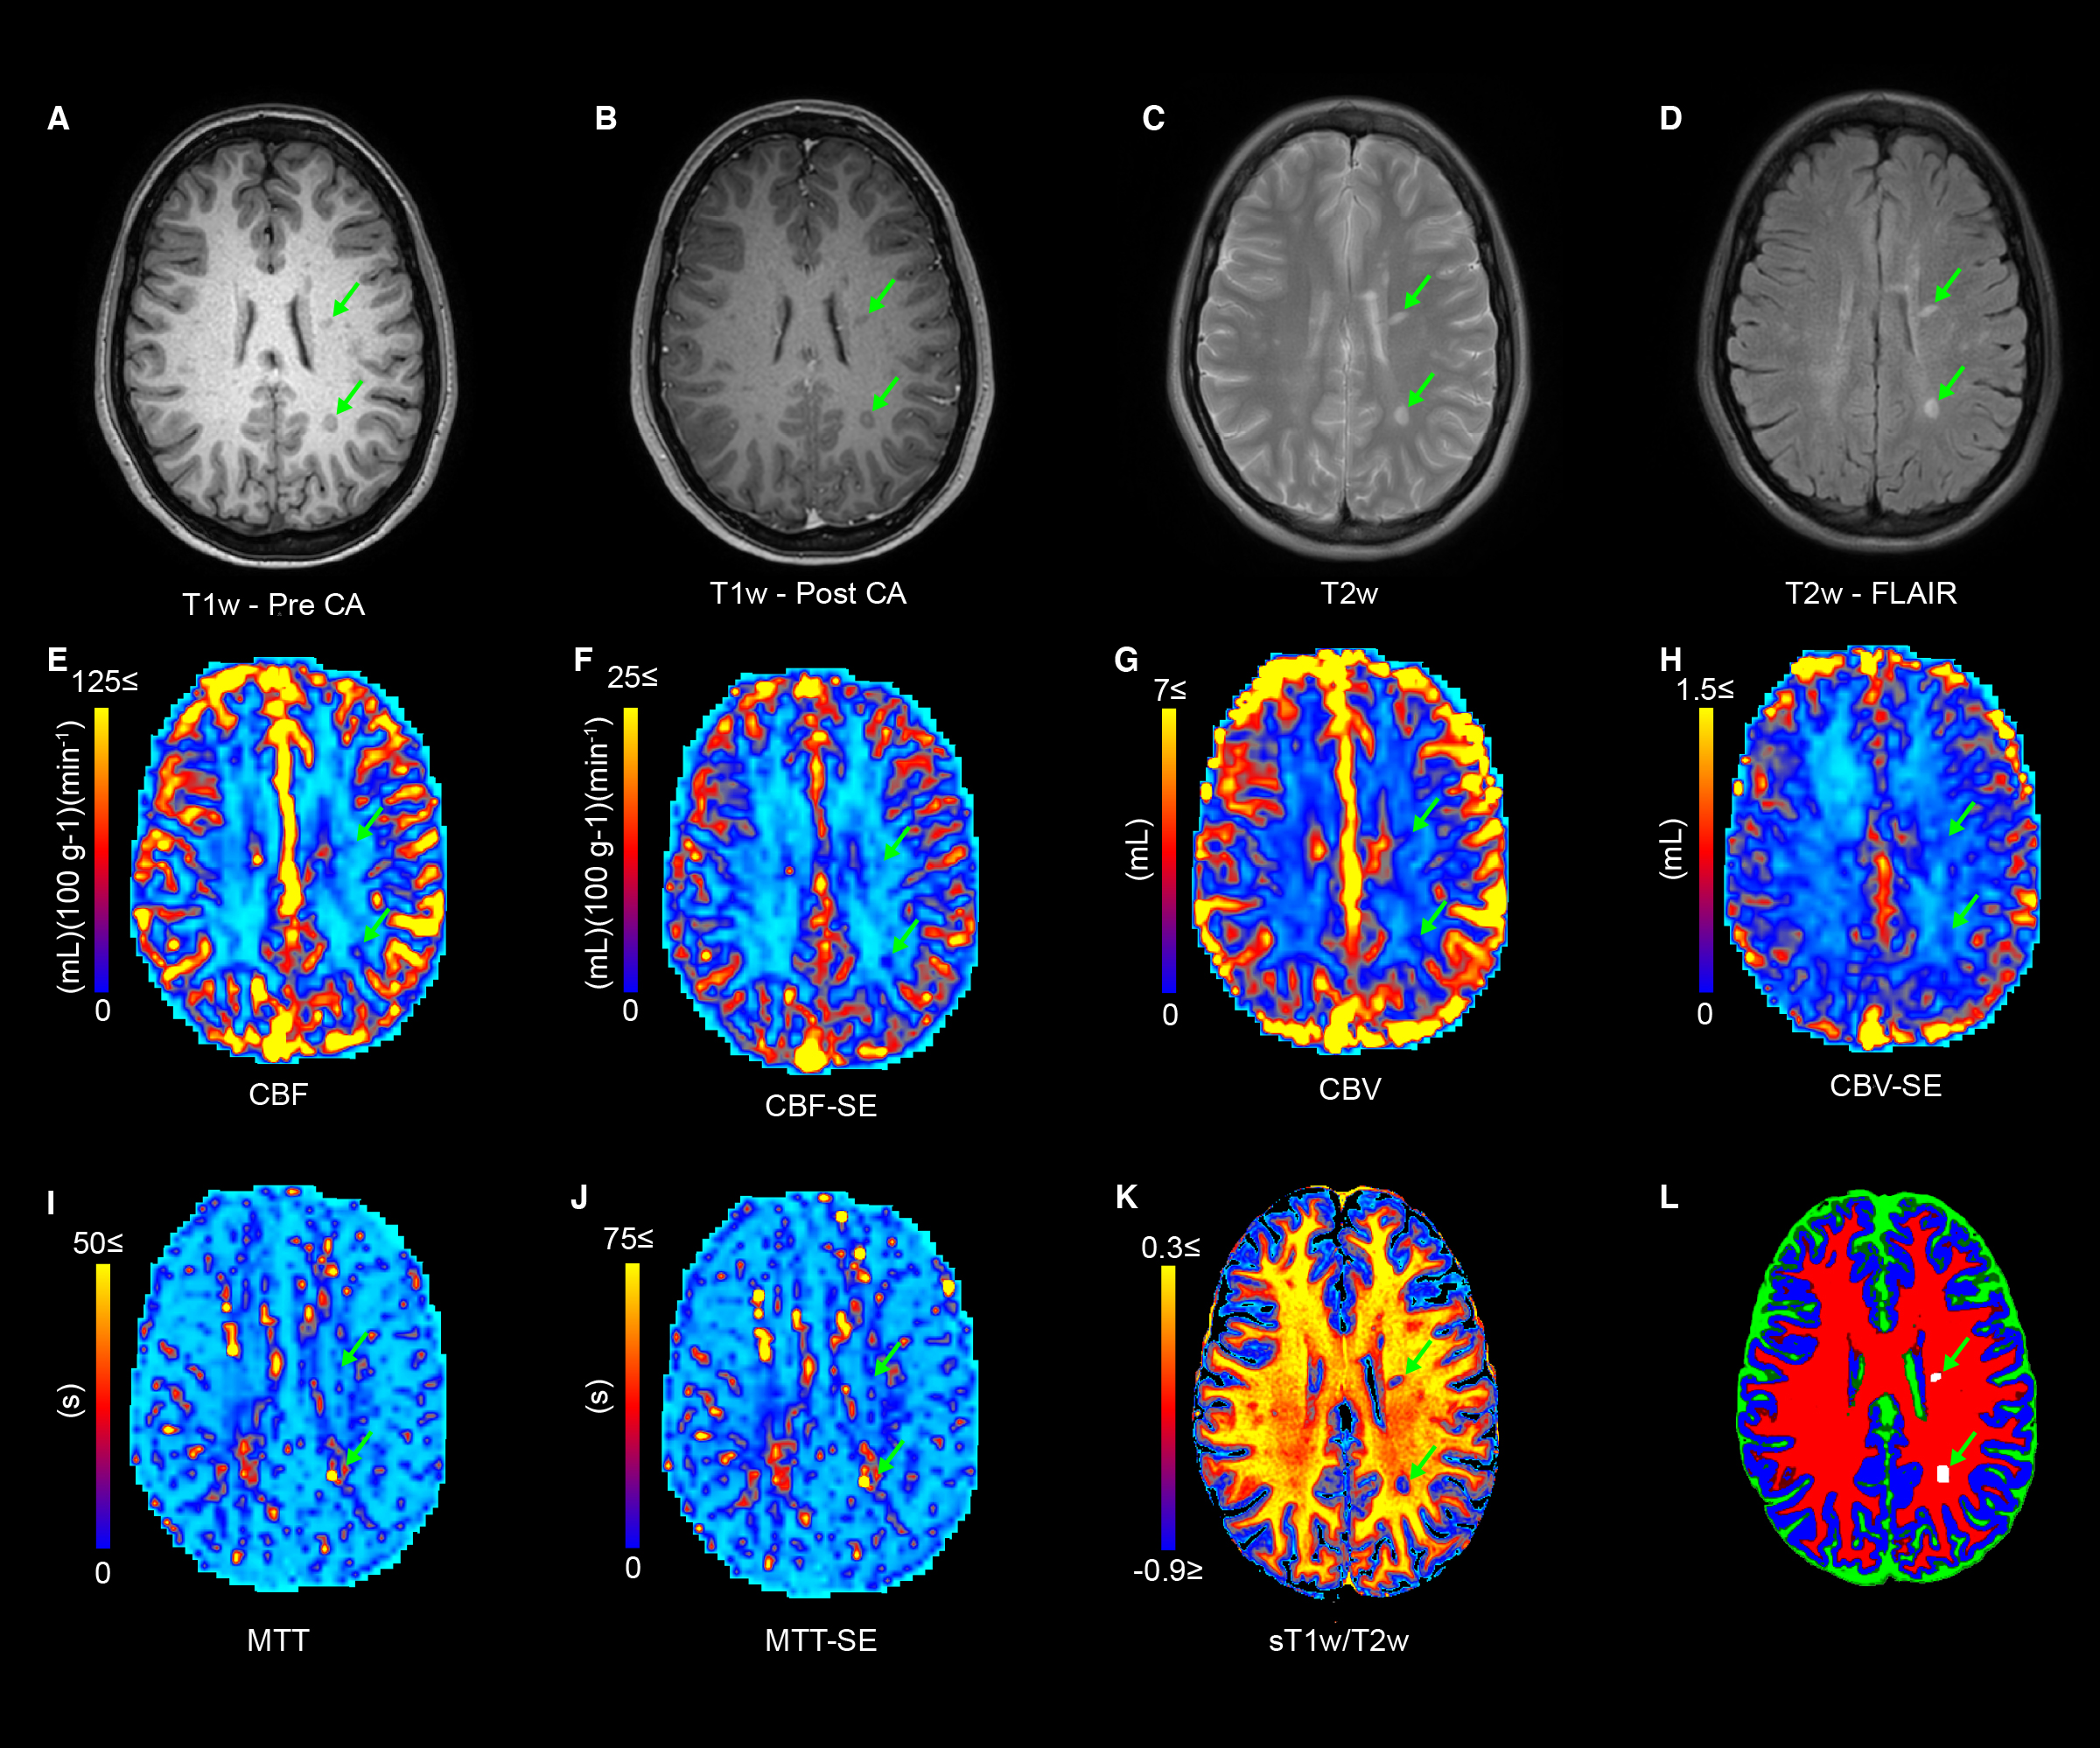
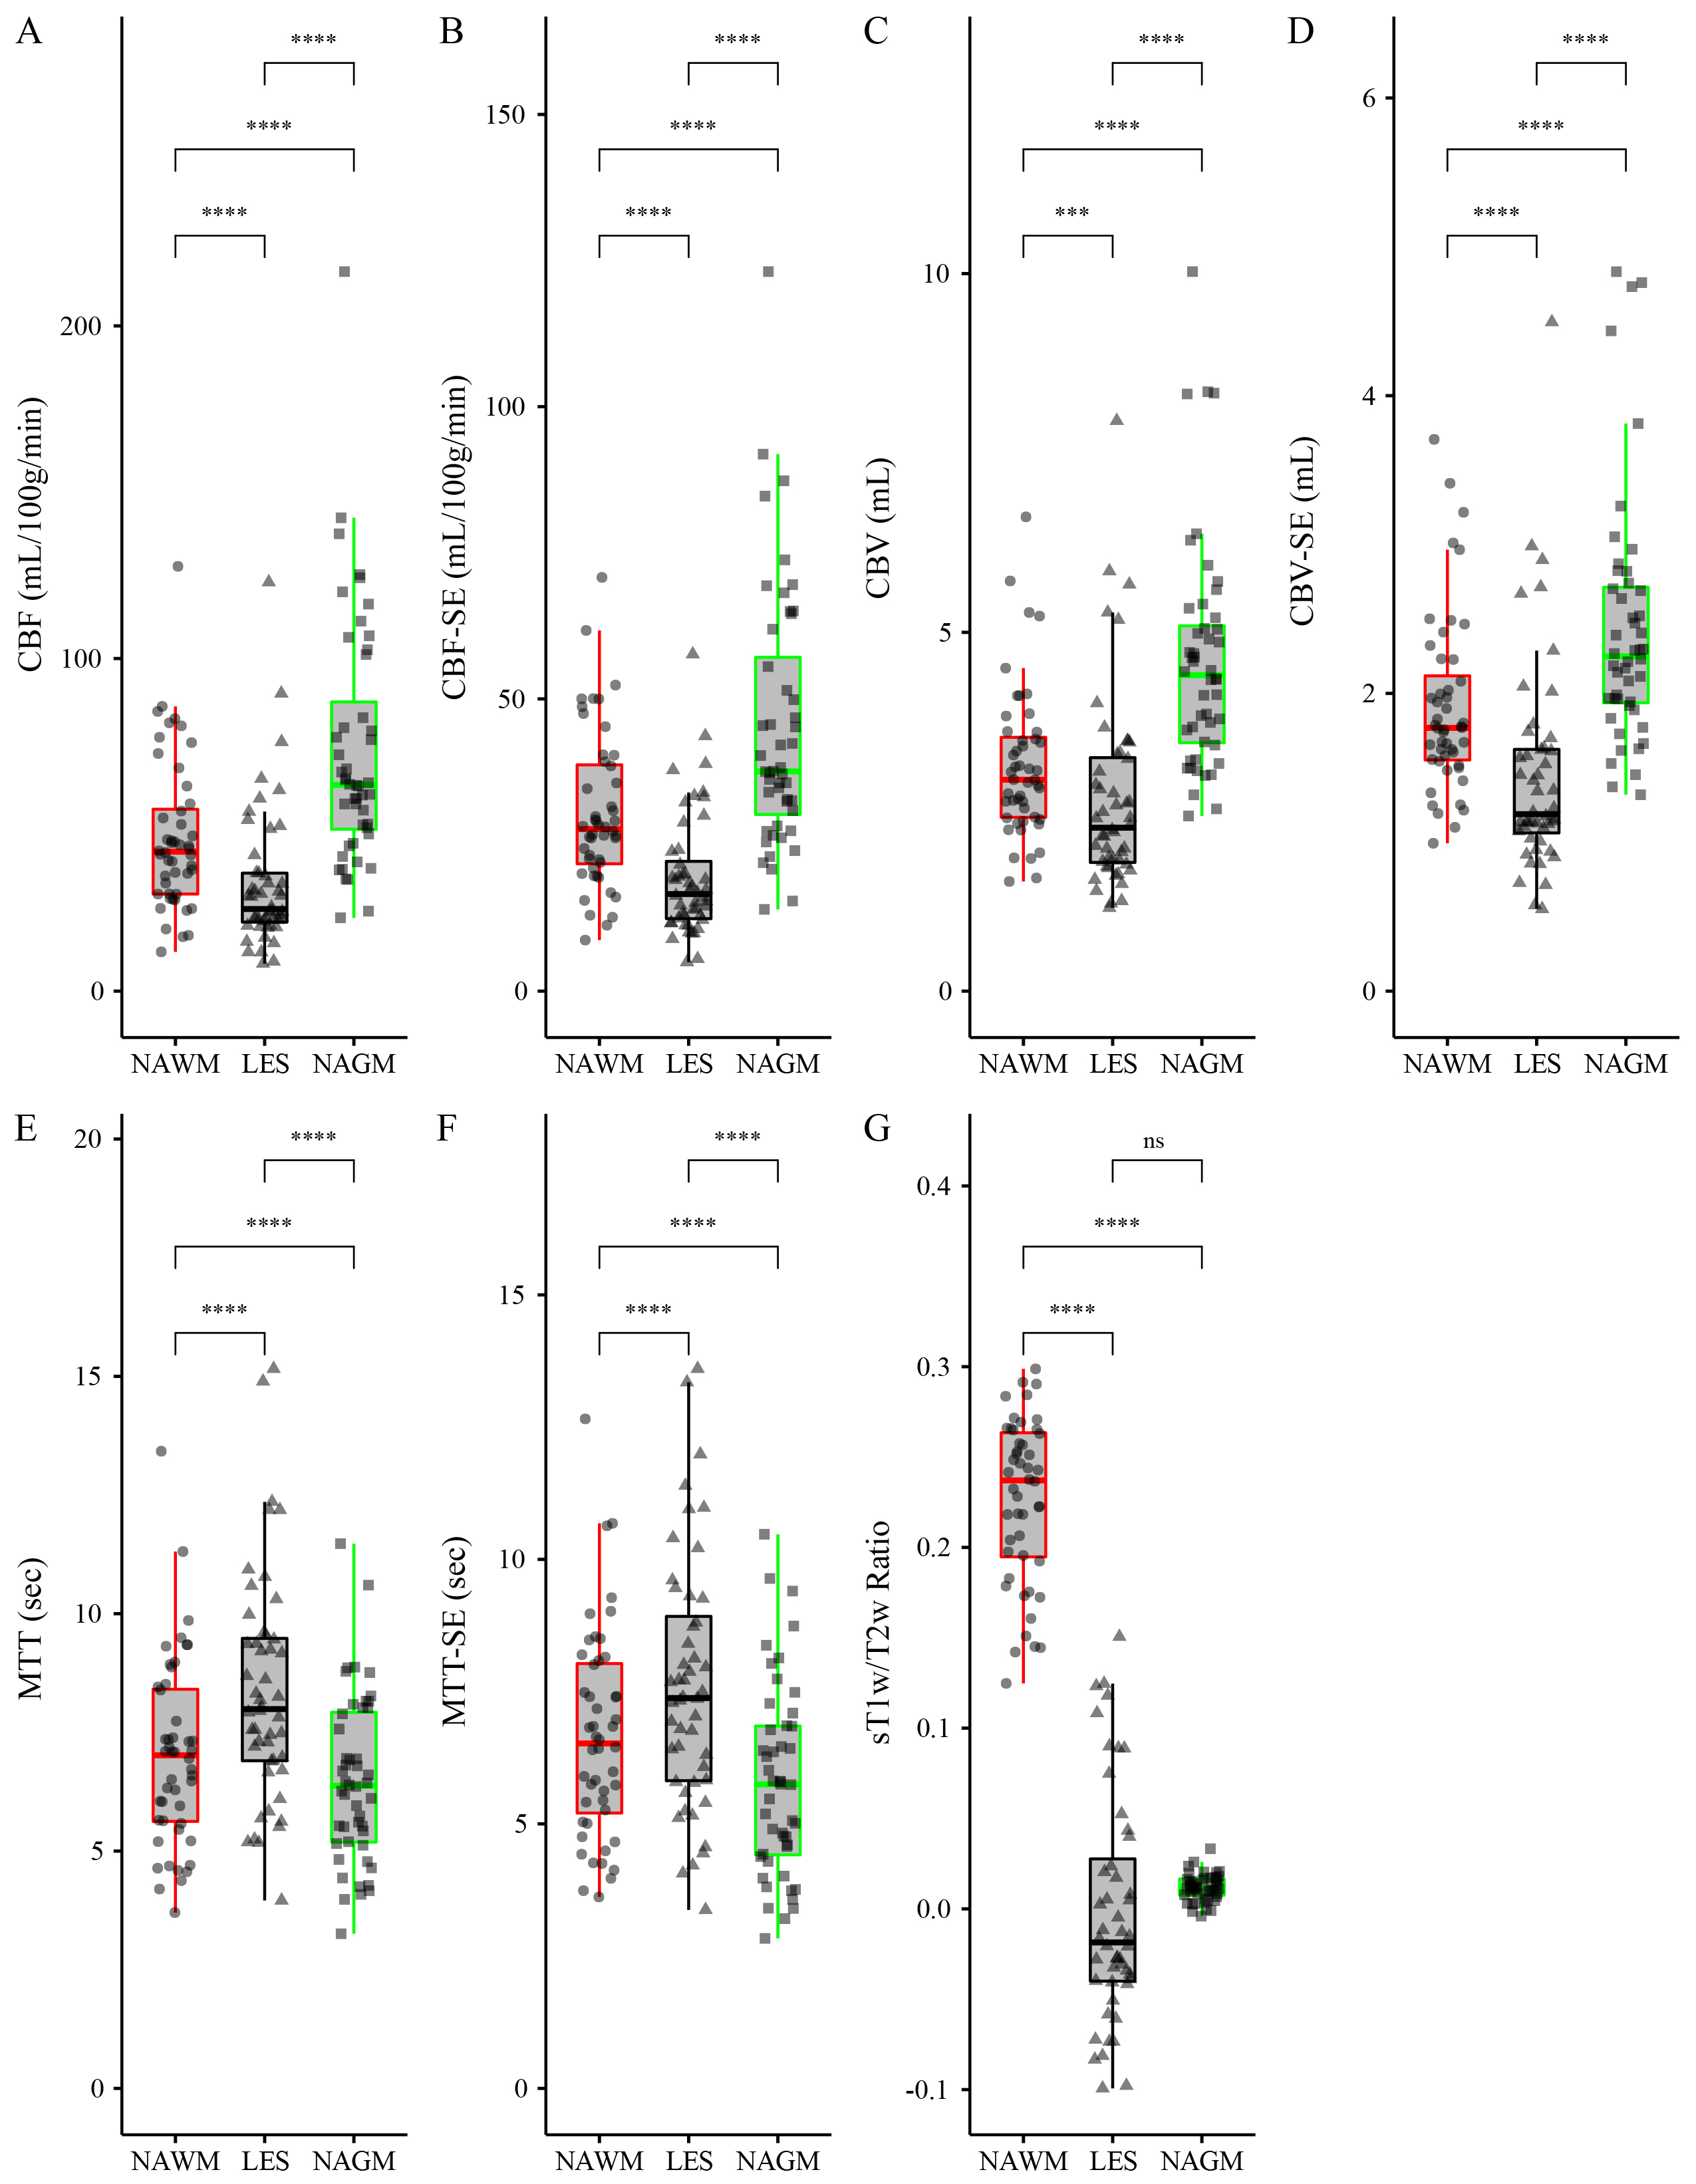
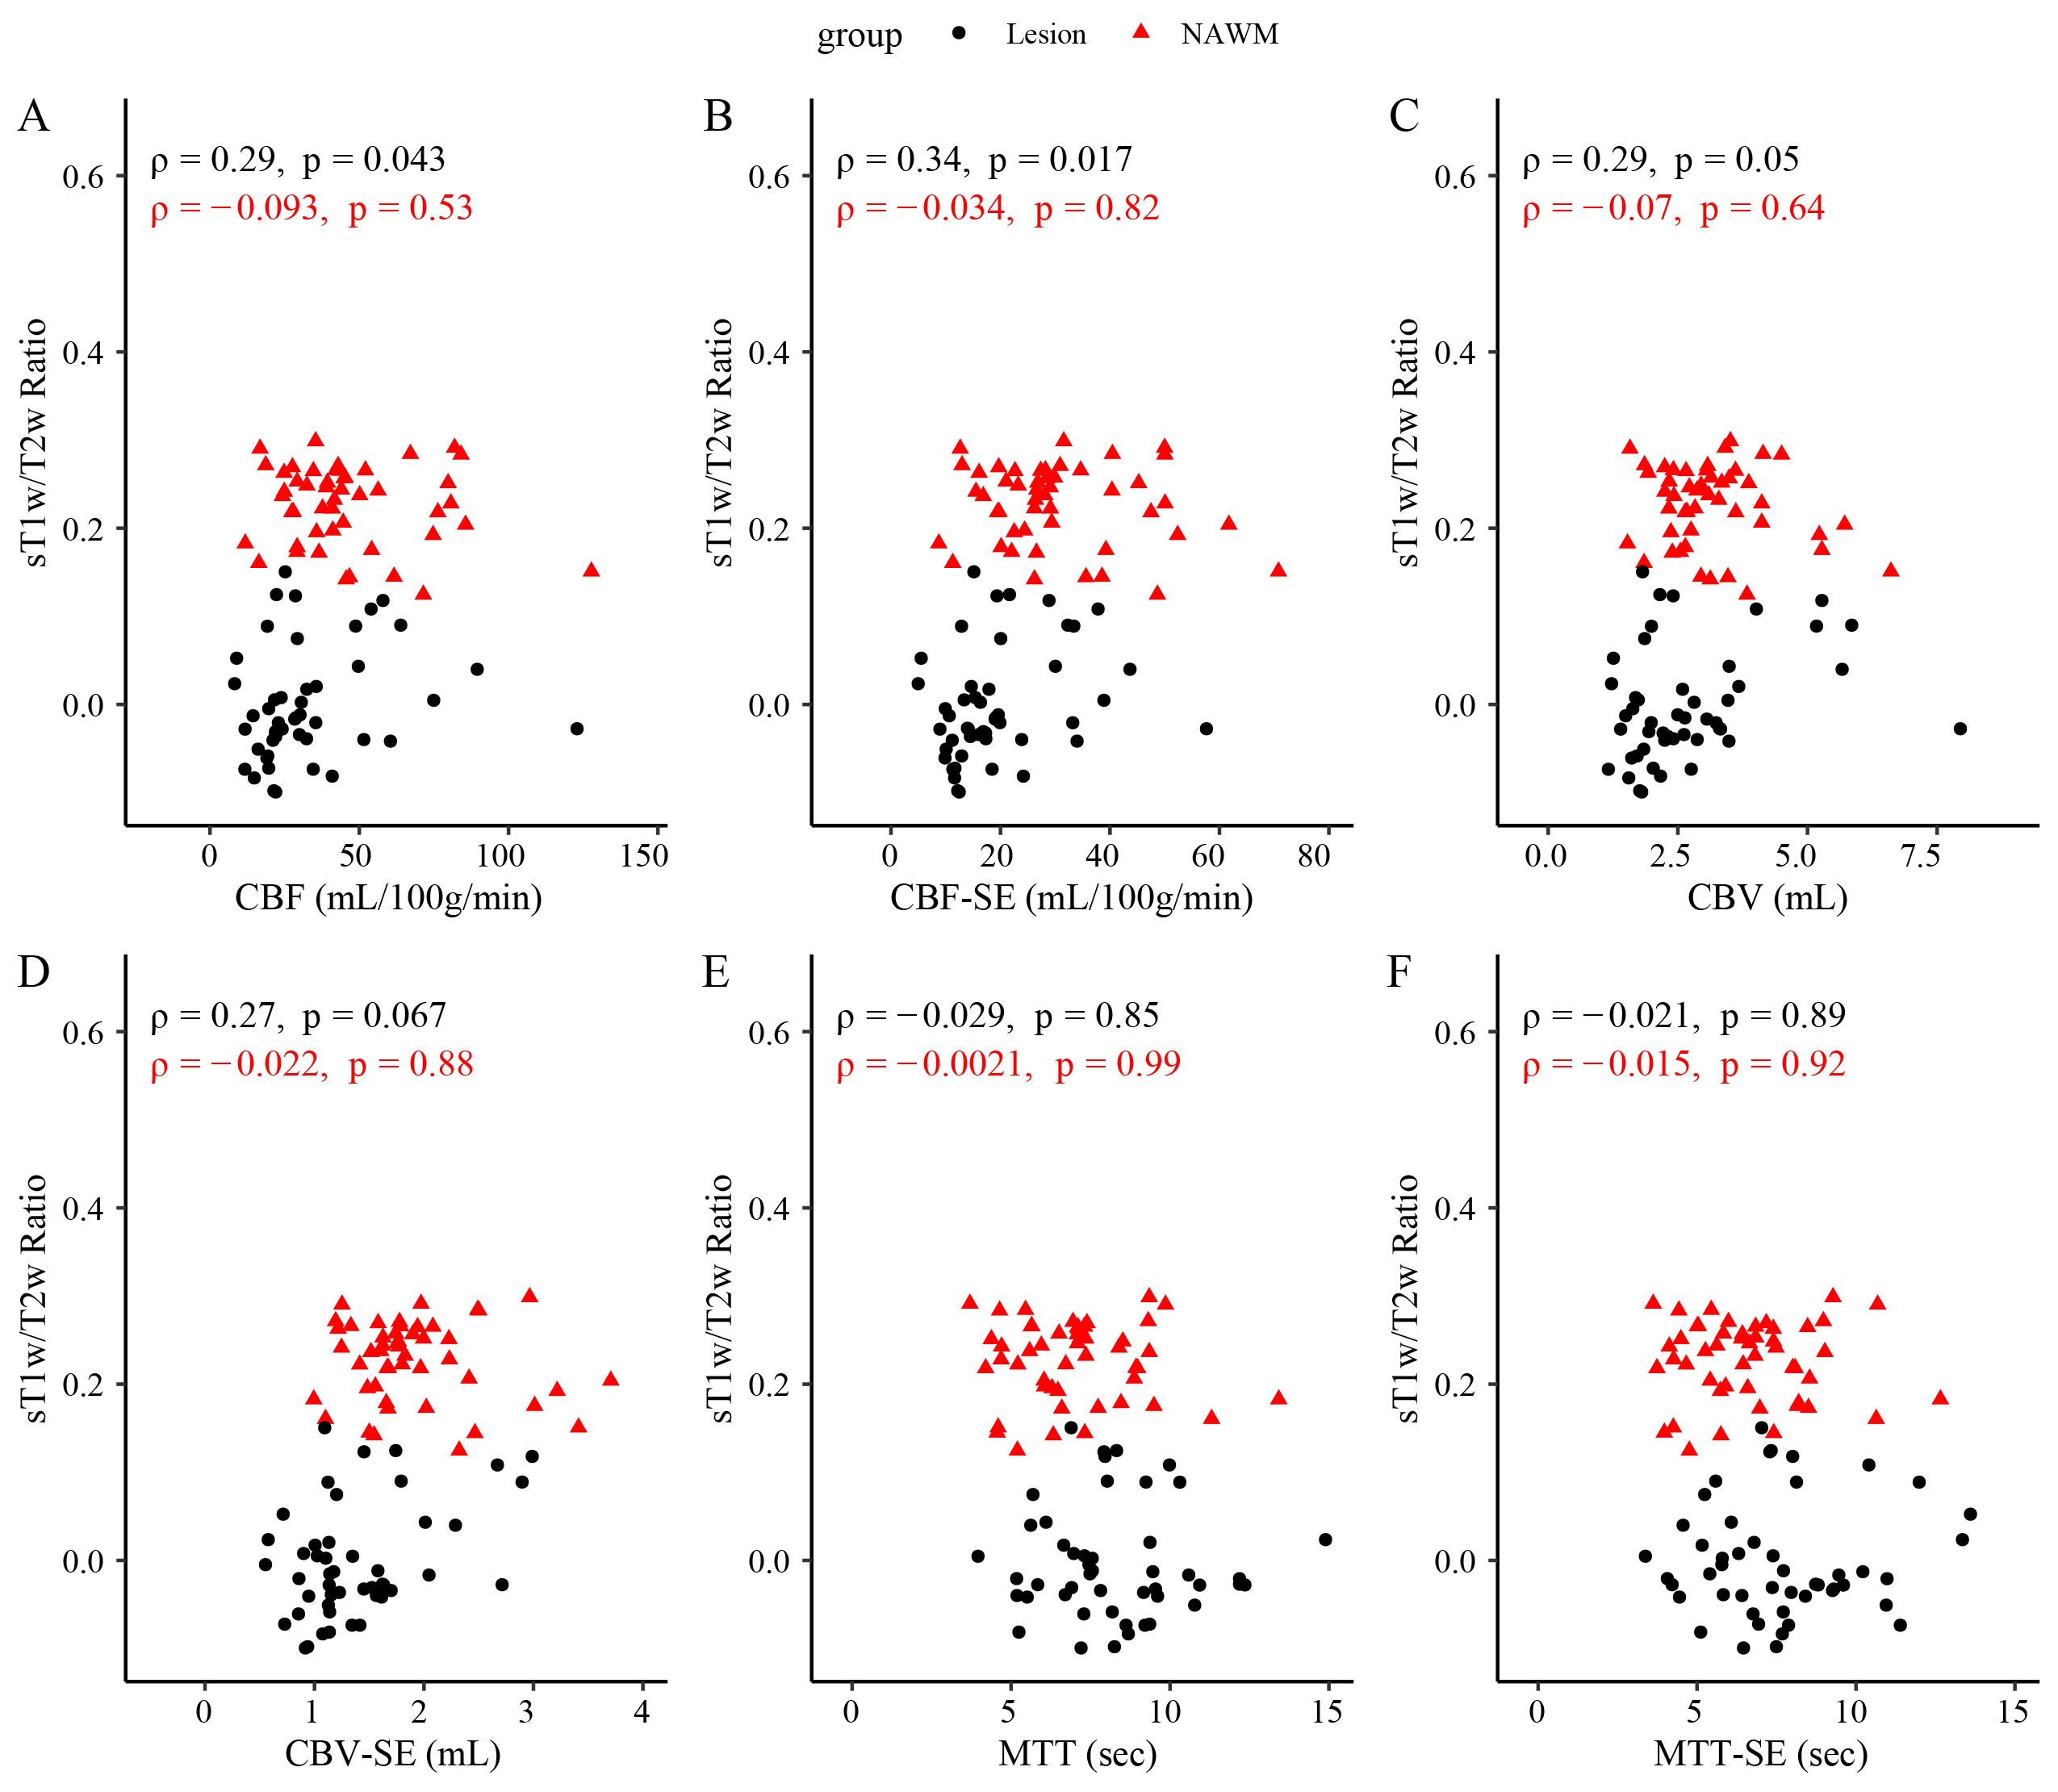
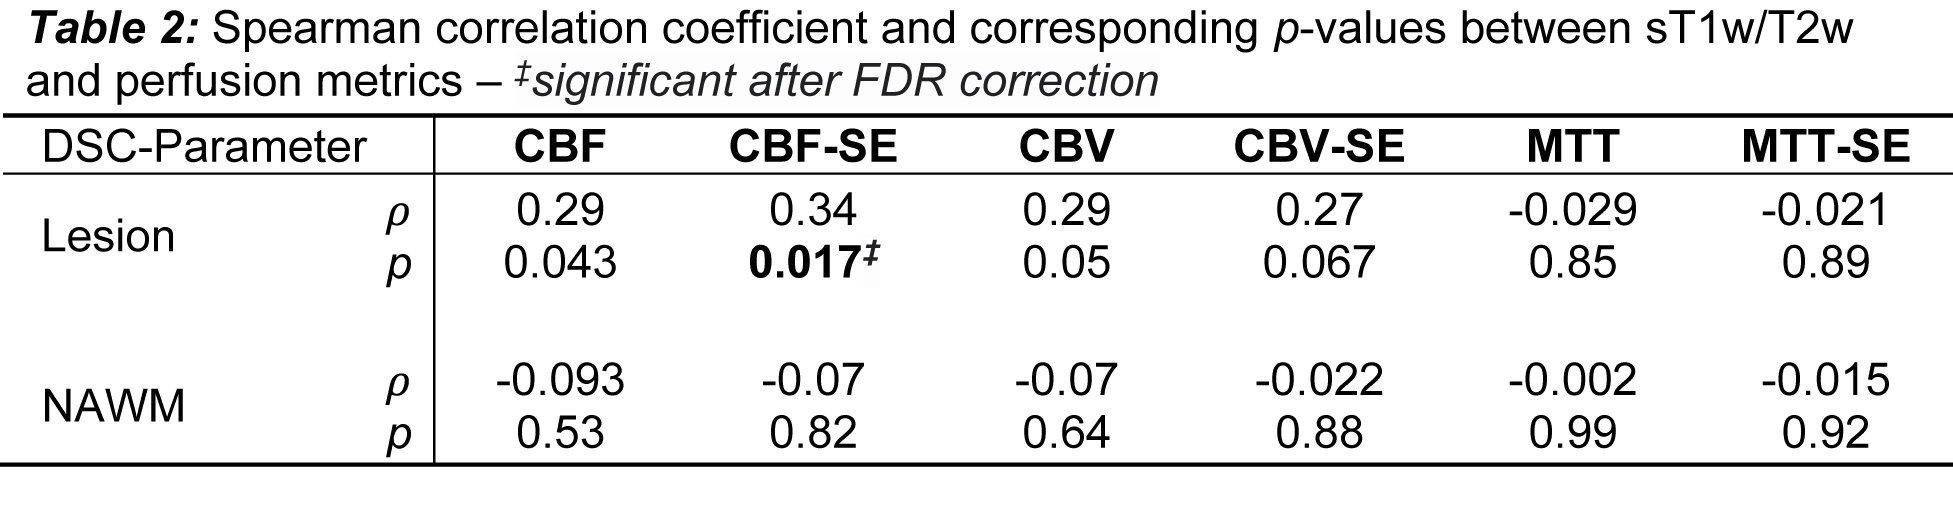
Figure 1 shows the structural images used in this study as well as the SAGE-derived perfusion parameters. Figure 2 shows how tissue ROI median values from each image differ. Significant differences in cerebral perfusion were observed across ROIs, with lesions (macrovascular CBF/CBV = 32.7±3.1/2.7±0.2, microvascular CBF/CBV = 19.5±1.5/CBV = 1.5±0.1) showing significantly decreased perfusion relative to NAGM and NAWM with both microvascular (p ≤ 0.0001) and macrovascular (p ≤ 0.0001) metrics. Figure 3 represents the scatter plot for Spearman rank correlations. Lesion ROIs (mean ± SD) also exhibited significantly lower myelin content (p ≤ 0.0001), as quantified by sT1w/T2w, relative to NAWM — Lesion = -0.001 ± 0.001 NAWM = 0.23 ± 0.007. Microvasculature CBV and CBF showed significant positive Spearman correlations with myelin content in lesions (CBV, ρ = 0.33, p ≤ 0.05; CBF, ρ = 0.31, p ≤ 0.05). No perfusion metrics correlated with myelin in NAWM.Conclusions
Decreases in microvascular blood flow and volume are associated with concomitant reductions in myelination in lesions in patients with RRMS. This association was only observed with the unique microvascular perfusion provided by SAGE, while macrovascular perfusion was less sensitive to myelin changes. This supports the hypothesis that microvascular perfusion and myelin are intrinsically linked, possibly through mechanisms related to myelinating oligodendrocytes. This exploratory study in RRMS shows that SAGE-DSC perfusion has potential to be a useful tool in detecting small vascular changes, which may be critical for understanding damaging demyelination and reparative remyelination. This work was supported by the Barrow Neurological Foundation, NIH R01NS097821, and Philips Healthcare.Acknowledgements
The authors thank Charrid Simpson, RN, MSN, FNP-C, MSCN, and Ashley Nespodzany, MS, for help with patient recruitment, and Maurizio Bergamino, PhD, and Laura Bell, PhD, for many helpful discussions. This work was supported by the Barrow Neurological Foundation and NIH R01NS097821.References
1. Filippi, M. et al. Multiple sclerosis. Nat. Rev. Dis. Prim. 4, 43 (2018).
2. Lapointe, E., Li, D. K. B., Traboulsee, A. L. & Rauscher, A. What have we learned from perfusion MRI in multiple sclerosis? Am. J. Neuroradiol. 39, 994–1000 (2018).
3. Quarles, C. C., Bell, L. C. & Stokes, A. M. Imaging vascular and hemodynamic features of the brain using dynamic susceptibility contrast and dynamic contrast enhanced MRI. Neuroimage 187, 32–55 (2019).
4. Stokes, A. M., Skinner, J. T., Yankeelov, T. & Quarles, C. C. Assessment of a simplified spin and gradient echo (sSAGE) approach for human brain tumor perfusion imaging. Magn. Reson. Imaging 34, 1248–1255 (2016).
5. Stokes, A. M. & Quarles, C. C. A simplified spin and gradient echo approach for brain tumor perfusion imaging. Magn. Reson. Med. 75, 356–362 (2016).
6. Stokes, A. M., Skinner, J. T. & Quarles, C. C. Assessment of a combined spin- and gradient-echo (SAGE) DSC-MRI method for preclinical neuroimaging. Magn Reson Imaging 32, 1181–1190 (2014).
7. Pareto, D. et al. Ratio of T1-Weighted to T2-Weighted Signal Intensity as a Measure of Tissue Integrity: Comparison with Magnetization Transfer Ratio in Patients with Multiple Sclerosis. AJNR. Am. J. Neuroradiol. 41, 461–463 (2020).
8. Glasser, M. F. & van Essen, D. C. Mapping human cortical areas in vivo based on myelin content as revealed by T1- and T2-weighted MRI. J Neurosci 31, 11597–11616 (2011).
9. Misaki, M. et al. Contrast enhancement by combining T1- and T2-weighted structural brain MR Images. Magn. Reson. Med. 74, 1609–1620 (2015).
10. Cooper, G. et al. Standardization of T1w/T2w Ratio Improves Detection of Tissue Damage in Multiple Sclerosis. Front. Neurol. 10, 1–10 (2019).
11. Ganzetti, M., Wenderoth, N. & Mantini, D. Whole brain myelin mapping using T1- and T2-weighted MR imaging data. Front. Hum. Neurosci. 8, 1–14 (2014).
12. Nakamura, K., Chen, J. T., Ontaneda, D., Fox, R. J. & Trapp, B. D. T1-/T2-weighted ratio differs in demyelinated cortex in multiple sclerosis. Ann. Neurol. 82, 635–639 (2017).
Figures