1075
Identification of IDH and TERT Mutation Status in Glioma Patients using Dynamic Susceptibility Contrast MRI1Institute of Biomedical Engineering, Bogazici University, Istanbul, Turkey, 2Department of Medical Pathology, Acibadem Mehmet Ali Aydinlar University, Istanbul, Turkey, 3Center for Neuroradiological Applications and Reseach, Acibadem Mehmet Ali Aydinlar University, Istanbul, Turkey, 4Department of Molecular Biology and Genetics, Acibadem Mehmet Ali Aydinlar University, Istanbul, Turkey, 5Department of Neurosurgery, Acibadem Mehmet Ali Aydinlar University, Istanbul, Turkey, 6Department of Radiology, Acibadem Mehmet Ali Aydinlar University, Istanbul, Turkey
Synopsis
The main purpose of this study was to identify isocitrate dehydrogenase (IDH) and telomerase reverse transcriptase (TERT) promoter mutations in glioma patients using classical machine learning and convolutional neural networks (CNN) on dynamic susceptibility contrast MRI (DSC-MRI). Relative cerebral blood volume (rCBV) maps of glioma patients with different genotypes including IDH-mutant, IDH-wildtype, TERT-mutant, and TERT-wildtype were compared in tumor areas. Classical machine learning classification results were over 85% for both IDH and TERT mutations. On the other hand, CNNs were able to classify IDH mutation status with 83% and TERT mutation status with 72% accuracies.
Introduction
Isocitrate dehydrogenase (IDH) and telomerase reverse transcriptase (TERT) promoter mutations highly affect the prognosis and clinical outcome in gliomas 1-4. However, the current diagnosis methods of gliomas are invasive and have some risks on patients such as infection or stroke during the operation. Therefore, determining the genetic subtype non-invasively could be beneficial for the patients. Recent studies have shown that the IDH mutation is associated with the tumor angiogenesis, and it could be predicted using rCBV maps obtained from DSC-MRI 5,6. Moreover, TERT mutation has been associated with the aggressiveness of gliomas 2,7, for which DSC-MRI might be useful for prediction. Therefore, this study aims to define possible brain perfusion-based signatures for identification of IDH and TERT mutation using voxel wise analysis of rCBV map differences, followed by the classification of IDH and TERT mutation status using classical machine learning algorithms and convolutional neural networks (CNN).Methods
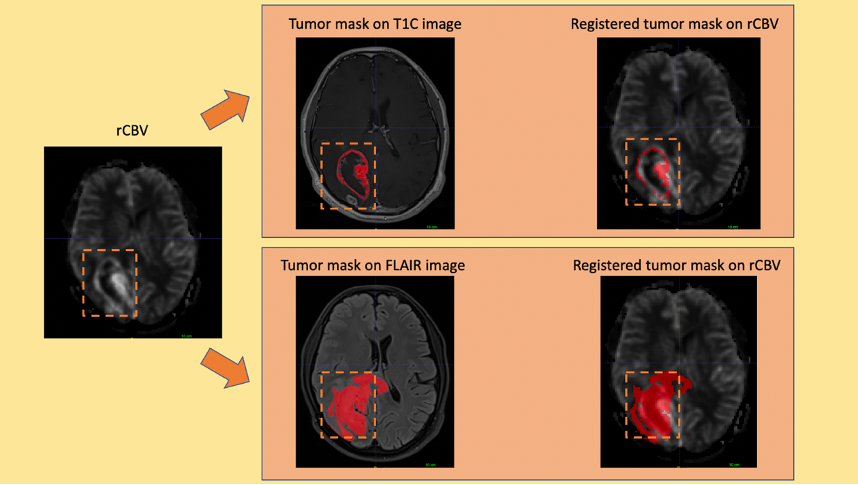
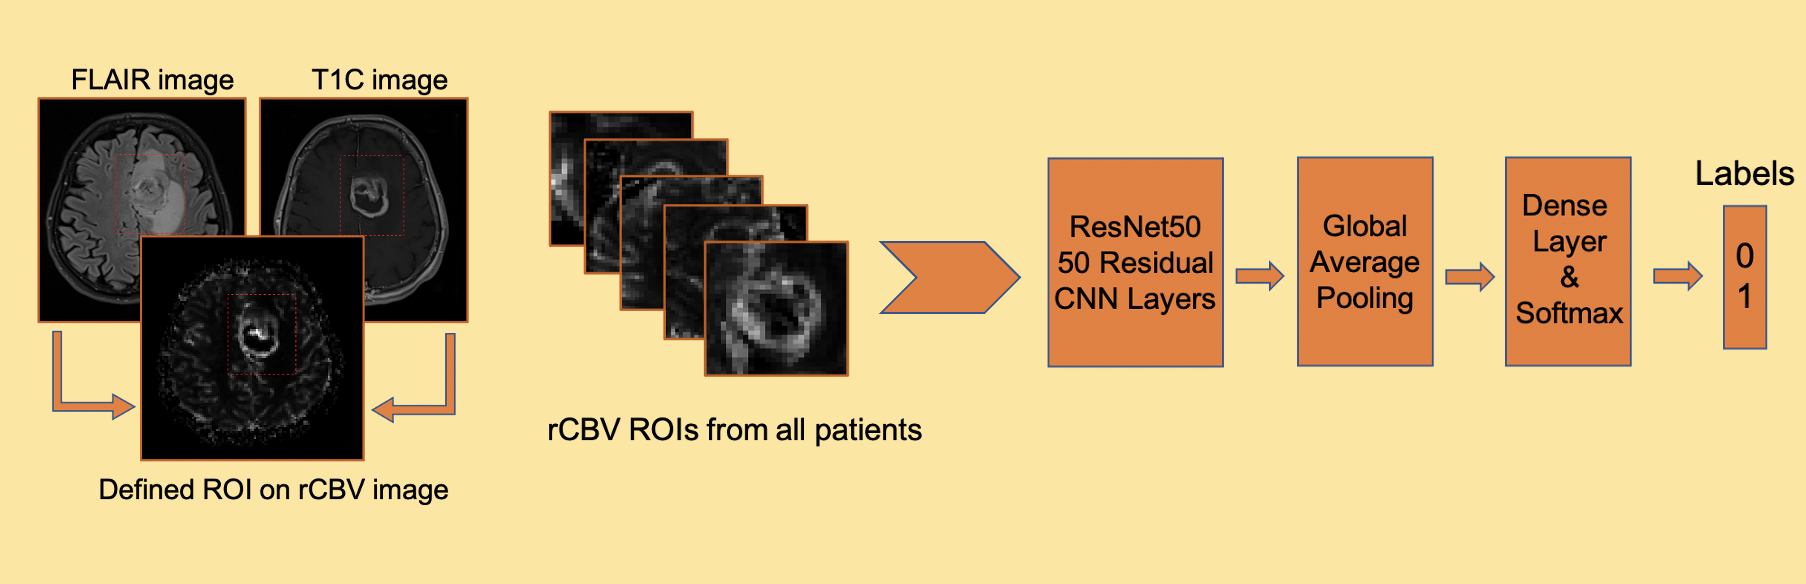
77 glioma patients with different genotypes (M/F=51/26, Age=47.4±13.8, 16 WHO grade II astrocytoma, 20 WHO grade III anaplastic astrocytoma, 41 WHO grade IV glioblastoma, 27 IDH-mutant, 50 IDH-wildtype, 41 TERT-mutant and 28 TERT-wildtype) were included in this study. The patients were scanned on a 3T Siemens MR scanner (Erlangen, Germany) using a 32-channel head coil before surgery. The brain tumor protocol included pre- and post-contrast (gadolinium DTPA) T1-weighted TSE (TR=500 ms, TE=10 ms), T2-weighted TSE (TR=5000 ms, TE=105 ms), and T2*-weighted gradient-echo echo-planar imaging (EPI) dynamic susceptibility contrast (DSC) MRI (TR=1500 ms, TE=30 ms). FLAIR hyperintensity and T1 contrast enhancement (T1C) were segmented, and the corresponding tumor masks were registered to rCBV maps obtained from DSC-MRI using FMRIB Software Library (FSL) (Figure 1). The histogram properties such as maximum, mean, standard deviation, kurtosis and skewness of the rCBV values within the tumor regions were calculated using an in-house program written in MATLAB 2020a (The MathWorks Inc., Natick, MA). A t-test was applied to detect statisticaly significant differences between IDH and TERT mutational subgroups. Then, these different histogram properties were used as input features for different machine learning algorithms. Different supervised learning algorithms were evaluated with 5-fold cross validation using the Classification Learner application of MATLAB. The class imbalance problem8 was resolved by synthetic minority oversampling technique (SMOTE)9. The overall classification accuracy, specificity and sensitivity were calculated before and after oversampling. As a final step, a CNN architecture was used to identify IDH and TERT mutations based on rCBV images that contain the tumor region (Figure 2). For classification task, ResNet5010 was used as a pre-trained CNN to initialize the weights. Then, data was augmented using flipping, cropping, and rotating the images. Learning rate (LR) was 0.001, ADAM optimizer and binary cross entropy loss function were used during training with 50 epochs and batch size of 16.Results
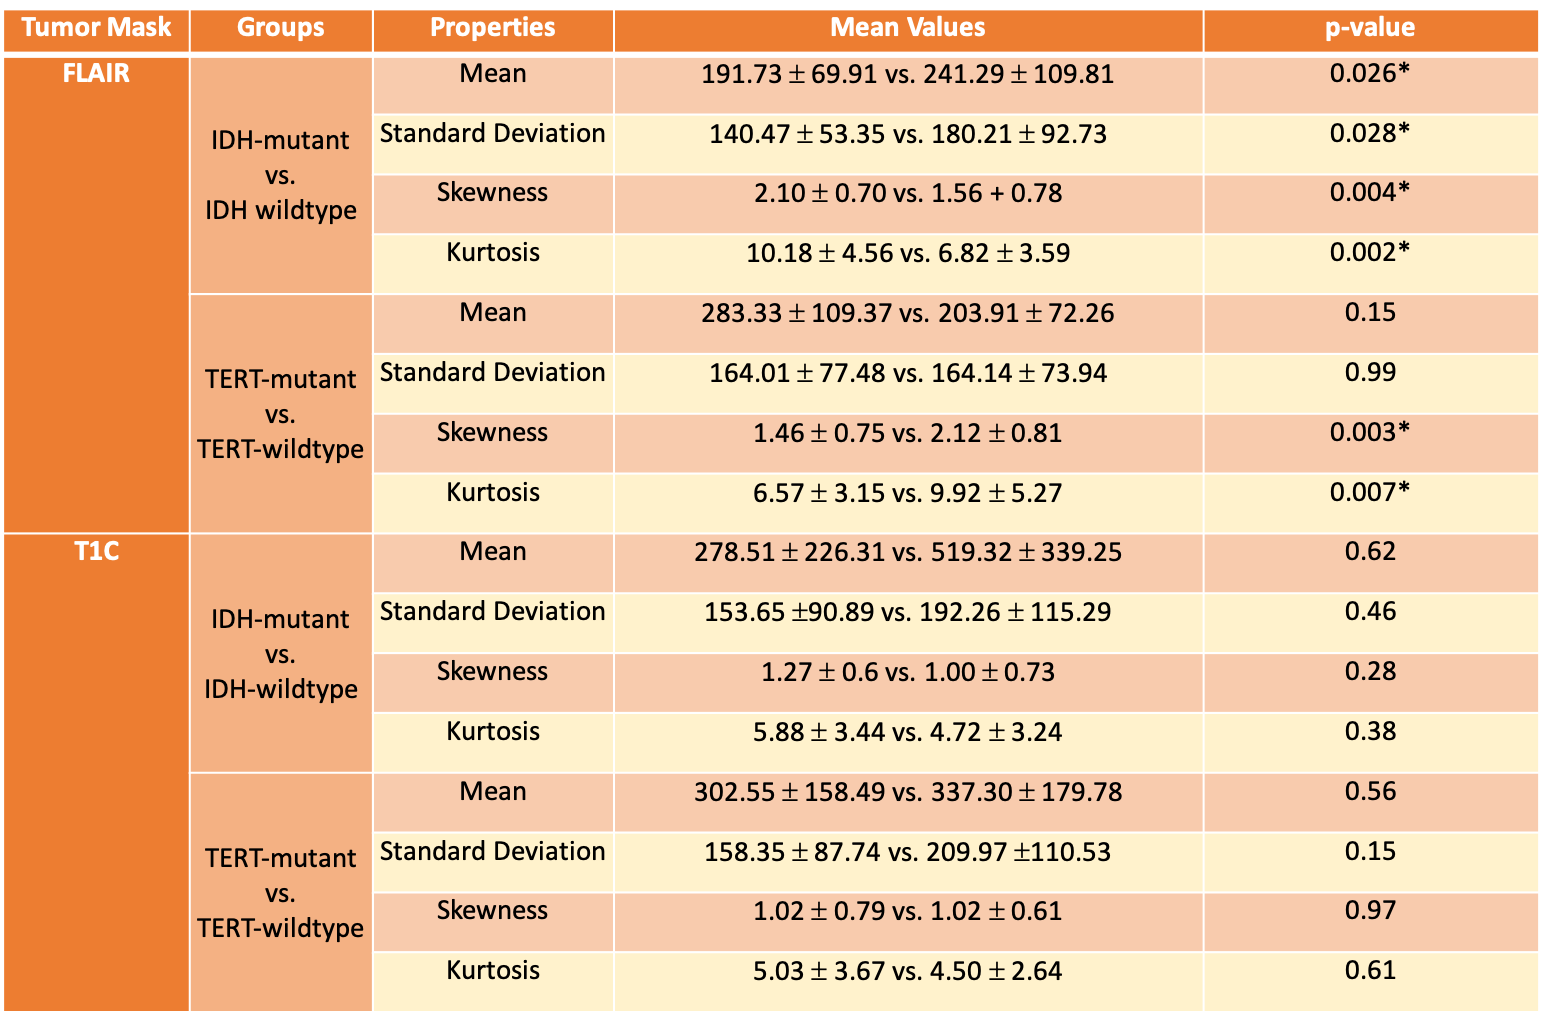
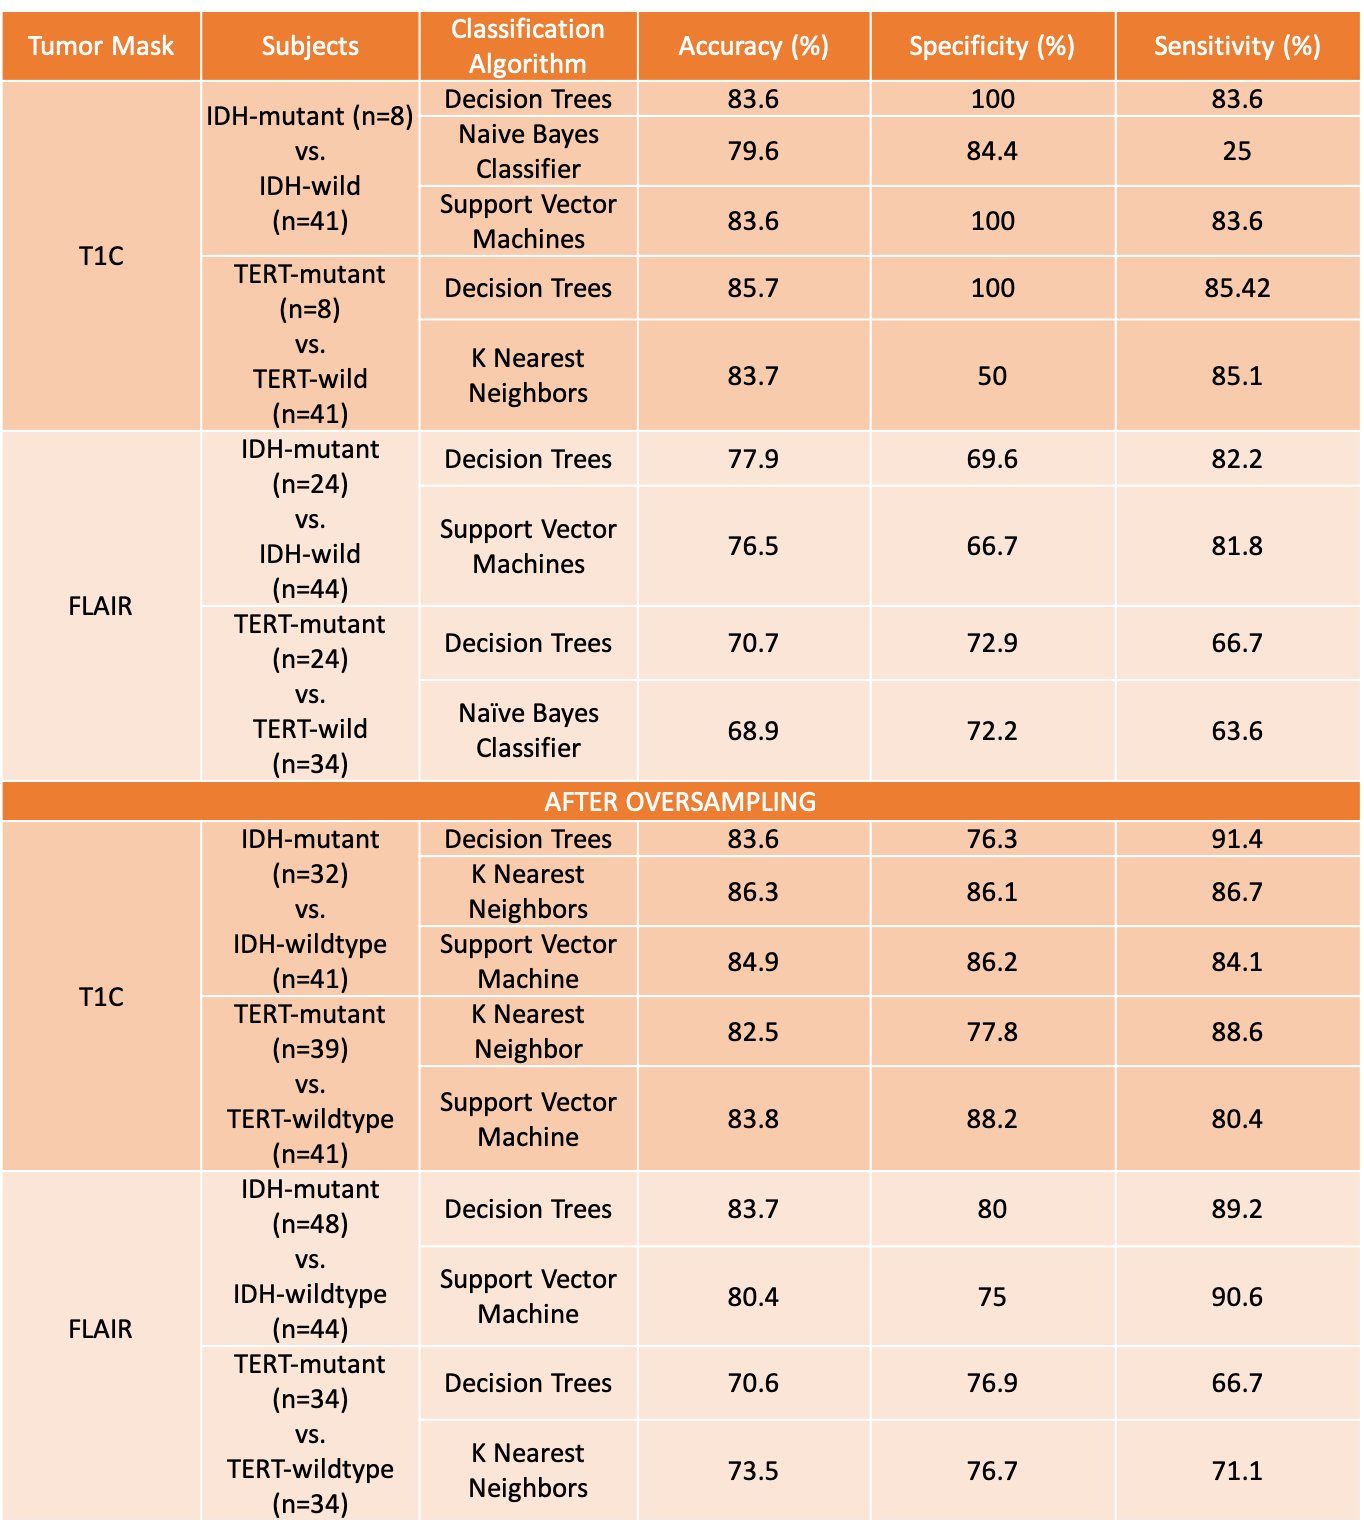
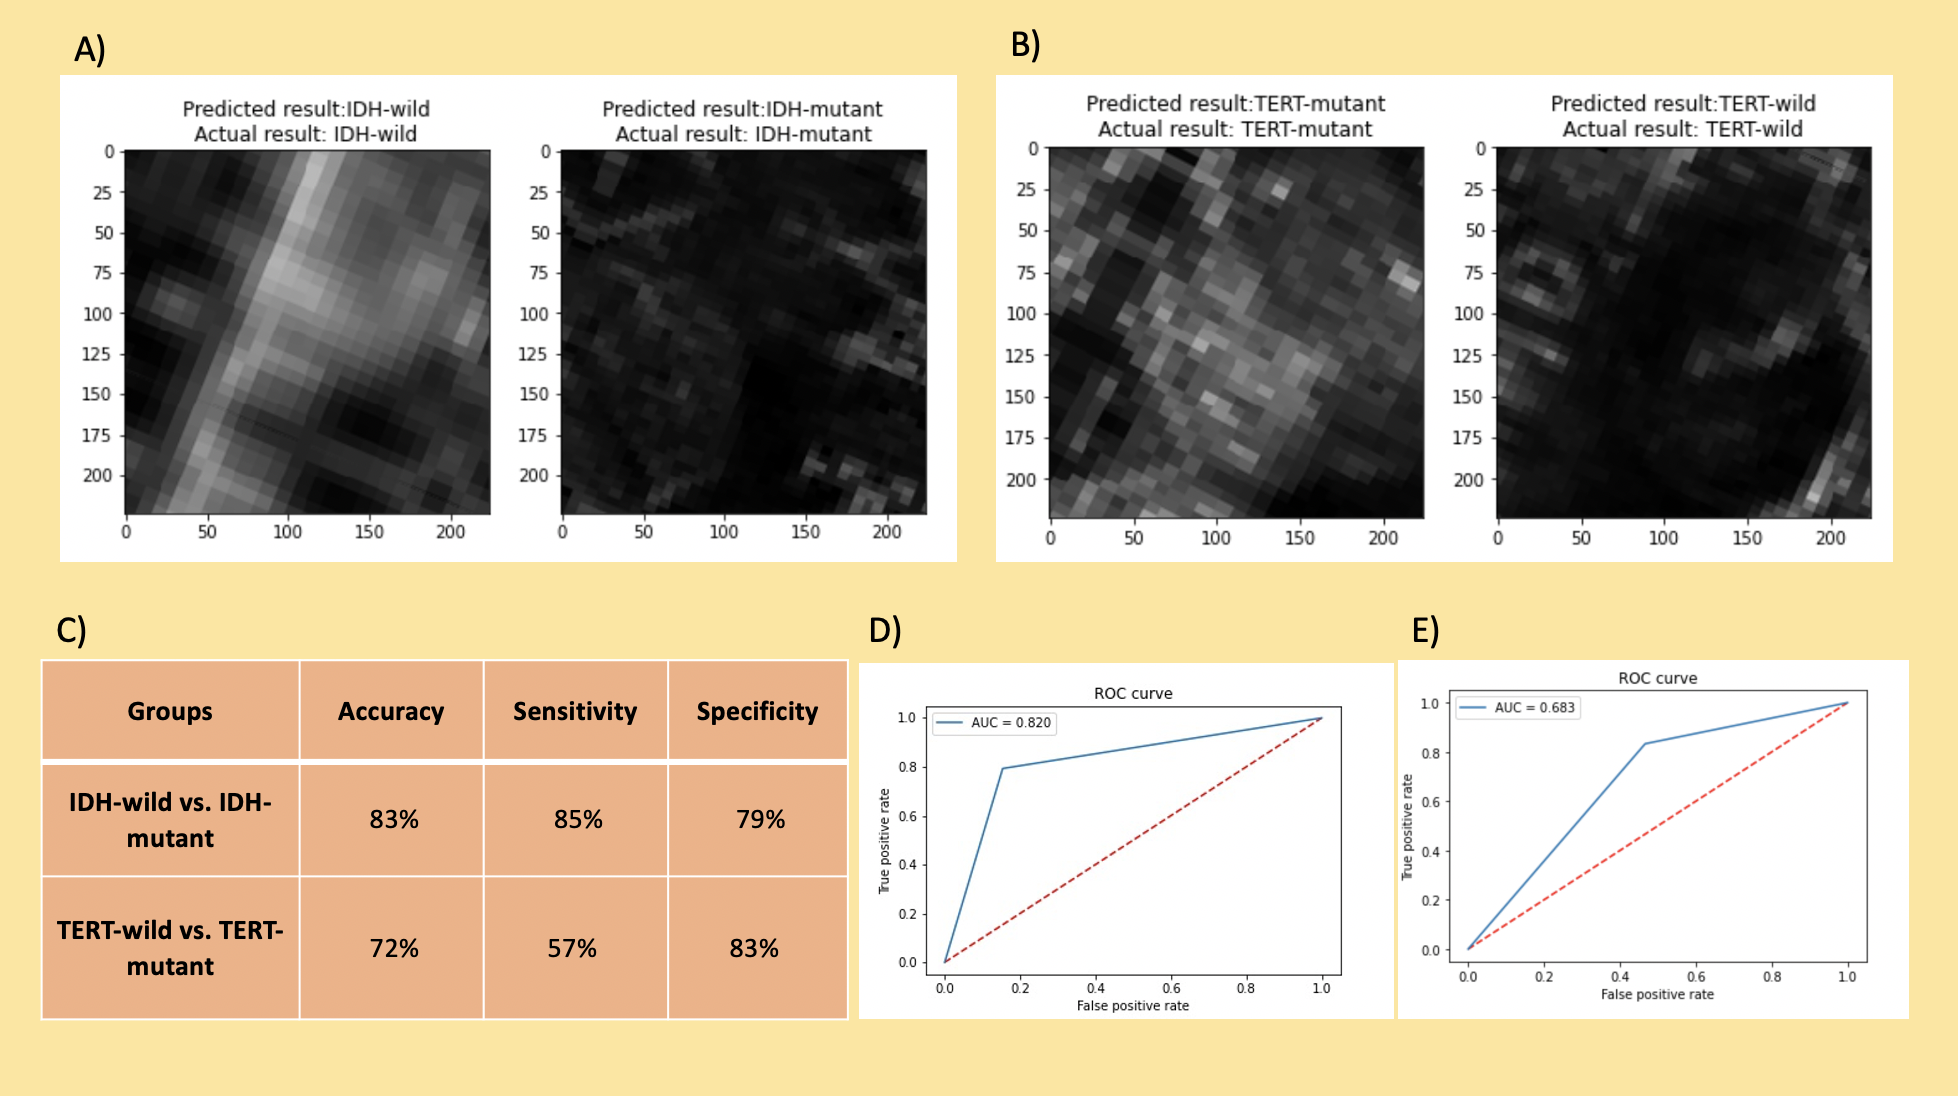
The rCBV histogram properties were statistically significantly different in FLAIR hyperintense but not T1C regions for both IDH and TERT comparisons (Table 1). For the classification of both IDH and TERT mutation status, the rCBV values within T1C gave better results than rCBV values within FLAIR hyperintensity (Table 2). IDH-mutant and IDH-wildtype patients were classified with 83.6% accuracy (sensitivity = 83.6%, specificity = 100%) using decision trees. Additionally, the classification accuracy of TERT-mutant vs TERT-wildtype was 85.7% (sensitivity = 83.7%, specificity = 100%) using the same algorithm. After using SMOTE as the oversampling technique to increase the number of instances in the minority classes, IDH mutation status was classified with 86.3% accuracy (sensitivity = 91.4%, specificity = 76.3%) using rCBV within T1C, and 83.7% accuracy (sensitivity = 89.2%, specificity = 80%) using rCBV within FLAIR (Table 2). Similarly, TERT mutation status was classified with 83.8% accuracy (sensitivity = 80.4%, specificity = 88.2%) using rCBV within T1C with support vector machine algorithm and 73.5% accuracy (sensitivity = 71.1%, specificity = 76.7%) using rCBV within FLAIR hyperintensity with k-nearest neighbor algorithm. Using deep learning approach, IDH mutation status was classified with 83% accuracy (sensitivity = 85%, specificity = 79%) and TERT mutation status was classified with 72% accuracy (sensitivity = 57%, specificity = 83%) (Figure 3).Conclusion and Discussion
This result of this study indicated that both IDH-mutant vs IDH-wildtype and TERT-mutant vs TERT-wildtype groups were successfully classified using rCBV maps acquired by DSC-MRI. Additionally, using rCBV values within T1C tumor masks resulted in better classification performance with classical machine learning algorithms. However, considering the preprocessing steps in machine learning approach, the deep learning approach was advantageous because it progressed without feature engineering. Future studies will improve deep learning results by further optimizing the parameters on larger datasets.Acknowledgements
This study was supported by TUBITAK project #216S432References
1. Cancer Genome Atlas Research Network. Comprehensive, integrative genomic analysis of diffuse lower-grade gliomas. New England Journal of Medicine 2015;372(26):2481-98.
2. Eckel-Passow JE, Lachance DH, Molinaro AM, Walsh KM, Decker PA, Sicotte H, et al. Glioma Groups Based on 1p/19q, IDH, and TERT Promoter Mutations in Tumors. New England Journal of Medicine 2015;372(26):2499-508.
3. Ogura R, Tsukamoto Y, Natsumeda M, Isogawa M, Aoki H, Kobayashi T, et al. Immunohistochemical profiles of IDH1, MGMT and P53: practical significance for prognostication of patients with diffuse gliomas. Neuropathology: official journal of the Japanese Society of Neuropathology 2015;35(4):324-35.
4. Takano S, Ishikawa E, Sakamoto N, Matsuda M, Akutsu H, Noguchi M, et al. Immunohistochemistry on IDH 1/2, ATRX, p53 and Ki-67 substitute molecular genetic testing and predict patient prognosis in grade III adult diffuse gliomas. Brain tumor pathology 2016;33(2):107-16.
5. Kickingereder P, Sahm F, Radbruch A, Wick W, Heiland S, Von Deimling A, et al. IDH mutation status is associated with a distinct hypoxia/angiogenesis transcriptome signature which is non-invasively predictable with rCBV imaging in human glioma. Scientific reports 2015;5:16238.
6. Hong EK, Choi SH, Shin DJ, Jo SW, Yoo RE, Kang KM, et al. Radiogenomics correlation between MR imaging features and major genetic profiles in glioblastoma. European Radiology 2018;28(10):4350-61.
7. Arita H, Narita Y, Fukushima S, Tateishi K, Matsushita Y, Yoshida A, et al. Upregulating mutations in the TERT promoter commonly occur in adult malignant gliomas and are strongly associated with total 1p19q loss. Acta neuropathologica 2013;126(2):267-76.
8. Vabalas A, Gowen E, Poliakoff E, Casson AJ. Machine learning algorithm validation with a limited sample size. PloS one 2019;14(11):e0224365.
9. Chawla NV, Bowyer KW, Hall LO, Kegelmeyer WP. SMOTE: synthetic minority over-sampling technique. Journal of artificial intelligence research 2002;16:321-57.
10. He K, Zhang X, Ren S, Sun J. Deep residual learning for image recognition. Proceedings of the IEEE conference on computer vision and pattern recognition. 770-8
Figures