1072
Exploring the Application of an Advanced-Diffusion-Model-Based Radiomics Model in detecting radiation-induced brain injury1MR Scientific Marketing, Siemens Healthcare, Guangzhou, China, 2Sun Yat-sen Memorial Hospital, Sun Yat-sen University, Guangzhou, China
Synopsis
The aim of this study was to elucidate a multiple diffusion-model-based radiomics model in detecting radiation-induced brain injury (RI). We used diffusion features derived from DTI, DKI, NODDI and MAP-MRI models and chose LR as the classifier to construct a prediction model. The results showed that the most accurate prediction was achieved by incorporating the DKI-AD and RTPP into a nomogram, with AUC and accuracy reached 0.8356 and 0.8182.
Introduction
Radiation-induced brain injury (RI) is a serious complication of partial or whole-brain irradiation for patients with head and neck cancer or glioma. The mechanisms include neuroinflammation, disruption of endothelial cells and blood-brain barrier, and radiation-induced apoptosis, including oligodendrocytes, subependymal cells, and neurons[1]. The changes in microstructure of RI assessed by imaging technique were worth of study. Previous studies showed that diffusion tensor imaging (DTI) based on Gaussian distribution, diffusion kurtosis imaging (DKI) reflecting non-Gaussian behavior of water diffusion, neurite orientation dispersion and density imaging (NODDI) representing tissue characteristics and mean apparent propagator (MAP)-MRI based on the random motion distribution of real water molecules can reflect the changes of microstructure[2-3]. This study aims to investigate the application of a radiomics model based on the diffusion parameters of DTI, DKI, NODDI and MAP-MRI models in patients with RI.Methods
A total of 33 patients with RI (average age 53.02 ± 11.25 years, 24 males, 9 females) and 11 normal controls (NCs) (average age 53.02 ± 11.25 years, 7 males, 5 females) were recruited. All patients underwent MRI scan. All patients underwent MRI examinations on a 3.0T MR scanner (MAGNETOM Skyra, Siemens Healthcare, Erlangen, Germany) using a 20-channel head coil. Diffusion spectrum imaging (DSI) using q-space half coverage diffusion mode (TR/TE, 4900 ms/93 ms; flip angle, 90°; NEX,1; voxel dimension of 2 × 2 × 4 mm3; 32 slices; matrix, 110 × 110; FOV, 220 × 220 mm; ) along 128 gradient directions with maximum b-value at 2000 s/mm2 were performed to obtain diffusion-weighted (DW) data.For diffusion model estimation and radiomics feature extraction, the parameters of NODDI, including intra-neurite volume fraction (ICVF), decreased orientation dispersion index (ODI) and volume fraction of the isotropic compartment (ISOVF) values, MAP-MRI including return-to-origin probability (MAP-RTOP), return to axis probability (MAP-RTAP), return to plane probability (MAP-RTPP), mean squared displacement (MAP-MSD) and Q-space inverse variance (MAP-QIV), DTI including axial, radial, and mean diffusivity (DTI-AD, DTI-RD, DTI-MD) and fractional anisotropy (DTI-FA), and DKI including radial, axial, and mean kurtosis (DKI-RK, DKI-AK, DKI-MK), DKI-MD, DKI-AD, DKI-RD, and DKI-FA were calculated by software (NeuDiLab) developed in-house based on the open-resource tool DIPY (Diffusion Imaging In Python, http://nipy.org/dipy. For each patient, the maximum cross-sectional area of the edema focal on the T2WI was manually drawn as the region of interest (ROI) of the edema lesions of RI by visual inspection. And then the ROI was copied to all diffusion maps to calculate the corresponding average (figure 1).
For the radiomics features analysis, an open source tool called FeAture Explorer (FAE, v0.1.1, https://github.com/salan668/FAE) was used. We selected 66 cases as the training and validation data set. First, the features clean and preparation were performed. The data of negative group was up-sampled to balance the two sets of samples. The range of each feature was normalized to unit. If two features were similar to each other (dot product larger than 0.86), we removed one of them randomly to reduce the dimension of the feature space. Second, the feature selection was performed before model development using analysis of variance (ANOVA). Lastly, we trained the model by logistic regression (LR) with linear kernel.To investigate the performance of the model, we applied cross validation with 10-folder on the data set. The performance of the model was evaluated using receiver operating characteristic (ROC) curve analysis. The area under the ROC curve (AUC) was calculated for quantification. The accuracy, sensitivity, specificity, positive predictive value (PPV), and negative predictive value (NPV) were also calculated at a cutoff value that maximum the value of the Yorden index.
Results
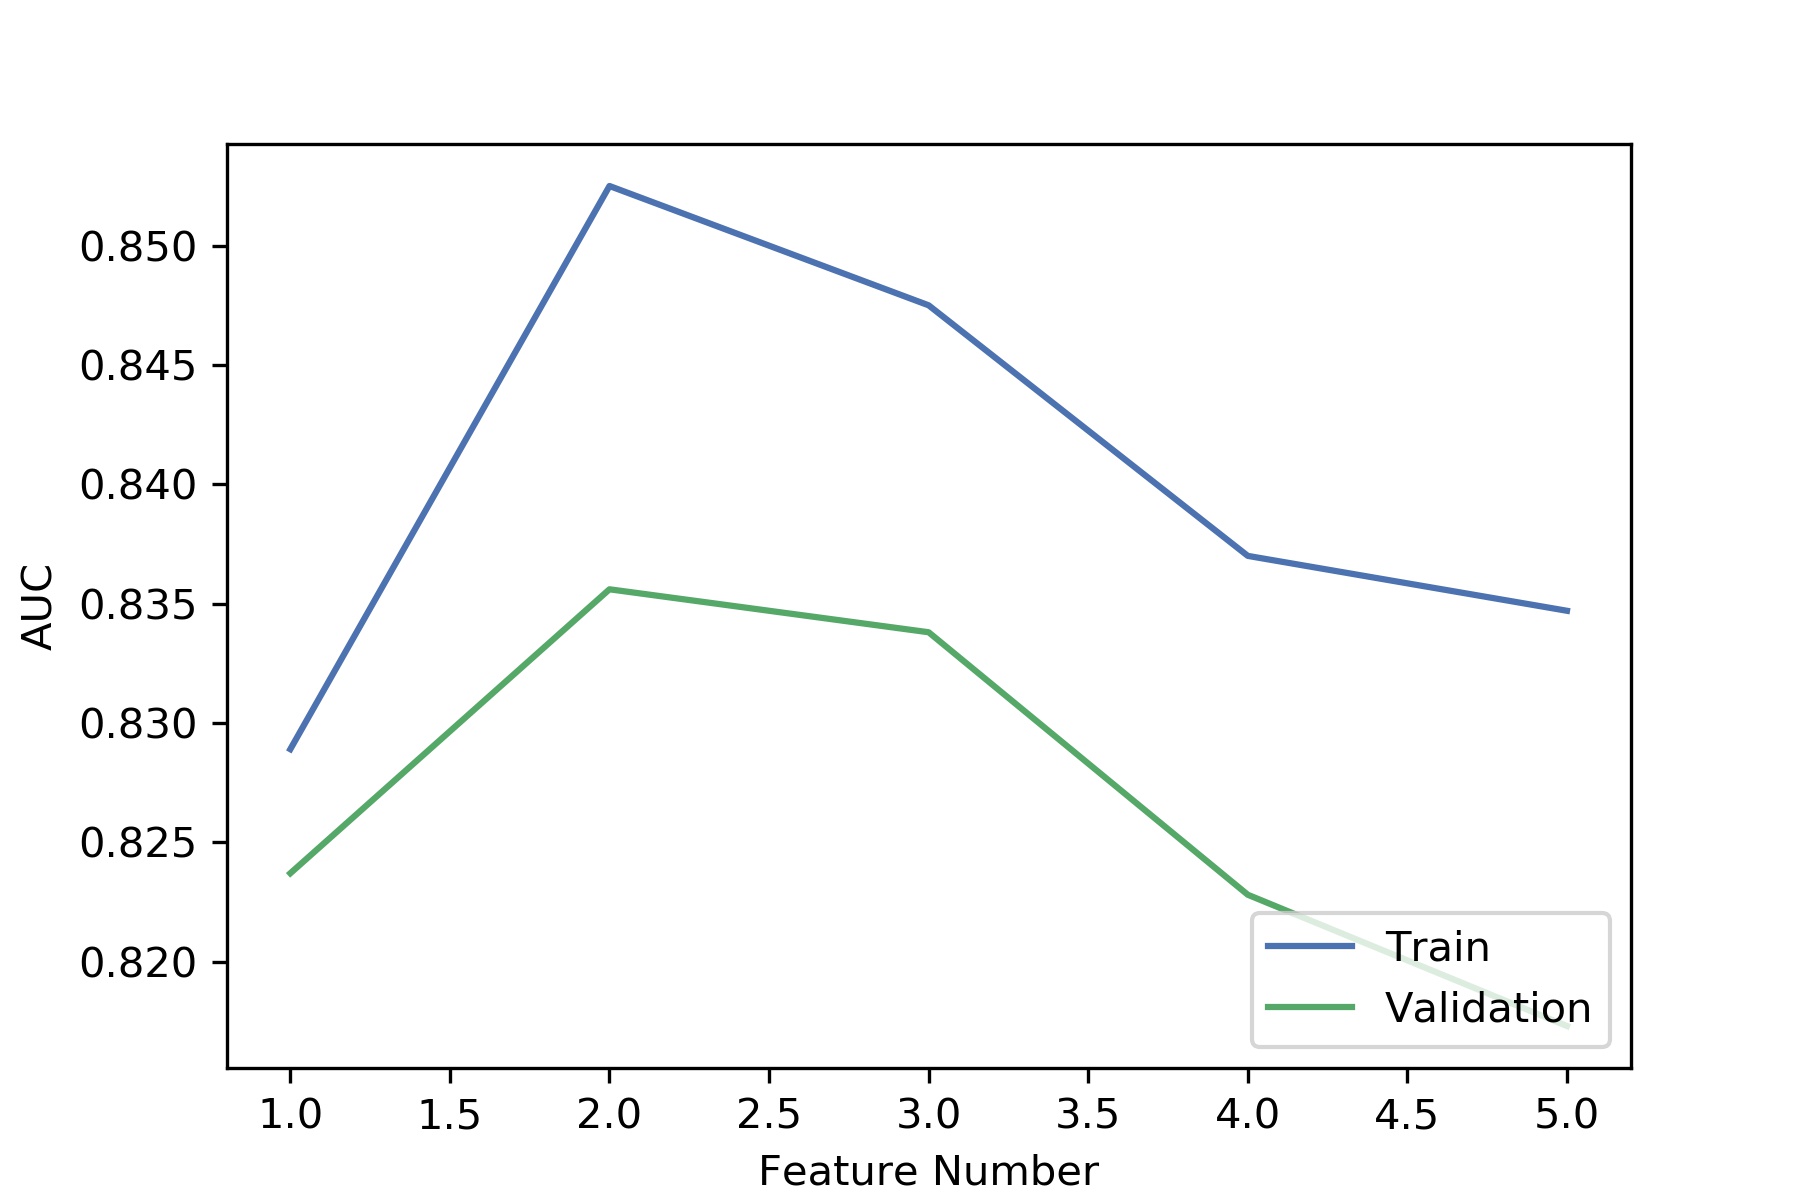
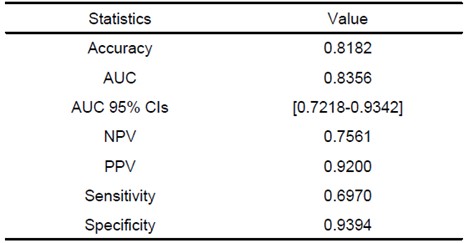
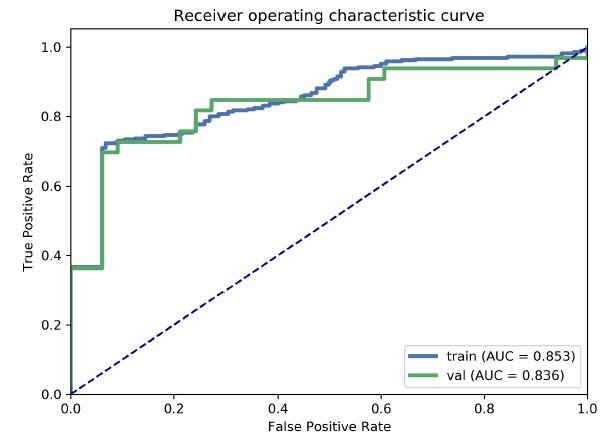
We found that the model based on 2 features including DKI-AD and RTPP can get the highest AUC on the validation data set (Figure 1). The AUC and the accuracy could achieve 0.836 and 0.818, respectively. The clinical statistics in the diagnosis were shown in Table 1. The ROC curve was shown in Figure 2.Discussion
Our findings demonstrated that the radiomics features based on multiple diffusion parameters could be used to detect radiation-induced brain injury. The highest prediction accuracy was acquired by incorporating the following DKI-AD and RTPP into a nomogram. The results confirmed that MAP-MRI and DKI model showed higher potential in grading of detect radiation-induced brain injury than DTI and NODDI models. Therefore, our results indicated that selected key features achieved an excellent classifying performance.Conclusion
We developed and validated an effective radiomics model for detect radiation-induced brain injury. Our results suggested that combining MAP-MRI and DKI parameters in the radiomics model could be used to accurately diagnosis radiation-induced brain injury.Acknowledgements
No acknowledgement found.References
[1].Yang, L., et al., Pathophysiological Responses in Rat and Mouse Models of Radiation-Induced Brain Injury. Mol Neurobiol, 2017. 54(2): p. 1022-1032.
[2]. Kodiweera, C., et al., Effects and Sex Differences in Human Brain White Matter of Young to Middle-Aged Adults: A DTI, NODDI, and q-Space Study. Neuroimage. 2016; 128: 180–192
[3]. Le et al., Mean Apparent Propagator MRI is Better Than Conventional Diffusion Tensor Imaging for the Evaluation of Parkinson’s Disease: A Prospective Pilot Study. Frontiers in Aging Neuroscience 2020; 12
Figures