1071
Separate NAAG and NAA quantification after pediatric mild traumatic brain injury in the acute phase.1Clinical and Research Institute of Emergency Paediatric Surgery and Traumatology, Moscow, Russian Federation, 2Clinical Science, LLC Philips Healthcare, Moscow, Russian Federation, 3Emanuel Institute of Biochemical Physics, Russian Academy of Sciences, Moscow, Russian Federation, 4Semenov Institute of Chemical Physics, Russian Academy of Sciences, Moscow, Russian Federation
Synopsis
The main finding of the study is that the tNAA signal reduction in WM after mTBI is associated with a decrease in the NAAG concentration rather than a decrease in the NAA concentration, as was thought previously. This finding highlights the importance of separating these signals, at least for WM studies, to avoid misinterpretation of the results. NAAG plays an important role in selectively activating mGluR3 receptors, thus providing neuroprotective and neuroreparative functions immediately after mTBI. NAAG shows potential for the development of new therapeutic strategies for patients with injuries of varying severity
Introduction
Statistically, 80% of traumatic brain injury (TBI) cases are classified as mild TBI, and it is estimated that up to 600 individuals per 100,000 people suffer from mTBI annually worldwide. The majority of MRS studies have reported reduced tNAA signals in WM during the acute and subacute phases of injury, with subsequent recovery to normal values during the semiacute period. All of these studies have reported NAA changes based on tNAA measurements, referring that the concentration of NAAG is significantly less than that of NAA [1,2]. This assumption could rather be used for GM measurements but not for WM measurements, as the NAAG concentration in WM is significantly greater than that in GM [3]. NAAG concentration alterations could strongly influence the tNAA signal intensity and could thus result in misinterpretation of NAA changes in various pathologies, including mTBI.Thus the main aim of the study was to separately measure NAAG and NAA concentrations in WM using J-editing techniques in patients with mTBI in the acute phase.
Methods
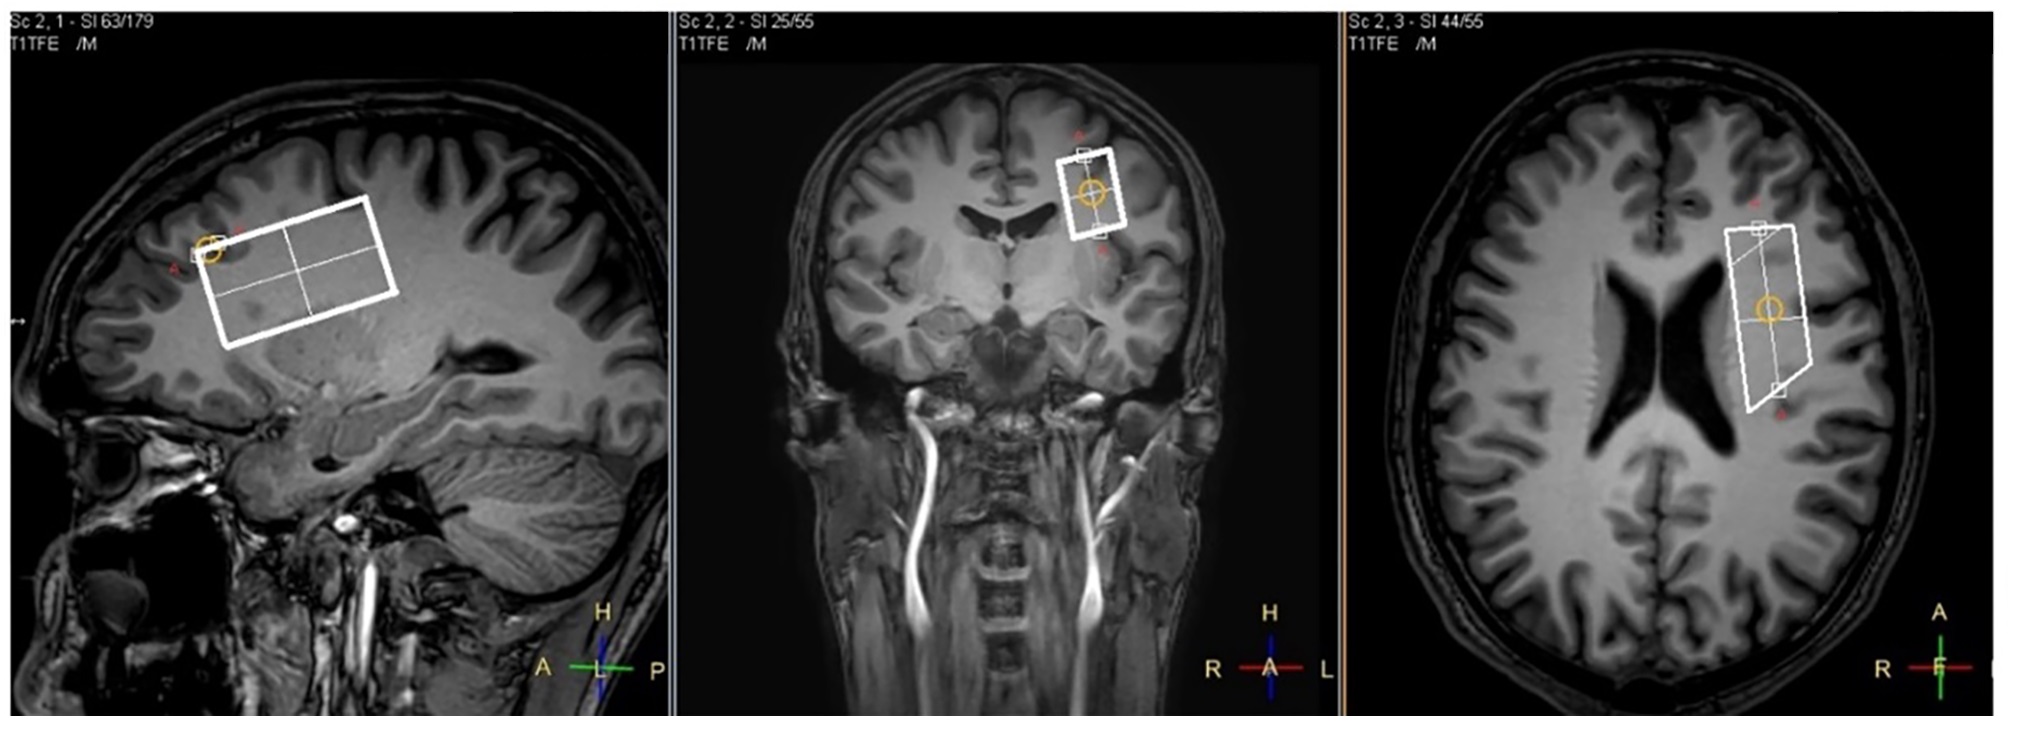
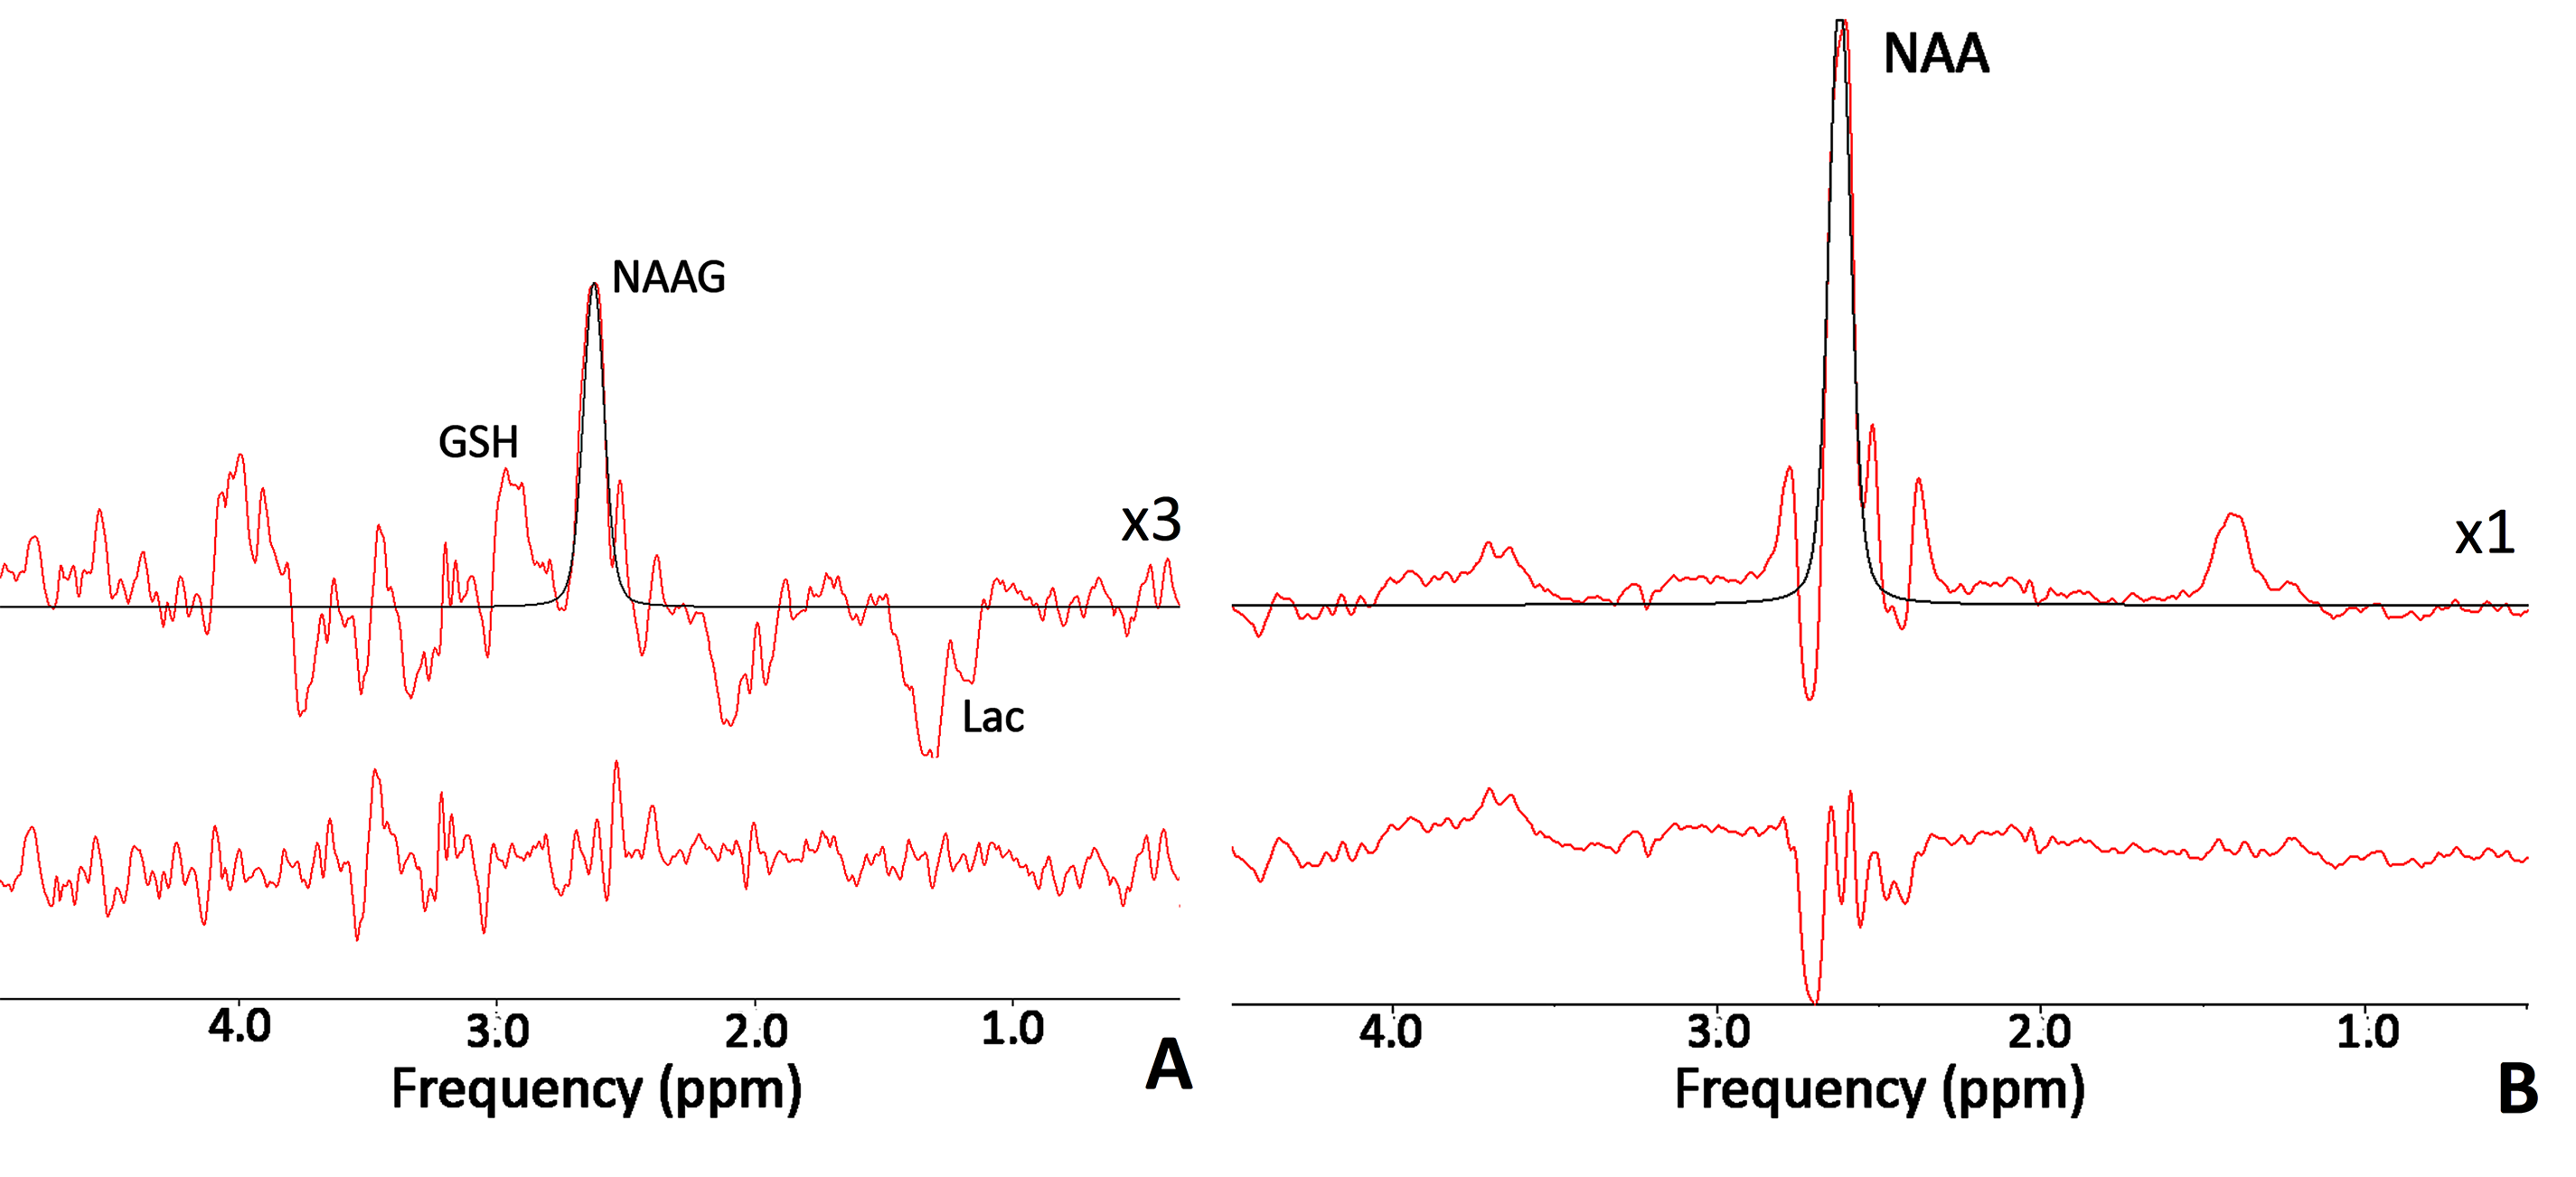
Twelve patients with closed concussive head injury and twenty-nine healthy volunteers were enrolled in the current study. Control group consist of 15 healthy controls. The patients and volunteers underwent MRI and MRS examinations in the hospital MRI unit using a 3.0 T Philips Achieva dStream MRI scanner. A 32-channel head coil was used for signal receiving. NAAG and NAA concentrations were measured in WM separately with MEGA-PRESS (TE/TR=140/2000 ms; / = 4.84/4.38 ppm, / = 4.61/4.15 ppm) [mega press]. The MEGA-PRESS spectra were accompanied by PRESS spectra (TE=35 ms; TR=2000.ms), as well as PEESS spectra without water suppression (TE = 35 ms; TR = 10000 s). All 1H MRS voxels 50×17×29 mm in size were placed in the normal-appearing brain tissue of the dorsolateral pre-frontal area (Fig. 1). The MEGA-PRESS spectra were analysed using the AMARES algorithm in jMRUI. The prior knowledge of the NAA and NAAG signals for AMARES fitting were as follows: δNAA=2.60 ppm, Gauss, phase 0°; and δNAAG=2.61 ppm, Gauss, phase 0°, respectively (Fig. 2). Using estimated NAAG and NAA to creatine values, the NAAG-to-NAA ratios <SNAA/SNAAG> were quantified. NAAG and NAA were calculated from the tNAA concentration with the following equation:[NAAG] = [tNAA]/(1+<SNAA/SNAAG>),
[NAA] = [tNAA] - [NAAG],
where tNAA concentration were quantified from PRESS spectra using LCModel routine taking into account voxel composition.
Results
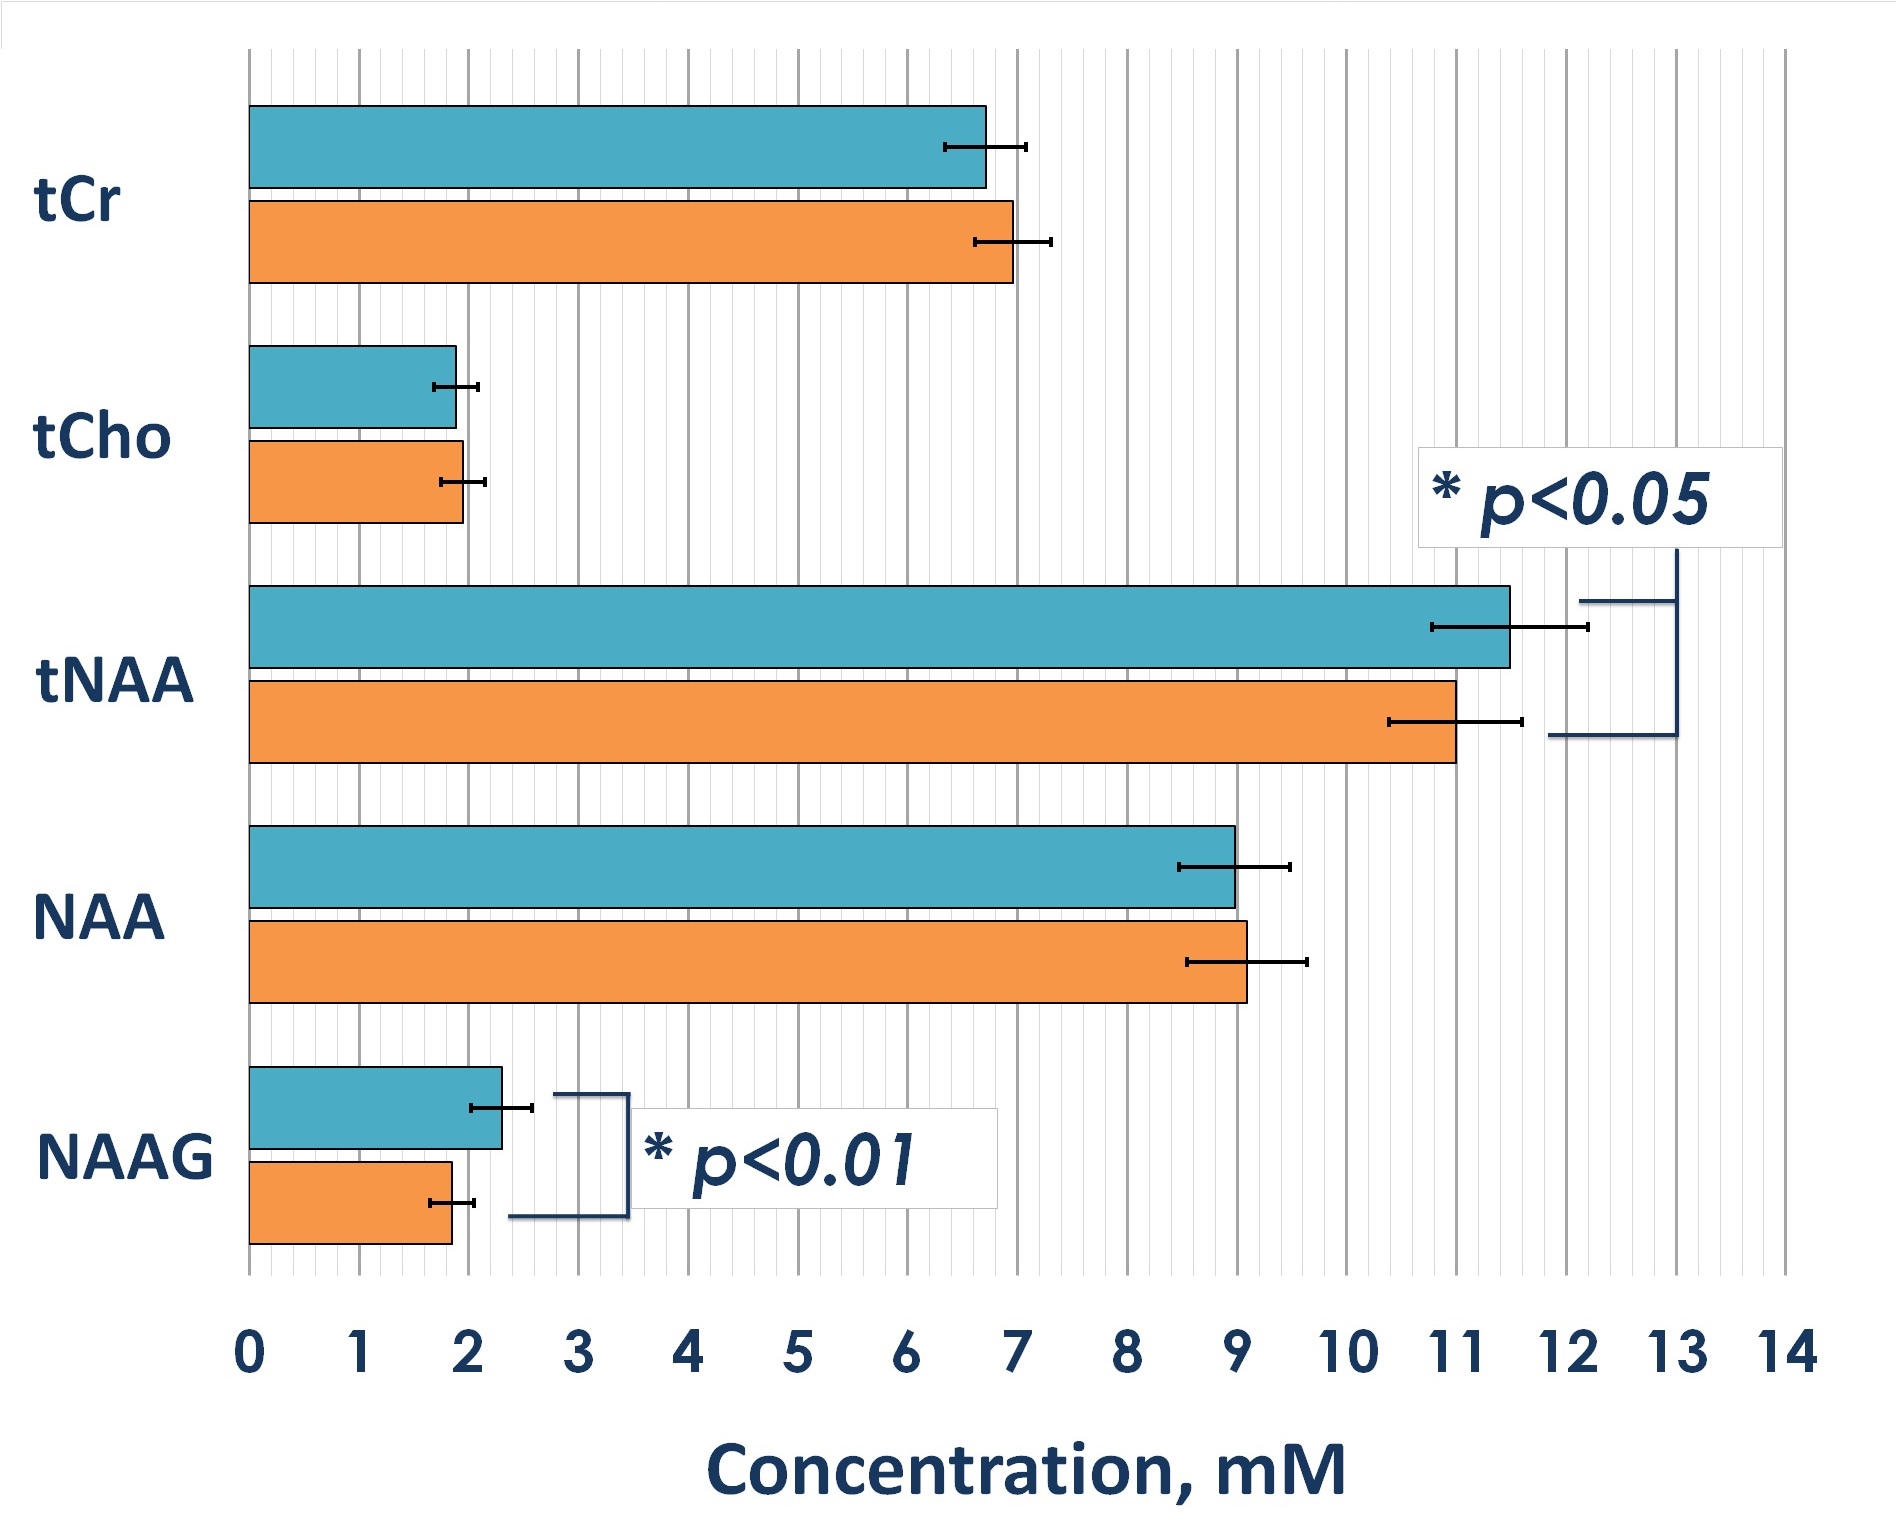
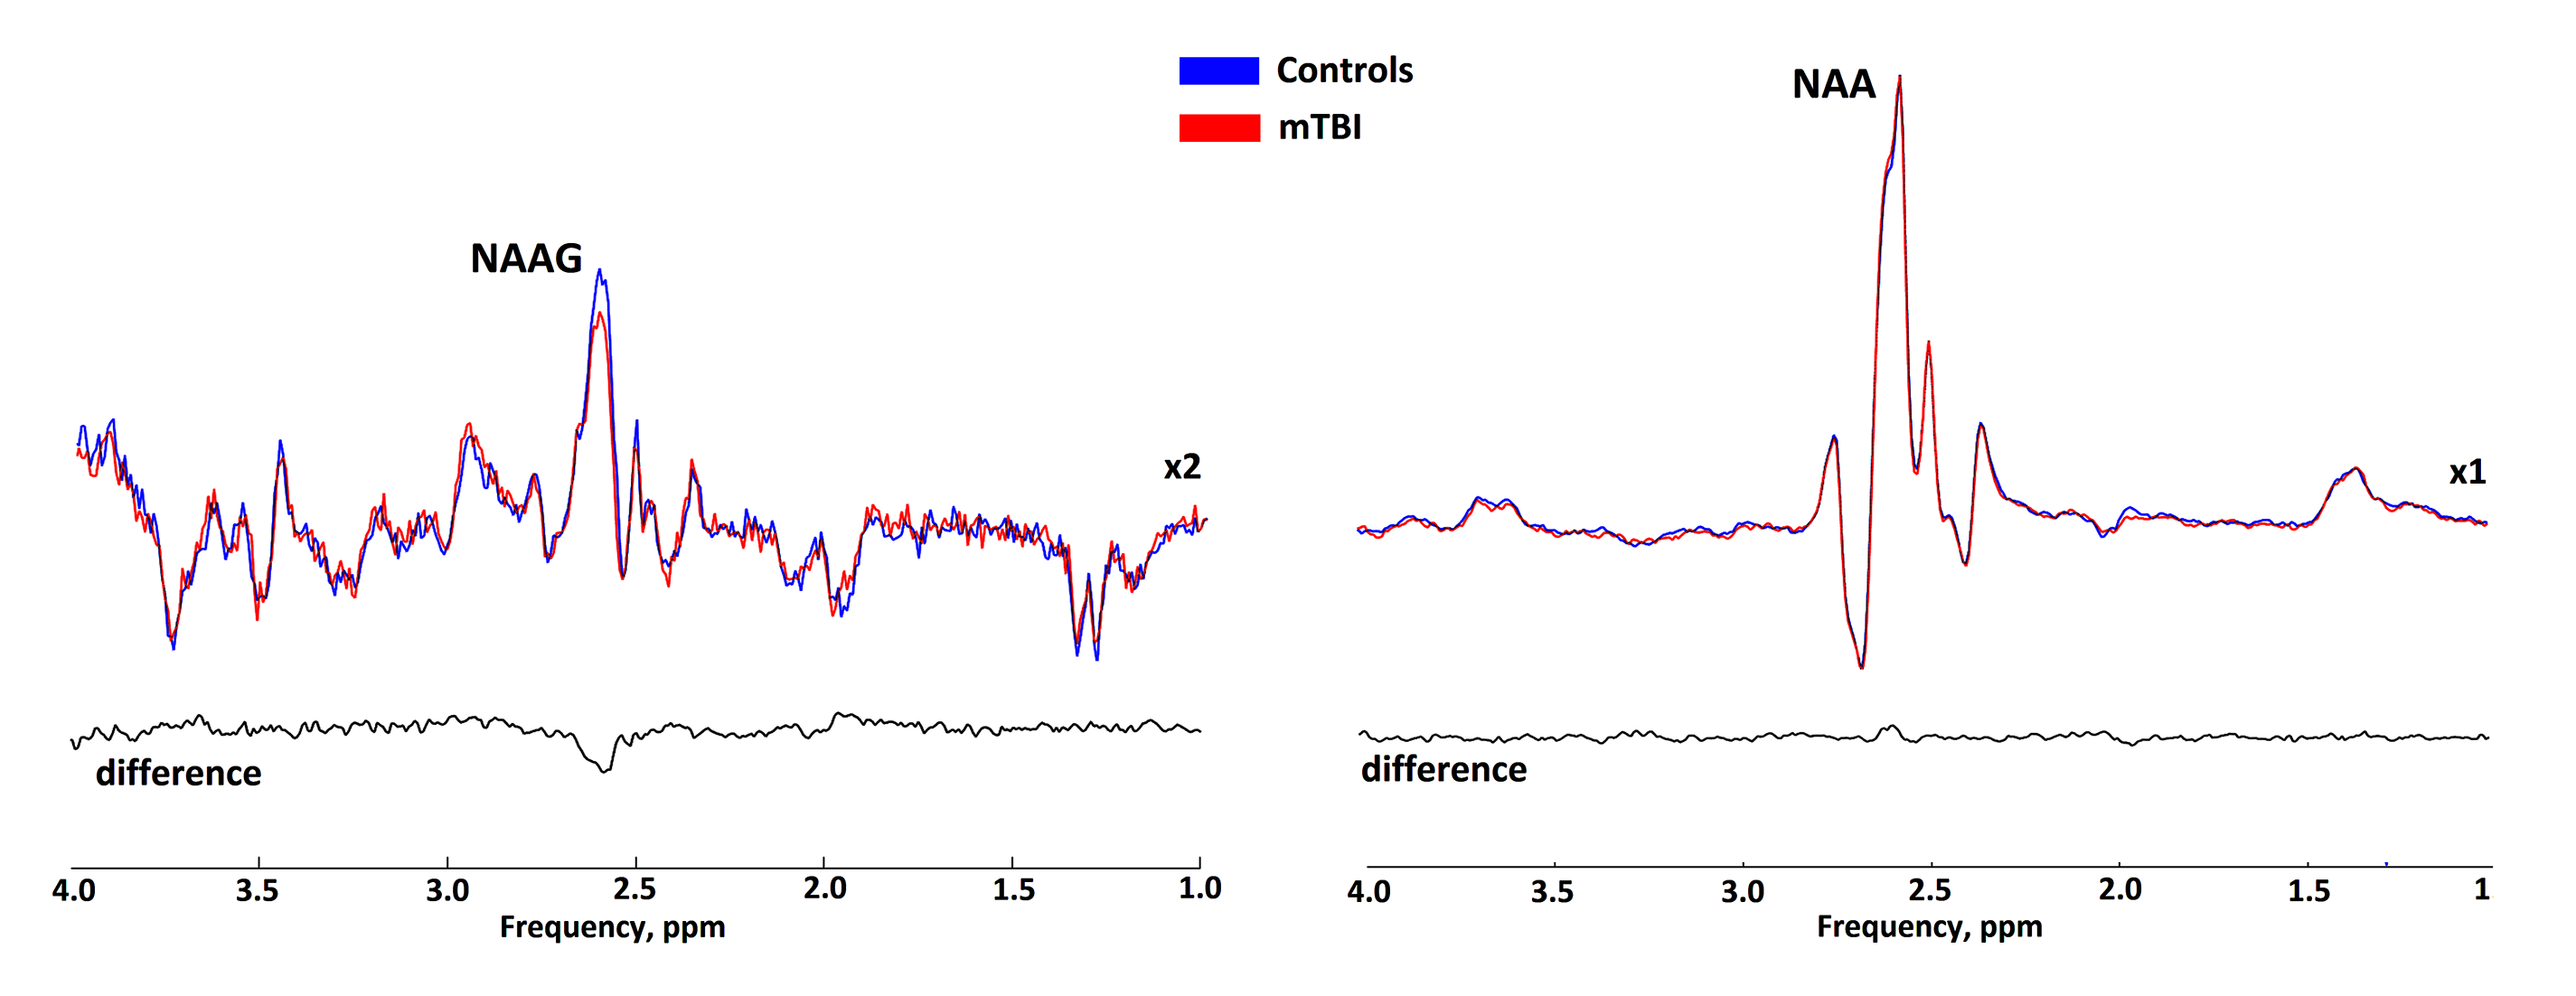
Statistical analysis revealed significant 4% and 6% reductions in both tNAA concentrations and tNAA/tCr ratios in patients with mTBI compared to controls, respectively (fig. 3). The reductions were associated with a reduction in NAAG, the concentration of which, according to our data, significantly decreased in the acute mTBI phase against a constant concentration of NAA (fig.4). The statistical analysis revealed significant reduction of both absolute and relative NAAG concentrations. The relative decrease in the NAAG concentration was 20%. There were not found any changes in NAA concentrations.Discussion and conclusion
The significant NAAG decrease after mTBI revealed in this study might be associated with the functions of NAAG in the brain and with NAAG synthesis and catabolism. NAAG has been reported to activate N-methyl-D-aspartic acid (NMDA) receptors in neurons and even to act as a partial antagonist of NMDA receptors. Therefore, NAAG reductions might be associated with increased NAAG consumption for binding with metabotropic Glu receptors (GluRs). Thus, damage due to excitotoxicity (a rapid cascade of neuronal depolarization and release of the excitatory neurotransmitter Glu) might be reduced, supporting a neuroprotective function of NAAG.NAAG is the most abundant neuropeptide in the mammalian brain (its concentration is as much as 1000-fold higher than that of any other peptide in the CNS). A major function of NAAG relates to its selective activation of the type 3 metabotropic GluR (mGluR3), a group II mGluR. Activation of presynaptic mGluR3 by agonistic binding of NAAG reduces neurotransmitter release, thus reducing Glu release from glutamatergic synapses. Moreover, activation of mGluR3 on astrocytes can also increase the expression of Glu transporters, thereby facilitating the removal of excess Glu from synapses. Therefore, reduced intracellular NAAG concentrations might be associated with increased consumption of NAAG for the subsequent realization of neuroprotective functions.
Moreover, NAAG’s activation of astrocytic mGluR3 initiates Ca2+ oscillations in astrocytes and releases second messengers to capillary endothelial cells, resulting in a local hyperaemic response. This response increases the supply of neurons with the necessary high-energy compounds for energy metabolism activation as well as excretion of the products of ATP reactions, thereby enabling the neuroreparative function of NAAG. Significantly higher rCBF values in the frontal lobe and left striatum than in other areas have been found in the acute phase after mTBI. Further study will provide perspective related to the development of new potential treatment strategies.
To sum up there is some evidence that NAAG performs neuroprotective and neuroreparative functions after TBI, which indicates its potential for the development of new therapeutic strategies for injured patients. Also, the current work is a good example of the risk of misinterpretation of conclusions based on the assumption that tNAA changes precisely reflect NAA alterations. This issue is especially critical for WM studies because the contribution of the spectrally overlapping NAAG to the tNAA peak is substantial (25%).
Acknowledgements
This work was supported by grants RFBR 17-04-01149 and RSF 18-1300030.References
[1] Henry LC, Tremblay S, Leclerc S, et al. Metabolic changes in concussed American football players during the acute and chronic post-injury phases. BMC Neurol. 2011;11(1):105. doi:10.1186/1471-2377-11-105
[2] Vagnozzi R, Signoretti S, Floris R, et al. Decrease in N-acetylaspartate following concussion may be coupled to decrease in creatine. J Head Trauma Rehabil. 2013;28(4):284-292. doi:10.1097/HTR.0b013e3182795045
[3] Choi C, Subroto G, Jinsoo U, et al. Measurement of N-acetylaspartylglutamate in the Human Frontal Brain by 1H MRS at 7T. Magn Reson Med. 2010;64(5):1247-1251. doi:doi:10.1002/mrm.22536
[4] Edden RAE, Pomper MG, Barker PB. In Vivo Differentiation of N-Acetyl Aspartyl Glutamate From N-Acetyl Aspartate at 3 Tesla. Magn Reson Med. 2007;57:977-982. doi:10.1002/mrm.21234
Figures