1070
Effects of vibration on cerebral blood flow using 3D arterial spin labeling imaging1Institute for Medical Imaging Technology, School of Biomedical Engineering, Shanghai Jiao Tong University, Shanghai, China, 2Shanghai United Imaging Healthcare Co Ltd, Shanghai, China
Synopsis
The relation between vibration and brain injury is still largely unknown. We applied a 30Hz vibration to brain and measured the cerebral blood flow (CBF) change using 3D arterial spin labeling perfusion imaging (3D-ASL). Results showed a decrease of CBF both regionally and globally after the vibration. This provided clues to understand the mechanism of traumatic brain injury.
Introduction
Traumatic brain injury (TBI) happens when brain deforms in skull due to external motion. Studies have used magnetic resonance elastography (MRE) to show that skull motion can affect the brain deformation and shed light on the mechanism of TBI 1,2. However, whether the skull motion can affect the cerebral flood flow is largely unknown. In this study, we proposed to use a head actuator to transmit vibrations to the brain and measure the cerebral blood flow (CBF) using 3D arterial spin labeling (3D-ASL) 3. CBF values before and after the vibration was measured and compared. Results will help understanding the CBF change during the head motion and provide helpful information for the mechanism of TBI.Methods
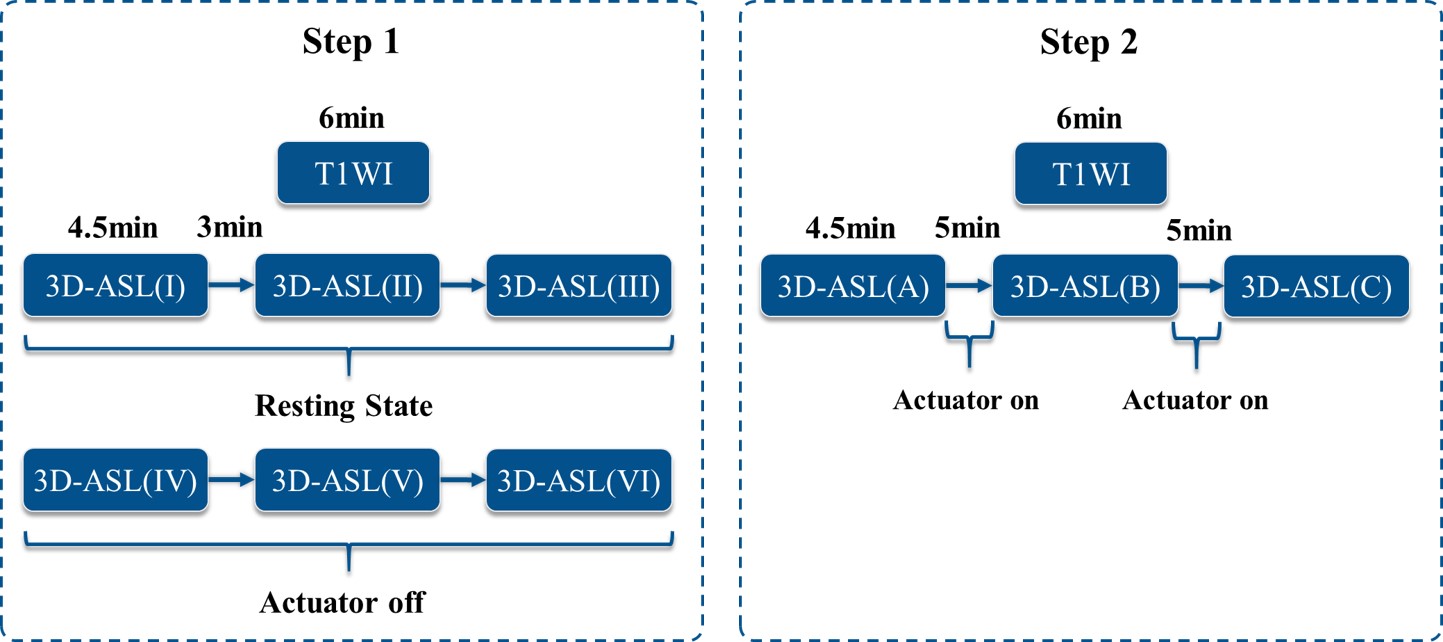
Four healthy volunteers with an age range from 22 to 26 years old were recruited. All subjects were scanned on a 3T MRI scanner (uMR790, United Imaging Healthcare, Shanghai, China) with a 24-channel head coil. The experiment included two steps (Figure 1): first, check if wearing the head actuator (off) could change CBF; second, quantify the differences of CBF before and after vibration. The CBF values after the vibration was measured twice. Before applying the vibration, high-resolution T1-weighted (T1W) images were acquired. The CBF after vibration was measured using a pseudo-continuous arterial spin-labeling (pCASL) sequence4 for 3D-ASL perfusion imaging. The following parameters was used: 12 tag-control image pairs, 34 transversal slice, TR/TE=4702/14.14ms, slice thickness=4mm, label duration=1.8s, post-labeling delay (PLD)=1.8s, FOV=224mm×224mm, voxel size=3.5×3.5×4mm. The CBF maps were registered to standard MNI152 brain atlas using Advanced Normalization Tools (ANTs)5. Frontal, occipital, temporal, and parietal images were segmented using a standard atlas6 (UNC adult brain atlas template, created by University of North Carolina at Chapel Hill). In the first step, the average regional and global CBF values difference between the three times resting states and control states were calculated and compared. And in the second step, the regional and global CBF values difference between before and after the first and second vibration were calculated and compared.Results and Discussions
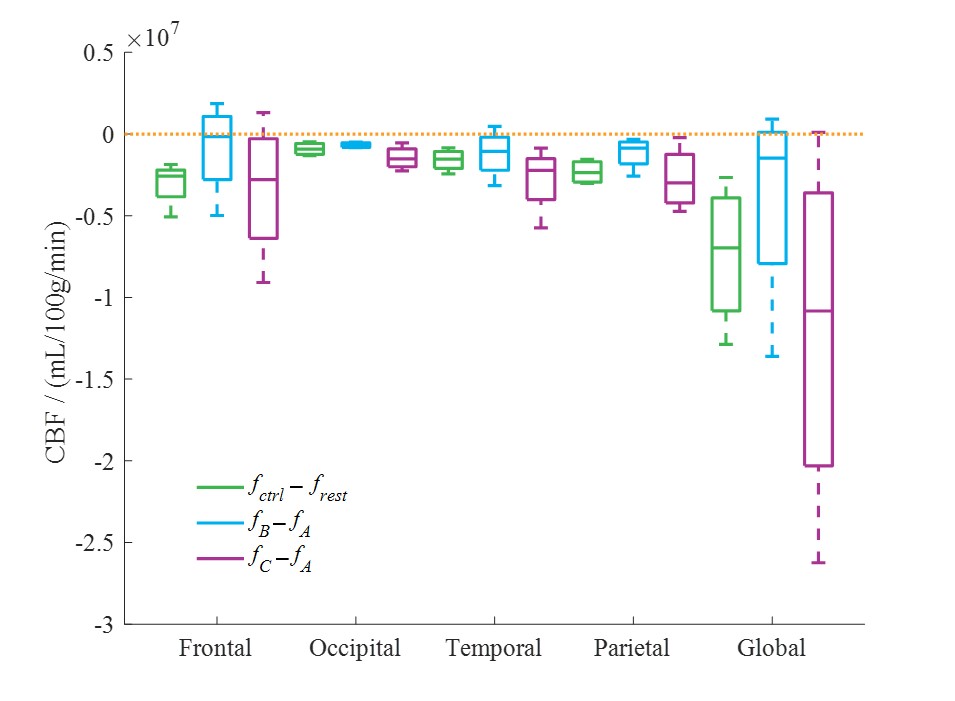
We observed a decrease of CBF, both for each brain regions and for the whole brain after the vibration. After the first applied vibration, the CBF values decreased by 2.01%, 5.57%, 5.13%, 3.65%, 2.93% for the frontal, occipital, temporal, parietal region, and the whole brain, respectively (Figure 2). For the second vibration, the CBF values decreased by 7.81%, 12.01%, 11.76%, 8.64%, 8.96% respectively. Compared with resting state, the mean CBF values decreased by 7.21%, 7.47%, 6.79%, 7.38%, and 5.57% for the frontal, occipital, temporal, parietal region, and the whole brain, respectively.Our preliminary findings are consistent with the previous study that concussion or mild traumatic brain injury (mTBI) patients may produce a pathophysiologic process resulting in altered CBF7. A possible explanation for this might be that vibration could have a concussion-like effect. The shear force generated by vibration may damage the brain tissue and capillaries. In addition, different vibration frequency may have difference effects on CBF. Future studies may increase the sample of subjects and determine which brain regions is more affected by vibration through voxel-based analysis.
Conclusions
Using 3D ASL, we observed decreased CBF values were observed after applying a 30Hz vibration to brain. Although the current study is based on a limited group of subjects, the findings suggested that vibrations could be an important factor for inducing injuries to the brain.Acknowledgements
Funding support from grant 31870941 from National Natural Science Foundation of China (NSFC) and grant 1944190700 from Shanghai Science and Technology Committee (STCSM) are acknowledged.References
1. Badachhape AA, Okamoto RJ, Durham RS, Efron BD, Nadell SJ, Johnson CL, Bayly PV. The Relationship of Three-Dimensional Human Skull Motion to Brain Tissue Deformation in Magnetic Resonance Elastography Studies. Journal of Biomechanical Engineering 2017;139(5):051002-051002-051012.
2. Badachhape AA, Okamoto RJ, Johnson CL, Bayly PV. Relationships between scalp, brain, and skull motion estimated using magnetic resonance elastography. J Biomech 2018.
3. Amukotuwa SA, Yu C, Zaharchuk G. 3D Pseudocontinuous arterial spin labeling in routine clinical practice: A review of clinically significant artifacts. Journal of Magnetic Resonance Imaging 2015.
4. Jung Y, Wong EC, Liu TT. Multiphase pseudocontinuous arterial spin labeling (MP-PCASL) for robust quantification of cerebral blood flow. Magnetic Resonance in Medicine 2010.
5. Avants BB, Tustison N, Song G. Advanced normalization tools (ANTS). 2008;1–35.
6. Vachet C, Bullitt E, Davis B, Gerig G, Styner M. UNC Adult Brain Atlas. 2009.
7. Wang Y, Bartels HM, Nelson LD. A Systematic Review of ASL Perfusion MRI in Mild TBI. Neuropsychology Review 2020(1):1-32.
Figures