1069
Study of brain abnormalities in Myalgic Encephalomyelitis /Chronic Fatigue Syndrome patients using diffusion tensor imaging1Griffith University, Gold Coast, Australia, 2Centre for Advanced Imaging, The University of Queensland, Brisbane, Australia
Synopsis
Myalgic Encephalomyelitis (ME)/Chronic fatigue syndrome (CFS) patients suffer from a variety of physical and neurological complaints indicating the central nervous system plays a role in ME/CFS pathophysiology. Structural and functional magnetic resonance imaging have been used to identify the pathomechanism of ME/CFS However, changes in tissue microstructure to understand the pathomechanism of ME/CFS using diffusion tensor imaging (DTI) have not been fully investigated. Our DTI study showed abnormality of the brain stem in ME/CFS patients relative to healthy controls.
Introduction
Myalgic Encephalomyelitis (ME) also known as Chronic fatigue syndrome (CFS) (ME/CFS) is a complex illness characterised by profound fatigue for more than 6 months that impairs cognitive and motor dysfunction, and unrefreshing sleep1. Patients who suffer from ME/CFS report a variety of physical complaints as well as neurological symptoms like cognitive impairment, loss of memory, and concentration. Structural2,3 and functional4 magnetic resonance imaging was used to seek a biomarker of the underlying causes of ME/CFS. However, findings are inconsistent across these studies5,6. Recently, diffusion tensor imaging (DTI) has been used to study tissue microstructural changes in neurodegenerative diseases7. DTI is a technique that provides information on the cellular structure by measuring the random motion of water molecules8. DTI metrics have been used to study white matter integrity, axonal damage, and myelin loss in neurodegenerative diseases7. However, only two studies have used DTI techniques especially fractional anisotropy (FA) to study microstructural changes in ME/CFS patients9,10. The first study9 showed increased FA values in right arcuate fasciculus whereas the second study10 showed a significant decrease of FA values in the genu of the corpus callosum and internal capsule of ME/CFS patients. These inconsistent findings in ME/CFS motivate further investigation with additional DTI metrics such as eigenvalues (λ1, λ2, λ3), FA, mean diffusivity (MD), and radial diffusivity (RD). In this study, we investigated tissue microstructural changes in ME/CFS patients to better understand the underlying causes of ME/CFS.Methods
The study was approved by the local human ethics (HREC/15/QGC/63 and GU:2014/838) committee of Griffith University and the Gold Coast University Hospital where scanning was performed. Written informed consent was obtained from 18 ME/CFS patients, meeting ICC criteria11, and 26 gender-matched healthy controls. The diffusion data were acquired using a 3T Skyra MRI scanner (Siemens Healthcare, Erlangen, Germany) with a 64-channel head-neck coil (Nova Medical, Wilmington, USA). Diffusion acquisition parameters 65 noncollinear directions at single shell b values (3000 sec/mm2) and one image was acquired without using any diffusion gradient. The parameter was as follow: repetition time/echo time = 5035/114.8 ms, field of view (FOV)= 230 $$$\times$$$230, matrix=96 $$$\times$$$96, voxel dimension of 2.4$$$\times$$$ 2.4 $$$\times$$$ 2.4 mm3, and 60 slices. The acquisition time was 11.26 minutes. MR images were acquired in both patients and healthy controls (HC) with the same scanner, using the same scanning parameters. Diffusion-weighted data were denoised and corrected for eddy current and motion distortion using mrtrix3 ( https://www.mrtrix.org/ ). Diffusion tensor, its three eigenvalues, and FA images were then calculated using tools provided with FMRIB’s Diffusion Toolbox (FDT, part of Software Library FSL12 (http://www.fmrib.ox.ac.uk/fsl). λ1, λ2, λ3, FA, MD, and RD maps were calculated using ‘dtifit’ and individual subject maps were aligned to the Montreal Neurological Institute (MNI) template using the tract-based spatial statistics (TBSS) toolkit of the FSL. Voxel-based statistical analysis of the λ1, λ2, λ3, FA, MD, and RD of the two groups was performed in SPM12. To test for group differences, a 2-sample T-test was performed controlling for age and gender. Voxel clusters in the T statistic map were defined using an uncorrected voxel p-value threshold (p<0.001, 0.002, 0.003, or 0.004) and a cluster size threshold of 100 voxels. Statistical inference was measured with the false discovery rate corrected cluster p-value (cluster p-FDR). Significant clusters were overlaid on T1-weighted image (mni_icbm152_t1_tal_nlin_sym_09a).Results
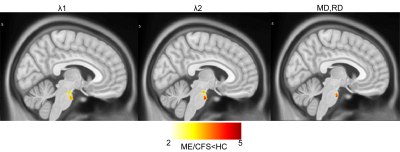
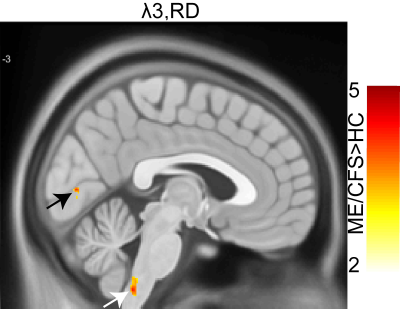
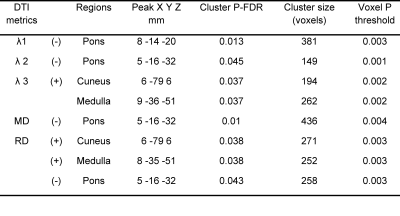
We performed voxel-based analysis on DTI metrics (λ1, λ2, λ3, FA, MD, and RD) estimated from 18 ME/CFS patients and 26 healthy controls data. Fig. 1 shows significant decrease in voxel clusters in λ1, λ2, MD, and RD in the pons region for the ME/CFS patients. Fig. 2 showed significant increases in voxel clusters for ME/CFS in λ3 and RD in the medulla region (white arrow) and cuneus (black arrow). Group comparison of FA did not show any significant cluster. Cluster statistics of DTI metrics are presented in Table 1.Discussion
We used DTI metrics to study tissue microstructural changes in ME/CFS patients compared to healthy controls. This is the first study to show significant decreases in MD, RD, λ1, and λ2, in the pons region of the ME/CFS patients. This could be due to an increase in cell density and/or reduced cell size13. We also found an increase in λ3 and RD in the cuneus and medulla region in ME/CFS patients compared to HC that could be due to changes in myelination7. Interestingly, FA did not show any significant differences between ME/CFS patients and HC, unlike other neurodegenerative studies7. Changes in MD and RD, but not FA, were also seen in traumatic brain injury14.Conclusion
In this study, we used DTI metrics to investigate microstructural abnormalities in ME/CFS patients. We concluded that eigenvalues (λ1, λ2, and λ3) and the derived metrics (MD and RD) are more sensitive to changes in tissue microstructure in ME/CFS patients. Additionally, brainstem abnormalities may be a diagnostic marker that better help us to understand the pathomechanism of ME/CFS patients.Acknowledgements
We thank the patients and healthy controls who donated their time and effort to participate in this study. This study was supported by the Stafford Fox Medical Research Foundation, the Judith Jane Mason Foundation (MAS2015F024), Mr. Douglas Stutt, and the Blake-Beckett Foundation, Ian and Talei Stewart, Buxton Foundation, and McCusker Charitable Foundation. The financial support did not affect any aspect of the study.References
1. Fukuda, K. The Chronic Fatigue Syndrome: A Comprehensive Approach to Its Definition and Study. Ann. Intern. Med. 121, 953 (1994).
2. Lange, G. et al. Brain MRI abnormalities exist in a subset of patients with chronic fatigue syndrome. J. Neurol. Sci. 171, 3–7 (1999).
3. Lange, G. et al. Quantitative assessment of cerebral ventricular volumes in chronic fatigue syndrome. Appl. Neuropsychol. 8, 23–30 (2001).
4. Barnden, L. R. et al. Intra brainstem connectivity is impaired in chronic fatigue syndrome. NeuroImage Clin. 24, 102045 (2019).
5. Cope, H. & David, A. S. Neuroimaging in chronic fatigue syndrome. J. Neurol. Neurosurg. Psychiatry 60, 471–473 (1996).
6. Lewis, D. H. et al. Monozygotic Twins Discordant for Chronic Fatigue Syndrome: Regional Cerebral Blood Flow SPECT. Radiology 219, 766–773 (2001).
7. Dong, Q. et al. Clinical applications of diffusion tensor imaging. J. Magn. Reson. Imaging 19, 6–18 (2004).
8. Pierpaoli, C., Jezzard, P., Basser, P. J., Barnett, A. & Di Chiro, G. Diffusion tensor MR imaging of the human brain. Radiology 201, 637–648 (1996).
9. Zeineh, M. M. et al. Right Arcuate Fasciculus Abnormality in Chronic Fatigue Syndrome. Radiology 274, 517–526 (2014).
10. Kimura, Y. et al. Brain abnormalities in myalgic encephalomyelitis/chronic fatigue syndrome: Evaluation by diffusional kurtosis imaging and neurite orientation dispersion and density imaging. J. Magn. Reson. Imaging 49, 818–824 (2019).
11. Carruthers, B. M. et al. Myalgic encephalomyelitis: International Consensus Criteria. J. Intern. Med. 270, 327–338 (2011).
12. Smith, S. M. et al. Advances in functional and structural MR image analysis and implementation as FSL. NeuroImage 23 Suppl 1, S208-219 (2004).
13. Weinstein, M. et al. Abnormal white matter integrity in young children with autism. Hum. Brain Mapp. 32, 534–543 (2011).
14. Maller, J. J. et al. The (Eigen)value of diffusion tensor imaging to investigate depression after traumatic brain injury. Hum. Brain Mapp. 35, 227–237 (2014).
Figures


